Highlights
- •
There is still uncertainty about PI-RADS 3 lesions.
- •
Machine learning (ML) models are effective in biopsy decision making in PI-RADS 3 lesions.
- •
Parameters such as SII, NLR help in cancer detection with ML in PI-RADS 3 lesions.
Abstract
Introduction
The objective of this study is to predict the probability of prostate cancer in PI-RADS 3 lesions using machine learning methods that incorporate clinical and mpMRI parameters.
Methods
The study included patients who had PI-RADS 3 lesions detected on mpMRI and underwent fusion biopsy between January 2020 and January 2024. Radiological parameters (Apparent diffusion coefficient (ADC), tumour ADC/contralateral ADC ratio, Ktrans value, periprostatic adipose tissue thickness, lesion size, prostate volume) and clinical parameters (age, body mass index, total prostate specific antigen, free PSA, PSA density, systemic inflammatory index, neutrophil-lymphocyte ratio [NLR], platelet lymphocyte ratio, lymphocyte monocyte ratio) were documented. The probability of prostate cancer prediction in PI-RADS 3 lesions was calculated using 6 different machine-learning models, with the input parameters being the aforementioned variables.
Results
Of the 235 participants in the trial, 61 had malignant fusion biopsy pathology and 174 had benign pathology. Among 6 different machine learning algorithms, the random forest model had the highest accuracy (0.86±0.04; 95% CI 0.85–0.87), F1 score (0.91±0.03; 95% CI 0.91–0.92) and AUC value (0.92±0.06; 95% CI 0.88–0.90). In SHAP analysis based on random forest model, tumour ADC, tumour ADC/contralateral ADC ratio and PSA density were the 3 most successful parameters in predicting malignancy. On the other hand, systemic inflammatory index and neutrophil lymphocyte ratio showed higher accuracy in predicting malignancy than total PSA, age, free PSA/total PSA and lesion size in SHAP analysis.
Conclusion
Among the machine learning models we developed, especially the random forest model can predict malignancy in PI-RADS 3 lesions and prevent unnecessary biopsy. This model can be used in clinical practice with multicentre studies including more patients.
1
Introduction
Prostate cancer (PCa) is the second most commonly diagnosed cancer in men, with approximately 1.4 million diagnoses and 375,00 deaths in 2020 [ ]. The higher prevalence of prostate cancer (PCa) can be attributed to the long-standing use of prostate-specific antigen (PSA) as a screening tool, leading to biopsies being conducted in all patients with elevated PSA levels. Excessive biopsy can lead to an increase in the identification of clinically insignificant prostate cancer (nsPCa) that does not require treatment, as well as severe complications such as urosepsis after the biopsy. Therefore, multiparametric MRI (mpMRI) and mpMRI-guided fusion biopsy have been frequently used in recent years to reduce unnecessary biopsies and increase the rate of PCa diagnosis.
The Prostate Imaging Reporting and Data System (PI-RADS) system was first created in 2015 to standardize the interpretation and reporting of prostate mpMRI data and was last updated in 2019 (PI-RADS V2.1) [ ]. In this system, a 5-point scale is used to evaluate features such as dynamic contrast and diffusion-weighted imaging [ ]. A multitude of studies have demonstrated that a higher PI-RADS score is associated with an increased likelihood of malignancy. In a meta-analysis of 17 studies, patients with biopsy-proven PCa were evaluated and PCa rates were reported as 16%, 59% and 85% for PI-RADS 3, 4 and 5 lesions, respectively [ ].
Despite the widespread use of the PI-RADS system in the diagnosis of PCa, the evaluation of prostate mpMRI depends on many variables, especially the experience of the radiologist [ ]. The variation in assessment becomes increasingly significant, particularly in PI-RADS 3 lesions characterized as a grey area, leading to ongoing debate on the clinical approach to managing these lesions. In a few studies evaluating patients with PI-RADS 3 lesions who underwent fusion biopsy, the PCa rate ranged between 5-30%, while the clinically significant PCa (csPCa) rate was lower in the final pathology results [ , ]. Therefore, it becomes important to differentiate PI-RADS 3 lesions between malignant and benign and to avoid unnecessary biopsies. On the other hand, avoiding unnecessary biopsies in PI-RADS 3 lesions may lead to missed diagnosis of PCa. This situation reveals the importance of a more detailed evaluation of PI-RADS 3 lesions.
Several studies in the literature have evaluated various clinical and radiological parameters that may predict the risk of PCa in PI-RADS 3 lesions. These parameters include age, PSA density (PSAD), prostate volume (PV), lesion volume and location, tumor apparent diffusion coefficient (ADC) / contralateral apparent diffusion coefficient (ADC) ratio, dynamic contrast enhancement (Ktrans, etc.) [ , ]. In some recent studies, parameters such as Myprostate score (MPS) and periprostatic adipose tissue measurement have been used to predict the need for biopsy and PCa in PI-RADS 3 lesions [ , ].
Nevertheless, there is currently no accurate method to anticipate the necessity of a biopsy in individuals with PI-RADS 3 lesions [ ]. Machine learning (ML), a prominent subfield of artificial intelligence that has experienced significant advancements in recent years, can be effectively applied in various domains of medicine, including this particular sector. ML models utilize datasets to identify new variables and complex relationships between them. In some studies, ML models have been shown to improve the prediction of PCa in patients with PI-RADS 3 lesions [ ]. However, most studies on PI-RADS 3 and ML models utilized radiomic characteristics of mpmRG and a restricted set of clinical factors.
In our study, we aimed to predict PCa with 6 different ML models in patients with PI-RADS 3 lesions using various clinical and radiomic parameters that have not been used before such as systemic inflammatory index, neutrophil neutrophil-lymphocyte ratio (NLR), platelet lymphocyte ratio (PLR) and lymphocyte monocyte ratio (LMR).
2
Material and methods
2.1
Ethics statement
This study received ethical approval from the Selcuk University School of Medicine Ethics Committee. (Ethics number: 2024/320)
2.2
Study population
A retrospective analysis was conducted on patients who presented to the Selçuk University Urology Clinic with lower urinary tract symptoms, had elevated PSA and underwent prostate mpMRI between 1 January 2020 and 1 January 2024. Patients who had PI-RADS 3 lesions on mpMRI and underwent fusion biopsy were included in the study. Patients with lesions other than PI-RADS 3, patients who did not undergo fusion biopsy, and patients with missing data were excluded from the study. The patients included in the study were recorded with respect to age, body mass index (BMI), total and free PSA values, and PSAD. PV, maximum length of the lesion, lesion location, lesion volume, tumour apparent diffusion coefficient (ADC) value, contralateral ADC value, tumour ADC/contralateral ADC ratio, Ktrans measurement and periprostatic fat thickness were measured from mpMRI imaging. Furthermore, the SII, NLR, PLR, and LMR values were calculated from the whole blood parameters of the patients included in the study.
2.3
Multiparametric MRI technique and ımage analysis
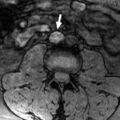
MR images were carried out on a 3T scanner (Skyra, Siemens AG Healthcare, Erlangen, Germany) with a pelvic-phased array coil. Our MRI protocols followed PI-RADS v2.1 included axial, sagittal and coronal T2-weighted turbo spin-echo sequence (TR/TE, 4000/100; FOV, 200 × 200 mm; number of signals averaged, 2; echo-train length, 23), DWI with a single-shot echo-planar imaging sequence (TR/TE, 3700/80; flip angle, 90°; matrix size, 160×95; slice thickness, 3 mm without gap; FOV, 260×210 mm; b values, 0 and 1000 s/mm2) and DCE-MRI with a 3D volume interpolated breath-hold examination (VIBE) gradient echo sequence (TR/TE, 5/1.69; FOV, 260×260 mm; flip angle 12°; slice thickness, 3 without gap; temporal resolution, 13 seconds; 36 contrast-enhanced phases acquired sequentially). After the first two phases of the dynamic series, 0.1 mmol/kg of gadobutrol (Gadovist, Bayer Schering Pharma, Berlin, Germany) was given intravenously at a rate of 3 ml/sec using an MR-compatible automated injector, followed by a 30 ml saline flush.
Two radiologists with five and two years of experience in mpMRI interpretation, respectively, conducted the PI-RADS analysis in a consensus manner. All images were transferred to a dedicated workstation (Syngo. via, Siemens, Germany) and analyzed with commercial software (MR Prostate, Siemens Healthcare AG). Radiologists determined periprostatic fat thickness by measuring the vertical distance from the mid-pubic symphysis to the prostate using sagittal T2-weighted images. The ADC values and ratio were obtained by placing a circular ROI covering the lesion on the ADC map and the opposite side in the normal parenchyma. The quantitative DCE-MRI was calculated using the Toft pharmacokinetic model. The data for Ktrans (influx volume transfer coefficient) and Ve (extracellular plasma volume) was obtained by defining circular ROIs on the lesions.
2.4
Biopsy technique
In prostate MR fusion biopsy, the transperineal approach has gained prominence in recent years [ ]. In our study, we included patients who underwent a transrectal fusion biopsy procedure due to the unavailability of a transperineal fusion biopsy procedure, which was limited by technical constraints.
An interventional radiologist with 3 years of experience in nonelastic fusion prostate biopsy performed an MR imaging-transrectal ultrasound fusion biopsy with the Logiq E9 VNav (GE Healthcare, Milwaukee). Target lesions were identified on T2 and ADC images for the MR imaging-transrectal ultrasound fusion biopsy technique. Each biopsy was performed under local anesthesia (prilocaine) in the left lateral decubitus position, utilizing endocavitary transducers and an 18-gauge side-notch cutting core biopsy needle (20-mm stroke length). At least 2 targeted lesion biopsies were conducted, followed by 12 core systematic biopsies. All pathological examinations were performed by the same pathologist.
2.5
ML for PI-RADS 3 lesion characterization
In our study, we aimed to differentiate between benign and malignant lesions of PI-RADS 3 using clinical, radiological, and laboratory data to prevent unnecessary biopsies. We employed ML techniques to develop models adhering to the STRAM-URO framework [ ]. We utilized Python 3.11.5 alongside commonly available standard libraries (pandas [2.1.1], numpy [1.26.0], scikit-learn [1.3.1], and matplotlib [3.8.0]) to develop ML models. Patients were randomly divided into a training set (70% of patients, n=165) and a test set (30% of patients, n=70) for each grade. This division allowed for independent evaluation while maintaining balanced class proportions across the entire cohort, training set, and test set.
We utilized random forest (RF), decision tree (DT), multilayer perceptron (MLP), K-nearest neighbors (k-NN), logistic regression (LR), and naive Bayes (NB) classifier algorithms to characterize PI-RADS 3 lesions. To compute accuracy, we adopted a nested 5-time cross-validation approach. This involved dividing the data into training and test sets for 20 repeated iterations of fivefold-stratified cross-validation, ensuring balanced class proportions across folds.
The top-performing models identified through cross-validated results were evaluated using the held-out evaluation dataset to determine their ultimate predictive performance across various parameters. This process was repeated 20 times to create a distribution of RF, DT, MLP, k-NN, LR, and NB prediction assessments on the test set. Consistently highly ranked and selected clinical, radiological, and laboratory data were considered as predictive indicators for further characterization of PI-RADS 3 lesions.
2.6
Model evaluation and performance metrics
To evaluate the effectiveness of ML models, we calculated accuracy, sensitivity, specificity, F1 score, and the area under the curve (AUC) for each grade. Additionally, we created receiver operating characteristic curves (ROC) for each model and grade. Performance metrics were computed for each repeat and cross-validation iteration of every model. Moreover, we determined the mean, standard deviation, and confidence intervals of the performance metrics for each model. We conducted Shapley additive explanations (SHAP) analysis to determine which parameter among radiological and laboratory parameters was successful in distinguishing between benign and malignant lesions in the ML models we developed.
2.7
Statistics
Frequency and percentage values were calculated for categorical data, and the chi-square test was utilized to analyze differences in categorical features. For numerical data, mean, standard deviation and confidence intervals were computed. The Kolmogorov-Smirnov test was employed for analyzing the distribution of data. Student’s t-test was used for data with a homogeneous distribution, whereas the Mann-Whitney U-test was used for data without a homogeneous distribution. Subsequently, data conforming to a normal distribution underwent analysis of variance (ANOVA), while the Kruskal-Wallis test was employed for non-normally distributed data. Post-hoc tests using the Bonferroni method were conducted to scrutinize groups responsible for significant differences. A P -value less than 0.05 was considered statistically significant. The data were analyzed using DATAtab online software (Graz, Austria: DATAtab, 2024)
3
Result
3.1
Patient characteristics
235 patients with PI-RADS 3 lesions (174 benign, 61 malignant) were included in the study. ( Table 1 ) The basic characteristics of the participants are outlined in Table 1 . There were no significant differences in age, weight, height, and BMI between patients with malignant and benign PI-RADS 3 lesions. ( Table 2 ) Participants with malignant lesions did not show a significant difference in average total PSA (10.59±9.14 vs. 8.84±5.72, ns), free PSA (2.03±2.35 vs. 1.94±1.96, ns), and Free/Total PSA (0.2±0.09 vs. 0.22±0.1, ns) values compared to participants with benign lesions. However, participants with benign lesions had a larger average PV compared to those with malignant lesions (85.51±38.7 vs. 67.95±41.83, P <0.001 ), while PSAD was higher in participants with malignant lesions (0.18±0.16 vs. 0.11+0.08, P <0.05 ).
| Histopathological diagnosis | Number (Percentage) |
|---|---|
| Benign Prostate Hyperplasia (Benign lesion) | 127 (54.04%) |
| Prostatitis (Benign lesion) | 47 (20%) |
| Prostate Cancer (Malignant lesion) | 61 (25.96%) |
| Total | 235 (100%) |
| Parameters | Overall PI-RADS 3 | Benign PI-RADS 3 | Malignant PI-RADS 3 | P value | |
|---|---|---|---|---|---|
| Patients, n (%) | 235 (100) | 174 (74.04) | 61 (25.96) | – | |
| Age, mean±SD, [95% CI] | 64.43±7.47 [63.46–65.39] | 64.21+7.25 [63.12–65.3] | 65.05+8.08 [62.98–67.12] | 0.45α | |
| Weight, mean±SD, [95% CI] | 80.93±11.84 [79.4–82.46] | 81.22+10.92 [79.58–82.86] | 80.1+14.22 [76.46–83.74] | 0.274β | |
| Height, mean±SD, [95% CI] | 171.86+6 [171.09–172.64] | 172.29+5.68 [171.44–173.15] | 170.64+6.72 [168.92–172.36] | 0.64β | |
| BMI, mean±SD, [95% CI] | 27.41±3.91 [26.9–27.91] | 27.4+3.72 [26.84–27.96] | 27.42+4.43 [26.29–28.55] | 0.976α | |
| Total PSA, mean±SD, [95% CI] | 9.29±6.8 [8.41–10.17] | 8.84+5.72 [7.98–9.7] | 10.59+9.14 [8.24–12.93] | 0.84β | |
| Free PSA, mean±SD, [95% CI] | 1.97±2.06 [1.7–2.23] | 1.94+1.96 [1.65–2.24] | 2.03+2.35 [1.43–2.63] | 0.165β | |
| F/T PSA, mean±SD, [95% CI] | 0.21±0.09 [0.2–0.23] | 0.22+0.1 [0.21–0.24] | 0.2+0.09 [0.17–0.22] | 0.126β | |
| Prostate Volume, mean±SD, [95% CI] | 80.95±40.2 [75.76–86.15] | 85.51+38.7 [79.69–91.33] | 67.95+41.83 [57.24–78.66] | <0.001 β | |
| PSA Density, mean±SD, [95% CI] | 0.13±0.11 [0.12–0.14] | 0.11+0.08 [0.1–0.13] | 0.18+0.16 [0.14–0.22] | <0.05 β | |
| SII, mean±SD, [95% CI] | 664.79±596.88 [587.66–741.91] | 722.64+661.08 [623.3–821.98] | 499.77+303.27 [422.11–577.43] | <0.05 β | |
| NLR, mean±SD, [95% CI] | 2.97±6.1 [2.18–3.76] | 3.21+7 [2.16–4.26] | 2.29+1.86 [1.81–2.77] | <0.05 β | |
| PLR, mean±SD, [95% CI] | 126.92±93.84 [114.79–139.04] | 133.21+105.16 [117.41–149.01] | 108.97+44.93 [97.46–120.47] | <0.05 β | |
| LMR, mean±SD, [95% CI] | 3.95±1.8 [3.72–4.18] | 3.99+1.92 [3.7–4.27] | 3.84+1.41 [3.48–4.2] | 0.967β | |
| MPV, mean±SD, [95% CI] | 10.76±9.87 [9.49–12.04] | 11.07+11.45 [9.35–12.79] | 9.9+0.99 [9.64–10.15] | 0.252β | |
| RDW, mean±SD, [95% CI] | 14.52±9.01 [13.36–15.69] | 14.87+10.42 [13.3–16.44] | 13.53+1.52 [13.15–13.92] | 0.57β | |
| Lesion Diameter, mean±SD, [95% CI] | 9.08±3.98 [8.56–9.59] | 9.26+3.98 [8.67–9.86] | 8.54+3.94 [7.53–9.55] | 0.169β | |
| Lesion Volume, mean±SD, [95% CI] | 0.98±0.92 [0.86–1.1] | 1.02+0.95 [0.87–1.16] | 0.88+0.83 [0.67–1.1] | 0.169β | |
| Ktrans, mean±SD, [95% CI] | 0.23±0.16 [0.2–0.25] | 0.23+0.16 [0.2–0.25] | 0.22+0.16 [0.18–0.26] | 0.7β | |
| Ve, mean±SD, [95% CI] | 0.37±0.19 [0.35–0.4] | 0.36+0.19 [0.34–0.39] | 0.39+0.17 [0.35–0.44] | 0.258β | |
| Tumor ADC, mean±SD, [95% CI] | 728.97±160.33 [708.25–749.68] | 751.83+148.43 [729.52–774.13] | 663.75+175.75 [618.75–708.76] | <0.001 α | |
| Contralateral ADC, mean±SD, [95% CI] | 1174.02±173.87 [1151.55–1196.48] | 1166.91+174.92 [1140.63–1193.2] | 1194.28+170.63 [1150.59–1237.97] | 0.291α | |
| ADC Ratio, mean±SD, [95% CI] | 0.62±0.12 [0.61–0.64] | 0.65+0.1 [0.63–0.66] | 0.56+0.14 [0.52–0.59] | <0.001 α | |
| Periprostatic Fat Thickness, mean±SD, [95% CI] | 4.16±2 [3.9–4.41] | 4+1.91 [3.71–4.28] | 4.61+2.18 [4.05–5.17] | 0.53β | |
| Lesion Localization, n (%) | CZ | 5 (2.13) | 4 (2.3) | 0.164 (chi2) | 0.164 (chi2) |
| PZ | 99 (42.13) | 67 (38.51) | 32 (52.46) | ||
| TZ | 131 (55.74) | 103 (59.2) | 28 (45.9) | ||
Related posts:
 Optimal imaging techniques across the spectrum of testicular cancer
 Defining the genetic profile of prostate cancer
 Real-world survival and economic burden among patients with locally advanced or metastatic urothelial carcinoma in the United States
 The value of a postoperative nomogram based on the primary tumor score for overall survival of patients with renal cell carcinoma and inferior vena cava tumor thrombus
 Serum glycosylated hemoglobin and prostate cancer risk: Results from a systematic review and dose-response meta-analysis
 Germline genetic testing for prostate cancer: Ordering trends in the era of expanded hereditary cancer screening recommendations
Stay updated, free articles. Join our Telegram channel

Full access? Get Clinical Tree


