Refractory cytopenias with unilineage dysplasia (RCUD)
Refractory anemia (RA)
Refractory neutropenia (RN)
Refractory thrombocytopenia (RT)
Refractory anemia with ring sideroblasts (RARS, ≥15 % BM ringed sideroblasts)
Refractory cytopenia with multilineage dysplasia (RCMD)
Myelodysplastic syndrome unclassified (MDS-U)
MDS associated with isolated del(5q)
Refractory anemia with excess of blasts-1 (RAEB-1, 5–9 % bone marrow blasts)
Refractory anemia with excess of blasts-2 (RAEB-2, 10–19 % bone marrow blasts)
Characteristics | Score values | ||||||
|---|---|---|---|---|---|---|---|
0 | 0.5 | 1 | 1.5 | 2 | 3 | 4 | |
Cytogenetics | Very good | – | Good | – | Intermediate | Poor | Very poor |
Blasts BM, % | ≤2 | – | >2– <5 | – | 5–10 | >10 | – |
Hb | ≥10 | – | 8– <10 | <8 | – | – | – |
Platelets | ≥100 | 50– <100 | <50 | – | – | – | – |
Neutrophils | ≥0.8 | <0.8 | – | – | – | – | – |
Total score | |
|---|---|
Risk group | Score |
Very low | ≤1.5 |
Low | >1.5–3 |
Intermediate | >3–4.5 |
High | >4.5–6 |
Very high | >6 |
Cytogenetic risk groups | |||
|---|---|---|---|
Prognostic subgroup | Cytogenetic Aberration | Median survival; yrs | Median AML-evolution 25 %; yrs |
Very good | -Y, del(11q) | 5.4 | NR |
Good | Normal, del (5q), del (12p), del (20q), double including del (5q) | 4.8 | 9.4 |
Intermediate | del (7q), +8, +19, i(17q), any other single or double independent clones | 2.7 | 2.5 |
Poor | −7, inv(3)/t(3q)/del(3q), double including −7/del(7q), complex: 3 abnormalities | 1.5 | 1.7 |
Very poor | Complex: >3 abnormalities | 0.7 | 0.7 |
Table 3.3
Age-related survival rates based on the International Prognostic Scoring System (IPSS-R) [17]
Age groups (years) | IPSS-risk categories (median survival, years) | ||||
|---|---|---|---|---|---|
Very low | Low | Inter-mediate | High | Very high | |
All | 8.8 | 5.3 | 3.0 | 1.6 | 0.8 |
≤60 | NR | 8.8 | 5.2 | 2.1 | 0.9 |
>60–70 | 10.2 | 6.1 | 3.3 | 1.6 | 0.8 |
>70–80 | 7.0 | 4.7 | 2.7 | 1.5 | 0.7 |
>80 | 5.2 | 3.2 | 1.8 | 1.5 | 0.7 |
Characteristics | Score values |
|---|---|
Performance status ≥2 | 2 |
Age, year | |
60–64 | 1 |
≥65 | 2 |
Platelets, ×10*9/L | |
<30 | 3 |
30–49 | 2 |
50–199 | 1 |
Hemoglobin <12 g/dL | 2 |
Bone marrow blasts, % | |
5–10 | 1 |
11–29 | 2 |
White blood cells >20 × 10*9/L | 2 |
Karyotype: 7 abnormality or complex ≥3 abnormalities | 3 |
Prior transfusion, yes | 1 |
Survival by risk group | |||
|---|---|---|---|
Score | Survival (median, months) | % at 3 years | % at 6 years |
0–4 | 54 | 63 | 38 |
5–6 | 25 | 34 | 13 |
7–8 | 14 | 16 | 6 |
≥9 | 6 | 4 | 0.4 |
Treatment Options in Elderly MDS Patients
Transfusion Therapy, Growth Factors and Iron Chelation
An essential goal in the treatment of senior MDS patients is to maintain or achieve red blood cell transfusion independence (RBC-TI), to counteract the consequences of cytopenias and to maintain and improve the health-related quality of life (QoL).
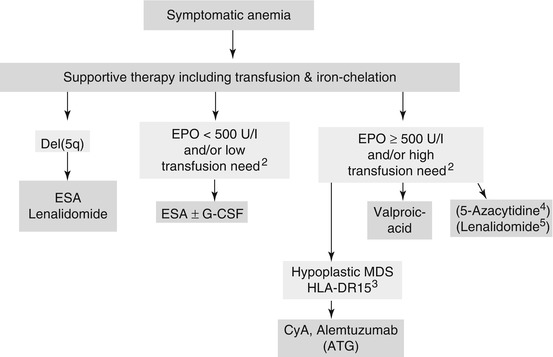
Anemia often represents the first symptom in MDS. Anemia is detected in 80–90 % of MDS patients and results in an impaired QoL and in a decreased overall survival. In addition a high red blood cell (RBC) transfusion frequency represents an unfavorable risk factor for survival [18]. Moreover anemia reduces functional, cognitive, and social capacities in elderly. Targeted transfusion therapy using RBC aims to reach a range of 80–100 G/L in cardio-respiratory healthy persons and >100–120 G/L in elderly and in persons displaying co-morbidities. Erythropoiesis-stimulating agents (ESAs) with or without granulocyte-colony stimulating factor (G-CSF) represent the standard of treatment for transfusion-dependent anemia in low-risk MDS (Fig. 3.1) [7, 14]. ESA-treatment aims to increase hemoglobin levels, to reduce transfusion need and to improve QoL. Predictive models for ESA treatment have been developed. Low endogenous erythropoietin (EPO) levels as well as a low transfusion need result in an increased response rate. The Nordic Score thus identifies patients with low, intermediate and high probability of response (Table 3.5) [19]. In addition G-CSF might augment the erythroid response to ESAs, particularly in patients with an increase of ring sideroblasts (RARS). ESAs have been used safely in larger numbers of MDS patients with no evidence for negative impact on survival or AML evolution [20–22]. However, the increased risk of thrombo-embolic complications in ESA-treated patients should be considered.


Fig. 3.1
Treatment options in anemic low-risk MDS (IPSS Low-grade und Intermediate 1). ATG anti-thymocyte globulin, CMML Chronic myelomonocytic leukemia, ESA erythropoiesis-stimulating agent, CyA Cyclosporin-A. 1 In MDS 5q – licensed by FDA and EMA. 2 Based on predictive model (Nordic score) for ESA treatment described in table 5. G-CSF might increase the erythroid response to ESAs particularly in MDS with an increase of ring sideroblasts (RARS). 3 Response more frequent in younger patients, in hypoplastic MDS and in HLADR-15. 4 5-Azacytidine might be effective in low risk MDS. However, EMA approval so far only for high-risk MDS and CMML. In contrast FDA-approval in low-risk MDS. Role in low-risk MDS is analysed in clinical studies. 5 Clinical studies in Non-5q- low-risk MDS are ongoing
Table 3.5
The predictive Nordic Score to assess response to erythropoiesis-stimulating agents (ESAs) in MDS [19]
Score | |
|---|---|
Transfusion requirement (RBC) | |
<2 U/month | 0 |
≥2 U/month | 1 |
Serum Epoa | |
<500 U/L | 0 |
≥500 U/L | 1 |
Total score | Probability of response (%)
Stay updated, free articles. Join our Telegram channel
Full access? Get Clinical Tree
 Get Clinical Tree app for offline access

|
|---|


