Mammalian target of rapamycin (mTOR) is a serine/threonine protein kinase. It is ubiquitously expressed in cells and is a therapeutic target for the cancer treatment arsenal. Despite the great responses obtained in tumors addicted to specific mutations or overactivation of key members of the mTOR pathway (HiF1α in RCC, cyclin D1 in MCL, or TSC in SEGA), mTOR inhibitors as single agents have modest activity. Dual PI3K/mTOR kinase inhibitors have been developed with the idea of overcoming resistance to the mTOR inhibition through preventing the activation of PI3K/Akt as a result of release negative feedback loops.
- •
Mammalian target of rapamycin (mTOR) is a serine/threonine protein kinase. It is ubiquitously expressed in cells and is a therapeutic target for the cancer treatment arsenal.
- •
Despite the great responses obtained in tumors addicted to specific mutations or overactivation of key members of the mTOR pathway (HiF1α in RCC, cyclin D1 in MCL, or TSC in SEGA), mTOR inhibitors as single agents have modest activity.
- •
Dual PI3K/mTOR kinase inhibitors have been developed with the idea of overcoming resistance to the mTOR inhibition through preventing the activation of PI3K/Akt as a result of release negative feedback loops.
mTOR pathway and function
Mammalian target of rapamycin (mTOR) is a serine/threonine protein kinase. It is ubiquitously expressed in cells and is a therapeutic target for the cancer treatment arsenal. The mTOR kinase was first identified during the study of the small molecule rapamycin (also known as sirolimus), a compound obtained from the bacterium Streptomyces hygroscopicus that was known to have antifungal properties. However, the use of rapamycin as an antifungal agent was abandoned when potent immunosuppressive and antiproliferative properties were observed. The mTOR kinase is part of a pathway that integrates signals that govern protein biosynthesis, cell growth, and cell cycle progression ( Fig. 1 ). mTOR protein is the catalytic subunit of two molecular complexes: mTORC1 and mTORC2. The rapamycin-sensitive mTOR complex 1 (mTORC1) contains mTOR, the regulatory-associated protein of mTOR (raptor), the proline-rich Akt substrate 40 (PRAS40), mLST8/G-protein β-subunit–like protein (GβL), and deptor. mTORC1 stimulates protein synthesis through phosphorylating the ribosomal S6 kinase 1 (S6K1) and the eukaryotic translation initiation factor 4E-binding protein 1 (4EBP1). S6K1 activates the ribosomal protein S6 that stimulates the translation of mRNA with a 5′ oligopyrimidine tract. This class of mRNA represents up to 30% of the mRNA that encodes many of the components of the protein synthesis machinery, including ribosomal proteins, translation initiation, and elongation factors. The phosphorylation of 4EBP1 (eIF-4E-binding protein) releases eIF4E, allowing the association of eIF4E with eIF4G to form the active eIF4F complex, a key component of the protein synthesis machinery that is particularly important for the translation of 5′ capped mRNA. The latter encodes relevant proteins for cell growth and cell cycle progression, such as growth factors (GFs), receptors, cyclins, c-myc, and signaling proteins. Thus, the activation of mTORC1 in response to insulin, GFs, availability of nutrients, oxygen, and increased intracellular levels of energy (high ATP concentrations) promotes ribosome biogenesis, protein synthesis, and angiogenesis to support cell growth and proliferation. Rapamycin and rapamycin derivatives (rapalogs) bind to FK506 binding protein 12 (FKBP12), which interferes with mTORC1 and inhibits its activation.
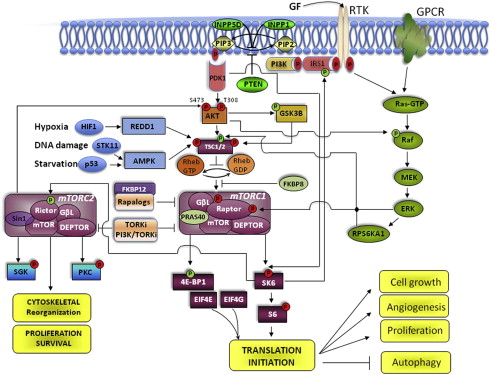
The more recently discovered mTOR complex 2 (mTORC2) contains mTOR, the rapamycin-insensitive companion of mTOR (rictor), mLST8, deptor, and the stress-activated MAPK-interacting protein 1 (Sin1). mTORC2 phosphorylates serum- and glucocorticoid-regulated kinase (SGK), protein kinase C (PKC), and also Akt at Ser 473, which in turn regulates cell cycle progression and survival. mTORC2 has also been involved in the organization of the actin cytoskeleton. Although mTORC2 has been described as the rapamycin-insensitive component of the mTOR pathway, prolonged treatment with rapamycin inhibited mTORC2 activity in PC3 xenografts and U937 lymphoma cells.
As the biogenesis of proteins is the most energetically expensive process performed by the cell, the activation of the protein synthesis machinery is tightly regulated and perfectly coupled to the availability of nutrients, oxygen, and GFs in the microenvironment. To optimize mTOR activation in response to these biologic conditions, the cell resorts to a coordinated interplay between positive and negative regulators of the molecules that participate in the mTOR pathway, and the activation of intrinsic feedback loops that modulate its function and impose a self-limiting control over its activation.
Upstream regulators of mTOR
Under normal physiologic conditions, amino acids, glucose, oxygen availability, and GFs are the key signals to stimulate mTORC1 activity. The intake of nutrients combined with adequate supplies of oxygen increase intracellular transport of glucose, glycolysis, the mitochondrial Krebs cycle, and production of ATP. ATP prevents the inhibitory effect exerted by AMP-activated kinase (AMPK) on mTORC1. Then, mTORC1 activation by increased pools of intracellular energy couples the intake of glucose and amino acids to protein synthesis. Growth signaling factors also play an important role in the regulation of mTOR activity. Growth factors (eg, epidermal growth factor [EGF], transforming growth factor [TGF], vascular endothelial growth factor [VEGF], hepatocyte growth factor [HGF], platelet-derived growth factor [PDGF], insulin-like growth factor 1 [IGF-1]) stimulate cell growth and mTOR activation through binding to the external domain of transmembrane receptor tyrosine kinases (RTKs). The ligand-receptor interaction induces a conformational change in the RTK-ligand complex that causes the intracellular region of the receptor to become active, effecting transfer of phosphate groups from ATP to the tyrosine residues on the receptor itself. The autophosphorylation of an RTK activates its enzymatic activity and phosphorylates the next protein in the kinase cascade of the PI3K/Akt/mTOR pathway. For example, In the case of the IGF receptor (IGFR), on binding of the IGF-1, the insulin receptor phosphorylates substrates 1 and 2 (IRS1-2), which relay the activation downstream to PI3K, in turn activating Akt through phosphorylation on Thr 308. Phosphorylated Akt unleashes mTORC1 through inactivating phosphorylation of three negative regulators. One is the tuberous sclerosis 1 (TSC1)/TSC2 complex, which prevents phosphorylation and activation of mTORC1 through inhibiting the Ras homolog enriched in brain GTPase (Rheb). The second is glycogen synthase kinase 3 beta (GSK3B), which inhibits mTORC1 through inducing AMPK-dependent activation of the TSC1/2 complex. The third is PRAS40, which competes with Rheb-dependent phosphorylation of raptor in the mTORC1 complex. Little is known about upstream regulators of mTORC2. However, because SGK and PKC are known to be regulated by GFs, regulation of mTORC2 has been thought to be modulated by the same GFs as mTORC1.
Negative regulators
The negative regulators of mTOR are biologic conditions and molecules that modulate upstream stimulatory signals to prevent uncontrolled cellular energy expenditure through limiting the activation of mTOR. The more effective negative regulator signals of the mTOR pathway are nutrient deprivation (starvation), hypoxia, and negative regulators of the PI3K/Akt/mTOR signaling pathway. The latter include primarily the TSC1/2 complex and the phosphatase and tensin homolog (PTEN). Nutrient deprivation, chemical inhibition of glycolysis, or inhibition of mitochondrial respiration activate the serine/threonine kinase 11 (STK11) that induces the AMPK-mediated activation of TSC1/2, with the subsequent inhibition of mTORC1 activity. Thus, through inhibiting mTORC1 activity, starvation prevents the biogenesis of lipids and proteins and promotes autophagy to optimize the use of limited energy supplies. Other adverse conditions, such as DNA damage and hypoxia, also promote the inhibitory effect of TSC1/2 on mTORC1. DNA damage prevents mTORC1 activation through the p53-mediated activation of AMPK, whereas hypoxia induces the activation of HIF1α-responsive RTP801 (REDD1), which antagonizes the Akt-mediated inhibition of TSC1/2.
Under normal physiologic conditions, the PTEN gene provides the paradigm for modulation of PI3K/Akt/mTOR signaling. On activation of RTK through ligand-binding, PI3K is activated and converts phosphatidylinositol 4,5-bisphosphate (PIP2) into phosphatidylinositol 3,4,5-triphosphate (PIP3), which triggers Akt phosphorylation and mTORC1 activation. Thus, conversion of PIP23 to PIP3 is a critical rate-limiting step to modulate the PI3K/Akt-dependent activation of mTOR. PTEN regulates the conversion of PIP3 to PIP2; therefore, PTEN loss of function provides the basis for aberrant activation of Akt and mTOR signaling, as is frequently seen in cancer. In addition to PTEN, the inositol polyphosphate-5-phosphatase and the inositol polyphosphate phosphatase-like 1 are also involved in the restoration of PIP2 levels and modulation of the PI3K/Akt/mTOR pathway activation.
Other negative regulators within the pathway are the FK506-binding protein 8 and PRAS40, which prevent Rheb from activating mTORC1. Less is known about repression of mTORC2; however, in vitro and in vivo studies have shown that mTORC1 activation prevents mTORC2 activity in an S6K1-dependent way, as shown through direct inhibitory phosphorylation of rictor at Thr1135 in mTORC2-active cells.
Negative feedback and positive feed-forward loops
Negative feedback and positive feed-forward loops are intrinsic mechanisms of self-control in the mTOR pathway that refrain or trigger its activation. For instance, activated S6K1 through mTORC1 phosphorylation blocks upstream overstimulation of the PI3K/Akt/mTOR through destabilizing IRS1-2 and uncoupling IGF-1 from the PI3K/Akt/mTOR cascade. Negative feedback control is also exerted by mTORC1 through preventing the activation mTORC2. In contrast, the 3-phosphoinositide–dependent protein kinase-1 (PDK1, known as PDPK1) can also directly activate S6K1 through Thr299 phosphorylation and prevent the uncoupling of IGF-1. In addition, the degradation of GSK3B through Akt phosphorylation reinforces the activation of mTORC1 through destabilizing the TSC1/2 complex.
Crosstalk
The Ras/Raf/MEK/ERK pathway is also a key regulator of cell growth and metabolism, cell division, and survival. This pathway is activated by GFs, hormones, neurotransmitters, and chemokines that signal through RTK and G protein-coupled receptors. These extracellular stimuli only partially overlap with those that signal through the PI3K/Akt/mTOR pathway. The degree of activation of each pathway depends on the interplay between GF availability and the density and distribution of RTK within the cell. In addition, a dynamic interaction or crosstalk between the PI3K/Akt/mTOR and Raf/Raf/MEK/ERK pathways provides a balanced cellular response to growth signals. Thus, inhibition of these interactions may result in unpredictable responses.
Examples of inhibition through negative crosstalk between PI3K/Akt/mTOR and Raf/Raf/MEK/ERK pathways are the inactivating phosphorylation of the N -terminus domain of Raf by Akt and the inhibition of PI3K/Akt/mTOR signaling through blocking of the recruitment of PI3K to the intracellular domain of RTK in response to GFs by Erk. An example of positive crosstalk is the enhanced PI3K/Akt/mTOR signaling in response to Ras/Raf/MEK/ERK activation that results in dissociation of the TSC1/2 complex, direct phosphorylation of raptor, and activation of mTORC1. In addition, inhibition of Akt or MEK can lead to the activation of other pathways through releasing interactive cross-inhibition.
mTOR in cancer
Tumors harbor a great spectrum of molecular alterations that deregulate the mTOR pathway and support the increased metabolic demands required by high rates of cell growth and proliferation ( Table 1 ). The spectrum of alterations observed in different tumor types include mutations of the PI3K/Akt/mTOR pathway members and regulators, mutations of p53 , deregulation of RTK activation through overexpression or increased affinity/availability of ligands, and alteration in crosstalk signaling and angiogenesis. Although no mTOR-activating mutations have been described to date, activating mutations of RTKs, more frequently of the catalytic alpha subunit of phosphoinositide-3-kinase (PI3KCA), a critical upstream activator of the PI3K/Akt/mTOR pathway, have been linked to overactivation of mTOR in human cancer tissues. Alternatively, inactivating mutations or deletions of suppressors is also a frequent mechanism of activation of the mTOR pathway. Most commonly, this involves the loss of PTEN function in tumor tissues, which constitutively activates Akt and mTOR in tumor cells. Heritable inactivating mutations of TSC1/2 , NF1 , and STK11 are less frequently observed. In the case of mantle cell lymphoma, mutations of STK11 uncouple the critical negative feedback of nutrient deprivation from the mTOR pathway. In addition, tumors that harbor p53 -inactivating mutations uncouple mTORC1 inactivation from DNA damage, which sustains aberrant mTOR activation.
| Gene | Mechanisms of Activation | Disease/Prevalence | Reference |
|---|---|---|---|
| EGFR | Overexpression | CRC (50%) | Yen et al, 2010 |
| Mutation | NSCLC (55%–80%) | Lynch et al, 2004 | |
| HER2 | Mutation | BC (25%–30%) | Slamon et al, 1989 |
| Ovarian (30%) | |||
| IGFR | Autocrine IGFR-IGF-1 loop | AML (35%) | Chapuis et al, 2010 |
| Overexpression | RCC (80%) | Schips et al, 2004 | |
| c – MET | Overexpression | RCC (100%) | Pisters et al, 1997 |
| PC (80%–100%) | Pisters et al, 1995 | ||
| PDGFR | Mutation | GIST (35% in KIT-negative) | Heinrich et al, 2003 |
| Overexpression | BC (39%) | Carvalho et al, 2005 | |
| VEGFR | Overexpression | CRC (52%) | Hashim et al, 2010 |
| Autocrine loop | GBM (100%) | Steiner et al, 2004 | |
| PTEN | Mutation | CRPC (20%–30%) | Suzuki et al, 1998 |
| Deletion | CRPC (30%) | Yoshimoto et al, 2007 | |
| Lost expression | CRPC (80%) | Bertram et al, 2006 | |
| PIK3CA | Mutation | BC (25%) | Bachman et al, 2004 |
| Mutation | CRC (20%–30%) | Frattini et al, 2005 | |
| Mutation | Glioblastoma (27%) | Samuels et al, 2004 | |
| Amplification | PC (50%) | Edwards et al, 2003 | |
| VHL | Mutation | RCC (60%–80% in sporadic RCC) | Gallou et al, 1999 |
| Ras | Overexpression | CRC (42%) | Karapetis et al, 2008 |
| Pancreas cancer (85%) | Laghi et al, 2002 |
In the absence of mutations, overactive PI3K/Akt/mTOR signaling can result from deregulated activation of different molecules that participate directly or indirectly in the pathway through feedback loops or crosstalk. RTK can be activated through increased binding affinity or availability of GFs. Rheb can be aberrantly activated by gene amplification, suggesting it is a proto-oncogene in prostate cancer. Alterations in the crosstalk between PI3/Akt/mTOR and the Ras/Raf/MEK/ERK pathways have also been described. Tumors that have overactive Erk sustain high mTORC1 activation in a PI3K-independent manner through dissociation of the TSC1/2 repressor complex that inhibits mTORC1. Dissociation of the TSC1/2 repressor by Erk is achieved through direct phosphorylation of TSC2 at Ser 664, resulting in release of TORC1, and through phosphorylation and activation of the TSC1/2 inhibitor ribosomal protein S6 kinase polypeptide 1 (RPS6KA1, also denominated RSK1).
Another mechanism of activation of the mTOR pathway in cancer is aberrant HIF1α activation. Under normal conditions, induction of HIF1α by hypoxia inhibits mTOR activation and stimulates the VEGF-VEGFR1-PAI1 angiogenic pathway, which is turned off as hypoxia subsides. In renal cell carcinoma (RCC), high levels of HIF1α transcriptional activity and increased angiogenesis are seen in the presence of adequate oxygen levels as a result of inactivating mutations of the Von Hippel-Lindau tumor suppressor gene (VHL) that prevent HIF1α degradation. Concurrently, HIF1α stimulation of glucose uptake (GLUT1, GLUT3) and glycolysis (PKM2, LDHA, ENO1) increases the nutrient availability and sustains high levels of PI3K/Akt/mTOR pathway activity. Thus, mTOR became a prime target for therapeutic inhibition in RCC, and this has proven to be an effective approach to controlling advanced metastatic disease.
Tumor cells can turn on an extensive, complex, and redundant network of proteins that support uncontrolled growth and survival, which is a major reason why specific inhibitors have limited success in killing human cancer cells and why resistance to therapy can develop rapidly.
mTOR pathway inhibitors in cancer
The inhibition of the mTOR signaling pathway by rapamycin was discovered in the early 1990s. Although the mechanism of rapamycin action (Rapamune) as an anticancer agent has not been completely elucidated, rapamycin binds to FKBP12, and the rapamycin-FKBP12 complex binds to mTORC1 to prevent phosphorylation of the mTORC1 effectors 4EBP1 and S6K1. Therefore, the inhibition of the mTOR pathway prevents protein synthesis and cell proliferation, arresting the cells in the G1 phase of the cell cycle.
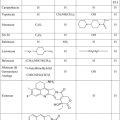
In the past 10 years, several agents have been designed to target the mTOR pathway. Temsirolimus, everolimus, and ridaforolimus are rapalogs that share the same mechanism of action but differ in pharmacokinetic properties because of different substitutions at position C-40 of rapamycin. Currently, temsirolimus and everolimus are approved for the treatment of metastatic RCC. More recently, everolimus has also been approved for treatment of subependimal giant cell astrocytoma and neuroendocrine tumors of the pancreas. Many other mTOR pathway inhibitors are being studied in clinical trials.
mTOR inhibitors approved by FDA for treatment of cancer
Renal Cell Carcinoma
In the United States 58,240 new cases of RCC were diagnosed in 2010, and 2.3% of cancer deaths are attributed to RCC. Most renal epithelial tumors are clear cell carcinomas, of which 80% show VHL loss of heterozygosity with inactivating mutations of the remaining allele. Despite complete surgical resection of localized tumors, 30% of patients experience recurrence with distant metastasis. Metastatic RCC is highly resistant to standard chemotherapy but sensitive to the immune-modulatory cytokines interleukin 2 and interferon (IFN)-alfa 2a ; the inhibitors of angiogenesis sunitinib (Sutent), sorafenib (Nevaxar), and bevacizumab (Avastin) in combination with IFN-alpha 2a ; and, two mTOR inhibitors, temsirolimus and everolimus, which were approved by the U.S. Food and Drug Administration (FDA) in 2007 and 2010, respectively.
Temsirolimus (Torisel) is a prodrug of rapamycin and the first mTOR inhibitor approved for increasing survival of patients with previously untreated metastatic RCC with poor prognostic features as defined by the Memorial Sloan-Kettering Cancer Center (MSKCC) prognostic model. A randomized phase II trial of temsirolimus at three doses (25, 75, and 250 mg) conducted in 111 patients with heavily pretreated metastatic RCC had shown a clinical benefit (objective and minor response plus stable disease) in 51% cases. Overall, the median time to progression was 6 months and the median overall survival was 15 months. Neither toxicity nor efficacy was influenced by temsirolimus dose levels, and because the intravenous infusion of 25 mg once weekly dose was the optimal biologic dose, it was selected for further clinical development.
The Global Advanced Renal-Cell Carcinoma (ARCC) multicenter phase III trial randomized 626 treatment-naive patients with advanced/stage IV RCC with poor prognosis to receive either weekly temsirolimus at 25 mg (TEM) or 3 million IU of subcutaneous IFN (with an increase to 18 million IU) or the combination of both temsirolimus at 15 mg plus IFN (TEM-IFN). Treatment groups, stratified by nephrectomy status and region, were well balanced. Clear cell RCC was the most common histologic type (80%) and nephrectomy was performed in 66% of cases. The primary end point was overall survival, and to reach statistical significance, a 40% improvement in either one of the temsirolimus-containing regimens was necessary over IFN. Overall survival was significantly longer in the TEM-only group than in the IFN-only group (10.9 vs 7.3 months; hazard ratio [HR], 0.73; 95% CI, 0.58–0.92; P = .008). The TEM-IFN combination did not significantly improved overall survival compared with IFN and had more toxicity (8.4 vs 7.3 months; HR, 0.93; 95% CI, 0.76–1.20; P = .7). The median progression-free survival according to RECIST criteria was 5.5, 4.7, and 3.1 months, respectively, for TEM, TEM-IFN, and IFN. The objective response rates were not significantly different among the three groups, 8.6%, 8.1%, and 4.8%, respectively. By contrast, the proportion of patients with a durable (>6 months) clinical benefit (objective response rate plus stable disease) was significantly higher in TEM and TEM-IFN compared with IFN (32.1%, 28.1%, and 15.5%; P <.001 and P = .002, respectively).
Asthenia was the most common adverse effect (60%) in patients receiving IFN alone or in combination. Temsirolimus-containing regimens showed a higher incidence of mild to moderate rash, peripheral edema, stomatitis, hyperglycemia, hyperlipidemia, and hypercholesterolemia. Grade 3/4 adverse events occurred in 67% of patients in the TEM arm, compared with 87% in the TEM-IFN arm ( P = .02) and 78% in the IFN arm ( P = .02). Grade 3/4 asthenia was reported in 11% of patients in the TEM arm, 28% in the TEM-IFN arm ( P <.001), and 26% in the IFN arm ( P <.001). TEM-IFN showed higher rates of grade 3/4 neutropenia and thrombocytopenia compared with TEM (15% and 9% vs 3% and 1%, respectively). Based on these findings, weekly temsirolimus at 25 mg was approved for first-line treatment of metastatic, poor-prognosis RCC. Responses were observed in all histologic subtypes, including sarcomatoid variants. The differences in efficacy among temsirolimus-containing regimens were attributed to lower mean dose-intensity of temsirolimus in the TEM-IFN arm (10.9 mg/wk) versus the TEM arm (23.1 mg).
Everolimus (RAD001) is the first oral mTOR inhibitor to reach the oncology clinic. Unlike temsirolimus, everolimus is not a prodrug of rapamycin and is taken daily by mouth in a 10-mg tablet.
The Renal Cell Cancer Treatment with Oral RAD001 Given Daily (RECORD-I) double-blind, placebo-controlled, multicenter phase III trial enrolled 410 patients with poor-prognosis RCC (MSKCC model) that progressed within 6 months of stopping treatment with either sunitinib, sorafenib, or both agents. All patients had the clear cell histologic type of RCC and were randomized in a 2:1 ratio to everolimus at 10 mg daily or placebo until disease progression. On progression, patients randomized to placebo were able to receive open-label everolimus. The study was powered to detect a 50% improvement in the primary end point of progression-free survival and two interim analyses were planned. Median progression-free survival of patients in the everolimus group was significantly longer than placebo (4.9 vs 1.9 months; HR, 0.33; 95% CI, 0.25–0.43; P <.001). The probability of remaining progression-free for at least 10 months was 25% in the everolimus group compared with less than 2% in the placebo. However, the overall survival in months was not significantly different because of the crossover effect (14.8 vs 14.4 months, respectively; P = .177). Objective response rate according to RECIST was observed in fewer than 2% of patients on everolimus. As expected, the incidence of adverse effects was higher in the everolimus group: mild to moderate stomatitis in 40%, rash in 25%, fatigue in 20%, and asthenia in 18%. Severe grade 3/4 adverse events were in the everolimus group were lymphopenia (14%), hyperglycemia (12%), anemia (9%), hyperphosphatemia (4%), stomatitis (3%), noninfectious pneumonitis (3%), and hypercholesterolemia (3%). Dose reduction from 10 to 5 mg was required in 39% of the patients and 13% of the total discontinued everolimus because of lung disorder or fatigue. Everolimus was approved by the FDA for increasing progression-free survival of patients with advanced RCC progressing after treatment with sunitinib or sorafenib.
Pancreatic Neuroendocrine Tumors
Pancreatic neuroendocrine tumors (PNET) represents 1.3% of all pancreatic cancer and according to the Centers for Disease Control and Prevention, approximately 1000 cases are diagnosed annually in the United States. However, although rare, its incidence is rising because of improvements in diagnostic methods. Everolimus and sunitinib, were recently FDA-approved for the treatment of metastatic or unresectable PNET.
The RAD001 in Advanced Neuroendocrine Tumors, third trial (RADIANT-3), a multicenter, double-blind, and placebo-controlled phase III study of everolimus at 10 mg daily was conducted in 410 patients with metastatic unresectable PNET. Patients were stratified by previous treatment and World Health Organization performance status and those randomized to placebo were allowed to crossover to everolimus at progression. The study was powered to detect a 50% improvement in the primary end point of progression-free survival. More than 90% of the patients had metastases and 24% had gastrinoma, VIPoma, insulinoma, or somatostatinoma. The median progression-free survival was significantly longer in the everolimus group (11 vs 4.6 months; HR, 0.34; 95% CI, 0.26–0.44; P <.001) ; the probability of remaining progression-free at least 18 months was 34% in the everolimus group and 9% in placebo. The objective response rate was not significantly different (5% in everolimus and 2% in placebo), indicating that the observed clinical benefit was primarily because of stabilization of the disease and that the lack of overall survival benefit was confounded by the high rate of patients on placebo who crossed over to everolimus at progression (73%). Most common adverse events associated with everolimus were stomatitis (52.9%), rash (48.5%), diarrhea (34.3%), and fatigue (32.4%). Grade 3 or 4 anemia (5.9%), hyperglycemia (5.9%), stomatitis (4.9%), and noninfectious pneumonitis (2%) events were rare but more frequent in the everolimus group.
The RADIANT-2 phase III trial randomized 429 patients with neuroendocrine tumors involving multiple sites and carcinoid syndrome to long-acting release (LAR) octreotide at 30 mg intramuscularly every 28 days in combination with either everolimus at 10 mg daily or placebo. Everolimus plus octreotide increased the median progression-free survival to 16.4 compared with 11.3 months for placebo. However, the HR fell short of the prespecified boundary of statistical significance (HR, 0.77; 95% CI, 0.59–1.00; one-sided, P = .026).
Subependymal Giant-Cell Astrocytomas in Tuberous Sclerosis
The tuberous sclerosis (TS) complex is a rare multisystem autosomal dominant disorder (1 in 6000 live births) that causes nonmalignant tumors to grow in the brain and on other vital organs. Subependymal giant-cell astrocytomas (SEGA) are slow-growing tumors that present in up to 20% of TS cases and typically arise from the foramen of Monro, blocking the circulation of the cerebrospinal fluid and leading to hydrocephalus. Current standard is surgical resection, which is not always possible.
A single-arm, open-label phase I/II trial conducted at the Cincinnati Children’s Hospital Medical Center enrolled 28 patients with SEGA to receive everolimus at 3 mg per square meter of body surface area. The primary end point of tumor reduction equal or higher than 30% was reached in 21 (75%) patients. The largest phase III study in TS that was presented at the International TSC Research Conference 2011 showed that 35% of patients treated with everolimus had a 50% or greater reduction in SEGA volume, whereas no responses were observed in placebo. On October 2010, the FDA approved everolimus for the treatment of SEGA in patients with TS who were not candidates for surgical intervention.
mTOR inhibitors in other malignancies
Hematologic Malignancies
Activation of the PI3K/Akt/mTOR pathway in non-Hodgkin’s lymphomas (NHL), Waldenström’s macroglobulinemia (WM), chronic lymphocytic leukemia (CLL), and acute leukemias provided the basis for testing rapalogs in these settings. Table 2 summarizes the results of rapalogs in hematologic malignancies. Mantle cell lymphoma (MCL) represents an ideal target for mTOR inhibitors because the t(11;14) translocation induces overexpression of cyclin D1 messenger RNA, which is regulated by mTOR.
Related posts:
 Topoisomerase 1 Inhibitors and Cancer Therapy
 Targeting Angiogenesis in Gynecologic Cancers
 Role of Histone Deacetylase Inhibitors in the Treatment of Lymphomas and Multiple Myeloma
 Topoisomerase 1 Inhibitors and Cancer Therapy
 Poly(Adenosine Diphosphate–Ribose) Polymerase Inhibitors in Cancer Treatment
 The Antifolates
Stay updated, free articles. Join our Telegram channel

Full access? Get Clinical Tree


