Imaging marker
1p/19q LOH
1p/19q intact
Location
Frontal lobe
Insular
Margin
Indistinct
Well-defined
T1/T2 signal
Heterogeneous
Homogeneous
Calcification
Common
Less common
Perfusion
Higher rCBV
Lower rCBV
PET tracer uptake
Increased FET, possibly increased MET
Not increased FET
One method that might increase accuracy for oligodendrogliomas genotype detection is textural analysis. Textural analysis is based on the automatic quantification of variations in signal intensity patterns on MR images that are often not recognizable by visual inspection. This encompasses pixel inter-relationships and spectral properties of images that can encode heterogeneity, coarseness, borders, and transitions. These data are combined to develop a texture signature, which is then correlated with clinical features of interest, such as 1p/19q allele status [16]. Using S-transform-based texture analysis, Brown and colleagues found that T2-derived texture features could differentiate 1p/19q intact and deleted tumors [17]. After optimizing the cut-off values for T2 retrospectively, the authors report that a prospective analysis using the application of spectral frequencies yields an accuracy of greater than 90% for the detection of 1p/19q LOH. Thus this appears to be a substantial improvement in the ability to detect 1p/19q LOH over efforts based on visual inspection of conventional MRI. In fact, the authors tested this possibility by using blinded experts to classify tumor genotype based on the methods described by Megyesi and colleagues [11]; they found that visual inspection alone yielded a sensitivity of 0.70 and specificity of 0.63, which appears to be substantially less than that for textural analysis. The next step will be to determine if textual analysis can maintain a high degree of accuracy when astrocytic tumors are included in the patient population.
10.5 Advanced MR Imaging
Advanced imaging also is being used to detect molecular features of gliomas including 1p/19q LOH. The term “advanced imaging” is somewhat ambiguous but generally comprises techniques such as perfusion and diffusion imaging that can depict and potentially quantify aspects of tumor physiology, adding potentially valuable information to the anatomic data that is derived from standard imaging. Aspects of tumor physiology that are thought to drive aggressive behavior including transformation to more malignant tumor phenotypes may have imaging surrogates. For instance, hypoxia can trigger an angiogenic switch leading to neovascularization and tumor progression. Hypoxia can be imaged directly or indirectly by several newer techniques including chemical exchange saturation transfer (CEST) MRI [18], 1-(2-Nitro-imidazolyl)-3-[18F]fluoro-2-propanol (FMISO) PET [19, 20] and proton and hyperpolarized C13 MR spectroscopy [21]. Perfusion imaging, which depicts aspects of blood flow to tumor tissue, can be used as a surrogate for angiogenesis.
Perfusion imaging is performed with MRI using a variety of methods including dynamic susceptibility contrast (DSC) and dynamic contrasted enhanced (DCE) techniques in addition to arterial spin labeling (ASL) [22]. Common perfusion metrics include relative cerebral blood volume (rCBV) measured by DSC imaging, Ktrans, a transfer coefficient that correlates with leakiness of the blood brain barrier derived from DCE perfusion, and cerebral blood perfusion (CBF) a measure of the amount of blood flow through tissue per unit time, which can be acquired with ASL imaging.
Diffusion weighted MR imaging is used to generate the apparent diffusion coefficient (ADC) value for voxels within tumor and brain. This measure of water diffusion correlates well with cell density, especially when little or stable amounts of edema are present (edema increases the ADC and thus can confound cell density measurements). In addition to overall diffusion, the preferential direction of water movement (anisotropic diffusion) may be determined using diffusion tensor imaging (DTI) [23].
PET scans can be used to measure glucose metabolism using FDG as a tracer, as well as cellular proliferation with 3′-deoxy-3′[(18)F]-fluorothymidine (FLT). Depiction of amino acid uptake as a generalized measure of cellular metabolic and protein synthetic activity also is possible with a variety of PET tracers. FDG PET for brain tumor imaging is limited by high background cortical uptake, which can mask tumor glucose metabolism. This limitation is not present for amino acid PET tracers. Thus amino acid tracers, while limited by availability, have recently gained ascendancy for the imaging of brain tumors [3].
10.6 Advanced MR Imaging for Detection of 1p/19q LOH
Given the limitations in accuracy provided by standard imaging, advanced MR imaging has been assessed as a non-invasive method to improve identification of 1p/19q loss in oligodendrogliomas. Methods examined include perfusion and diffusion MRI, as well as MR spectroscopy. Jenkinson and colleagues originally reported in 2006 that 1p/19q loss was associated with higher rCBV in a cohort of mixed tumor grade (II and III) and subtype (oligodendroglioma and oligoastrocytoma) [24]. Subsequently a group at the University of Pennsylvania [25] found that rCBV was elevated in tumors with 1p loss for grade II tumors, but not grade III tumors, which they later confirmed in a larger study [26]. Another group provided independent confirmation in 2013 [27]. Analyzing perfusion data using histograms (rather than “hot-spot” analysis) may improve the ability to identify both tumor grade and 1p/19q LOH status as Emblem and colleagues were able to separate six patients with low grade oligo without 1p/19q LOH from 46 other patients with grade II and III gliomas (both oligodendrogliomas and astrocytomas) with 93% accuracy [28]. It remains unclear why elevated rCBV, which is generally a predictor of more aggressive tumor, is associated with 1p/19 LOH tumors, which have a better prognosis. And why this is association is present in grade II but not grade III tumors also remains a mystery.
The added value of diffusion imaging in identifying 1p/19q LOH is less clear and discrepant results have been reported. Jenkinson and colleagues found that 1p/19q intact tumors had higher maximum ADC, but ADC did not differentiate between subtypes or grades [29]. Fellah and colleagues reported almost the exact opposite, specifically that ADC can help distinguish tumor grade, but is not associated with 1p/19q LOH [27]. The authors posit that this inconsistency may be explained by the small number of patients [17] in the Jenkinson study or potentially by differences in diffusion imaging acquisition protocols.
Another approach to identifying tumor subtypes is to measure metabolite concentrations using MR spectroscopy. MRS is commonly used to quantify N-acetyl aspartate (NAA), choline (Cho), and creatine (Cr). NAA is a marker of neural integrity. Choline is proportional to membrane turnover and has been shown to have a linear relationship with cell density in glioma [30]. Cr is a marker of energy storage, and is depleted in highly cellular tumors; therefore, the ratio of Cho/Cr ratio is commonly used to identify areas of greatest tumor burden.
MR spectroscopy has been analyzed alongside perfusion data to determine if the combination improves differentiation of genotypes [13]. Apparently the Cho/Cr ratio is slightly higher in 1p/19q LOH versus 1p/19q intact oligodendroglioma (grade II and III tumors), and a multivariate logistic regression model using maximum rCBV and metabolite ratios can slightly improve the accuracy of genotyping from 68 to 72%, a 4% gain. Similarly, although diffusion and perfusion imaging and MRS independently do not identify 1p19q LOH reliably, a multiparametric approach combining these modalities results in a 1p/19q LOH misclassification rate of 40%, slightly improved over the misclassification rate of 48% with conventional MRI sequences [27]. So to date, the value gain from physiologic imaging in determining 1p/19q LOH over standard MRI is marginal at best, and the misclassification rate remains unacceptably high.
10.7 IDH Mutation
The isocitrate dehydrogenase (IDH) mutation, an early mutation in gliomagenesis, has been identified in the majority of LGG, including both astrocytomas and oligodendrogliomas [31]. The IDH mutation is associated with a hyper-methylated phenotype and also results in the accumulation of the oncometabolite 2-hydroxy glutarate (2-HG) in tumor cells, providing a unique target for imaging.
10.7.1 IDH1 Mutation and Anatomic Imaging
IDH1 mutant tumors tend to have sharp margins (less infiltrative [32]) and are more homogeneous and less contrast-enhancing [33] than IDH1 wildtype tumors. Grade II and III tumors with imaging evidence of necrosis are more likely to be IDH1 wildtype and have a worse prognosis than tumors lacking evidence of necrosis by MRI [34, 35]. Immunohistochemistry with MRI coregistration has demonstrated that, as with wildtype tumors, IDH1 mutant LGG extend beyond the margin of the T2 signal abnormality [36, 37]. To date no imaging features from standard MRI have been identified that can reliably identify IDH1 mutant LGG.
Emerging evidence indicates that the anatomic location of gliomas is not evenly distributed throughout the brain. IDH mutant glioma are frequently present in the frontal lobe at the rostral aspect of the lateral ventricles as well as in the insula [38]; both of these regions also raise the possibility of an association with neural progenitor cells in the subventricular zone as the origin of IDH mutant gliomas. Similarly, using a voxel-based lesion symptom mapping (VLSM) atlas of 146 low grade gliomas Wang and colleagues [39] found that 102 of the tumors contained the IDH1 mutation, and these tumors were statistically more likely to be found to be in contact with the SVZ and to have rostral extension into the frontal lobe [39]. Frontal lobe preference has separately been reported for oligodendrogliomas with the 1p/19q codeletion [40, 41], which is not surprising since these tumors are frequently IDH1 mutated [31], and the IDH mutation precedes 1p/19q codeletion [42]. Similarly, when gliomas are limited to the insula, they are frequently (90%+) IDH1 mutated, whereas insular gliomas with extension to surrounding regions (paralimbic gliomas) have a lower rate of IDH1 mutation (approximately 50%) [43, 44].
There also appears to be a relationship between LGG location and brain regions defined by function as LGGs are located preferentially in secondary functional areas (cortical regions immediately adjacent to primary eloquent regions), including the supplementary motor area (SMA) in addition to the insula [45]. Compared to GBM, involvement of the SMA or insula is approximately twice as common in LGG. In consideration of the similarities in the computational roles of the insula and SMA, it has been hypothesized that a similar neuron-glial network may be utilized by these regions and may share a similar susceptibility to low grade glioma tumorigenesis. The reason for higher prevalence of LGG within the SMA and insula remains to be determined; and the progenitor cells of the SVZ hypothesis may not favor inclusion of the SMA as a typical site.
10.7.2 IDH1 Mutation and Advanced Imaging: Hypoxia/Angiogenesis
Several lines of investigation suggest that IDH1 mutant tumors are less angiogenic than their IDH wildtype counterparts. Using MR imaging, the IDH1/2 mutation is associated with decreased CBV compared to wildtype tumors in both low and high grade glioma [46–48]. Kickingereder and colleagues report that using genotype/imaging phenotype correlation the odds of an IDH mutation decrease by 69% for each one-unit increase in rCBV [47]. In that study, IDH1 mutant tumors also were found to express lower levels of angiogenic genes. The potential association between IDH1 and angiogenesis is further supported by in vitro studies. For instance, lactate production (a by-product of hypoxia, which in turn drives angiogenesis) is absent in in vitro models of IDH1 mutant LGG, but present in wildtype GBM cells [21]. Thus perfusion imaging may provide a useful non-invasive method that can help detect differences in angiogenesis between wildtype and IDH1 mutant tumors.
10.7.3 IDH Mutation and Diffusion Imaging
Diffusion imaging also has been applied to studies investigating the potential impact of the IDH1 mutation on imaging. Although values overlap, higher minimum ADC is found in anaplastic astrocytomas with versus without the IDH1 mutation [38]. Only limited data is available on the relationship between diffusion imaging and IDH mutational status in LGG. Multiple diffusion metrics, including the ratio of maximal fraction anisotropy and ratio of minimal ADC, (thought to in part reflect decreased angiogenesis and edema), can be combined to identify IDH1/2 mutant oligodendrogliomas with >90% accuracy [49].
10.7.4 IDH1 Mutation and MRS for the Detection of 2-HG
The IDH1 and 2 mutations result in the production of 2-HG, a chiral compound, similar to an amino acid. The (R) enantiomer is the species associated with the IDH mutation, and this molecule accumulates in IDH mutant tumors cells in high concentrations (5–35 mM) [50]. It was quickly realized after this discovery that proton MR spectroscopy could provide a non-invasive method to detect 2-HG, which consequently could be used to identify IDH1 mutated glioma. Furthermore, serially quantifying 2-HG levels, it was thought, might add value to standard MRI in determining treatment response as well as tumor progression and transformation.
In 2011, we were the first group to demonstrate that a technique called MR point-resolved spectroscopy (PRESS) could detect elevated 2-HG levels in gliomas with the IDH1 mutation (Fig. 10.1) [51–53]. We found that MRS data correlated fairly well with 2-HG levels determined by mass spectrometry of ex vivo samples, although there was some overlap in MRS-detected 2-HG levels between mutant and wildtype tumors (potentially false positives in the wildtype group). Our findings were quickly supported by data from several other groups for in vivo [54, 53] and ex vivo tumor specimens [55, 56]. Subsequently we unequivocally confirmed the ability of MRS to detect 2-HG using a murine flank xenograft model in which we compared IDH1 mutant- versus wildtype-transfected glioma models: 2-HG was detectable only in the tumors with the IDH1 mutation [57].
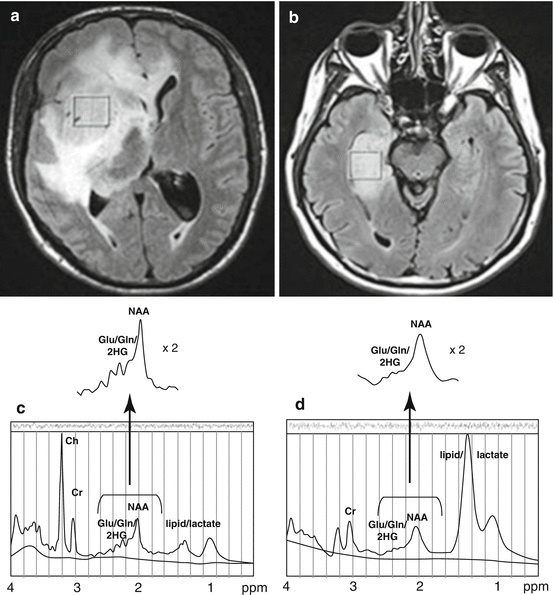

Fig. 10.1
MR spectroscopy detects elevated 2-HG concentration in IDH-1 mutant glioma. (a) FLAIR image of IDH1+ glioma and corresponding spectrum (c) demonstrating 2-HG and overlapping glutamate and glutamine peaks which can be resolved with computer modeling for 2-HG quantification. (b) FLAIR image of IDH1 wildtype glioma lacking measurable 2-HG (d). From Pope et al., 2012, reprinted with permission from Springer Science and Business Media
10.7.5 Technical Limitations
2-HG detection by MRS is hampered by overlying metabolite spectra, in particular that due to the structurally related molecules glutamate and glutamine. This can lead to false positive findings. Improved methods to separate the 2-HG signal from contaminating species include two dimensional correlation magnetic resonance spectroscopy (2D-COSY) [54] as well as difference editing [53]. Using 2D-COSY, a sensitivity of 2 mM for 2-HG detection has been achieved. Others have reported a sensitivity of 1.5 mM, yielding essentially 100% accurate for identifying grade II and III wildtype versus IDH1/2 mutants [53]. To date, no other group has achieved this level of accuracy.
Another limitation of MRS for measurement of 2-HG in brain tumors is the requisite large voxel size, up to 27 cm3 in some studies [54]. This can be problematic because smaller tumors may not entirely fill the voxel, leading to a dilution of tumor-associated metabolites due to incorporation of uninvolved brain parenchyma. The impact of small tumor size was demonstrated in a study in which 2-HG was detected by MRS in only 8% of small tumors (<3.4 mL) but in 91% of large (>8 mL) tumors, an impressive difference in sensitivity [58]. This may be a particularly important limitation following surgery when volumes of residual tumor can be quite small.
One way to improve separation of metabolite peaks is to use higher field strength magnets. This method led to the successful detection of 2-HG with an only 20 s acquisition time (studies using 3T typically have an acquisition time of 5–20 min) [59]. Other groups have also shown potential sensitivity gains for 2-HG detection using 7 Tesla (T) ultra-high field strength systems [60].
Another method developed to improve detection of IDH mutant tumors is to analyze multiple metabolite concentrations rather than 2-HG alone. Because glutamate levels are diminished in IDH1 mutant compared to wildtype glioma, models incorporating glutamate appear to improve sensitivity for the IDH1 mutation [61].
10.7.6 Clinical Utility of 2-HG Measurements
As improved methods to non-invasively detect 2-HG levels in IDH1 mutant gliomas have been developed, attention has turned to the potential clinical utility of these measurements. De la Fuente and colleagues integrated MR spectroscopy into routine glioma imaging in 89 consecutive glioma patients [58]. In pre-op patients 2-HG levels corresponded to tumor cellularity, (an expected finding since it is the tumor cells that are producing 2-HG), but not with mitotic index or tumor grade. A significant limitation of the study was that the sensitivity of 2-HG detection in IDH1 mutant tumors was low—only 48%, apparently related to small tumor size in many of the enrolled patients. The authors report that, at least in one patient, reduction in 2-HG paralleled decrease in tumor volume during treatment. This is similar to another study which reported that 2-HG levels decreased in IDH1 mutant glioma patients after chemotherapy and radiation and that the volume of decreased 2-HG correlated with improved clinical status [62]. Survival data for this patient cohort is pending. Interestingly, change in FLAIR volume did not correlate with change in functional status. So the key question remains whether 2-HG measurements add value to standard MRI for detecting treatment benefit. One cautionary piece of data is that, at least in one report, there did not appear to be a survival difference between IDH1 mutant tumors with high versus low 2-HG [63]. Thus it is unclear how 2-HG levels, and therefore the drugs that target 2-HG production, impact patient outcomes.
10.8 Tumor Grading
Routine imaging suffers from poor accuracy in determining glioma grade [64]. Although in general GBM can be identified on standard imaging as ring enhancing lesions with evidence of necrosis and peritumoral edema, it is typically much more difficult to distinguish grade II and III gliomas, particularly when faced with a non-enhancing lesion with scant edema. Thus there may be a role for advanced imaging to identify LGG.
In oligodendrogliomas, the relationship between rCBV and tumor grade is unclear. Some have found no relationship [24], whereas other studies indicate a statistically significant correspondence between higher rCBV and higher tumor grade [26, 27]. A 76% accuracy for differentiating grade II and III oligodendrogliomas using a mean plasma volume derived from DCE MRI has been reported [65]. Discrepant conclusions may be due to the observation that, for unknown reasons, low grade oligodendrogliomas oftentimes exhibit focal areas of high rCBV [66] that may degrade the specificity of this metric [66]. Of note, CBV was a superior classifier of tumor grade compared to contrast-enhancement alone [66].
Falk and colleagues focused on identifying tumor grade in patients (n = 25) with suspected new diagnosed LGG (astrocytoma and oligodendroglioma), using both DSC and DCE perfusion MRI [67]. They found metrics for both modalities with moderate predictive ability for grade II versus III histology: DCE Ktrans skewness and rCBF both had accuracy of approximately 80%. DSC and DCE perfusion MR appear to be comparable in the ability to differentiate grade II and III gliomas [68]. Multiple other studies have assessed the ability of MR perfusion to separate tumors by grade, although a universal threshold has not yet been established [69–71].
ADC may help identify regions of higher tumor grade, and differentiate low from high grade gliomas. Accurate ADC-based grading is impeded by histological changes that can impact water diffusion such as mass effect from tumor and edema which do not necessarily correspond to a higher tumor grade. Advanced diffusion metrics derived from diffusion tensor imaging, which depict the relative direction of water motion, may improve the ability to assign tumor grade. One study found that diffusion tensor imaging, but not perfusion imaging, accurately discriminated low versus high grade non-enhancing glioma with a specificity of 92% and sensitivity of 87% [72].
The clinical utility of determining tumor grade by MRI is questionable, as most tumors proceed to biopsy or resection where the tumor grade and type will be definitively established histopathologically. Additionally, resected tissue provides the opportunity for full molecular characterization of tumors, which is becoming more critical to patient management decisions. However, some tumors may be located in areas that preclude biopsy due to unacceptable risk. Lastly, biopsies may under-grade tumors due to sampling error, i.e. not sampling the most malignant portions of the tumor. Thus there is a limited, but still impactful, role for imaging in identifying tumor grade [73].
10.9 Prognosis and Detecting High-Grade Transformation
LGG oftentime undergo transformation to higher grade (grade III and grade IV) tumors which usually signals a period of increased growth and treatment resistance, ultimately leading to the patient’s death. Thus there is great interest in early markers of this transformation. Traditionally the development of contrast-enhancement in previously non-enhancing tumors is thought to be indicative of development of grade III/IV tumors. However, this simplistic approach may be inaccurate. For example, in a series of 108 grade II glioma, contrast enhancement as a marker for higher grade histology had a sensitivity of 92% but a specificity of only 57% [74]. Clearly, specificity needs improvement.
Neo-angiogenesis, i.e., microvascular proliferation, is a required step in the transformation of low- to high-grade glioma and may be detectable by perfusion imaging. Microvascular proliferation is typically absent in LGG and they usually have low levels of perfusion as measured by MR [75]. In 2001, Fuss and colleagues demonstrated that in patients with low-grade-astrocytoma (n = 25) treated with fractional stereotactic radiotherapy, tumors progressing prior to 42 months after radiotherapy had higher pretreatment rCBV than those that recurred later [76]. Subsequently, a seminal work by Law and colleagues assessed changes in perfusion in LGG as a marker of increasing tumor aggressiveness [77]. They demonstrated that among LGG, a CBV of 1.75 was discriminatory for time to progression and adverse outcome (Fig. 10.2). Over a 4-year follow up period, all LGG with CBV under 1.75 had nonsignificant growth. Time to progression (TTP) was 4620 days in these tumors, whereas in LGG with rCBV >1.75, TTP was only 245 days. Importantly the authors did not find an association between contrast enhancement and time to progression. The association between elevated rCBV and diminished TTP in LGG was later confirmed by the authors in a multi-institutional study which included data from University College, London [78]. The London group also published a report specifically designed to test the hypothesis that longitudinal MR perfusion imaging predicts malignant transformation [79]. They found this was indeed the case in a study of patients with conservatively treated LGG that underwent malignant transformation, comparing the “transformers” to “non-transformers:” rCBV was essentially low and stable in non-transformers (around 1.5) but steadily rose to a mean of 5.4 in transformers. Substantial increases in rCBV could be detected up to 12 months prior to the development of contrast enhancement [79].
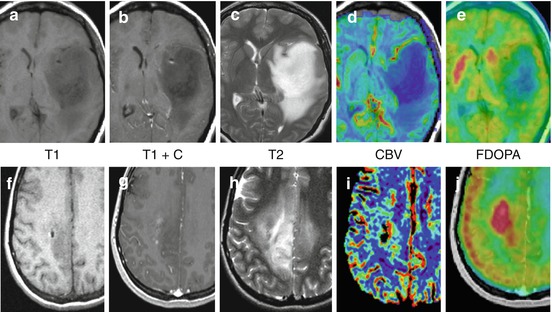

Fig. 10.2
Multiparametric advanced imaging may help refine patient prognosis. (a–e) Grade II Astrocytoma, IDH1+, 1p/19q intact with low rCBV (<1) low FDOPA uptake (tumor: basal ganglia ratio <1) and long (>2 years) PFS survival. (f–j) Grade II Oligodendroglioma, IDH1+, 1p/19 LOH with elevated rCBV (>2), high FDOPA uptake (tumor: basal ganglia >1) and short PFS (<6 mos). Both increased rCBV and increased FDOPA uptake are associated with shorter survival in LGG
The University College London group also analyzed growth rate as a marker of malignant transformation [80], and compared it to rCBV and diffusion parameters [81]. They found that average growth rates were lower in non-transformers compared to transformers and that growth rates increased to a rate of 56% (by volume) per year in the 6 months before transformation. Furthermore, they showed that 6-month tumor growth was a better predictor of patient outcomes that perfusion- or diffusion-derived metrics.
MRS has been used to identify oligodendrogliomas undergoing anaplastic transformation as well. In a sample of 20 oligodendrogliomas followed for 30 months on average, Cho/Cr ratio>2.4 reliably identified anaplastic transformation, but only in patients without, and not with, 1p/19q LOH (Fig. 10.3) [82]. The number of transformers was only 6 in this study (4 without 1p/19q LOH), so caution regarding the conclusions is advisable. However, if replicated, this example is illustrative of how an imaging biomarker can be dependent on a tumor’s molecular status. In a much larger study of recurrent (n = 111, 71 transformers) LGG combining both oligodendrogliomas and astrocytomas, MRS was combined with perfusion and diffusion data to determine if a multiparametric approach could help improve the ability to identify malignant transformation [83]. The best multivariate model incorporated Cr, Cho/NAA, diffusion parameters and the volume of T2 signal abnormality and was accurate in 76% of patients in identifying malignant transformation. Oligodendrogliomas were misclassified at a higher rate (35%) than astrocytomas (17%) or mixed gliomas (20%). It is unclear whether the high rate of mis-classification for oligodendrogliomas was impacted by 1p/19 allele status as previously reported [82].
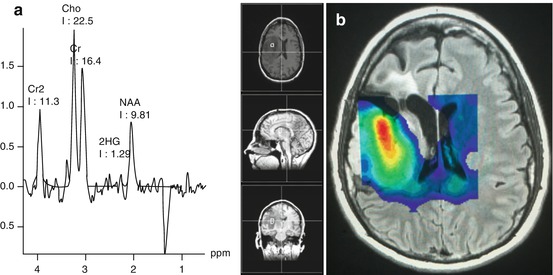

Fig. 10.3
Single and multi-voxel MR spectroscopy of grade II astrocytoma, ID1 mutant, 1p/19q LOH. (a) Single voxel spectroscopy shows 2-HG resonance to the left of an abnormally low NAA peak, compatible with an IDH1 mutant tumor. (b) Multi-voxel spectroscopy with pseudocolor Cho (red = higher concentration) illustrating variable Cho within the tumor with the highest concentration in the central and anterior portion of the mass. In the single voxel spectroscopy (a) the Cho/Cr ratio is <2.4. A Cho/Cr ratio>2.4 has been associated with malignant transformation, but only in 1p/19q intact tumors (Bourdillon 2015 [72]). Cho (choline), Cr, Cr2 (creatine) NAA (N-acetyl-aspartate)
In addition to prognostic markers, markers that indicate treatment response are being sought. Since tumor-size change on standard MRI may take months to develop, early response markers of treatment efficacy could speed clinical decision making. To date few early markers of response for LGG have been developed. One avenue that may be productive is to assess metabolic changes with MR spectroscopy. A pilot study (n = 12) showed that serial changes in choline over 1 year paralleled changes in tumor volume for patients with LGG treated with temozolomide (TMZ) [84]. Decreased Cho/Cr and Cho/NAA ratios could be observed 1 month after treatment initiation with TMZ whereas standard MRI showed little change [85]. Additionally, the mean relative decrease in choline at 3 months was predictive of outcome at 14 months. Perhaps most interestingly, change in the ratios of metabolites including Cho, NAA and Cr was predictive of relapsed tumor with a sensitivity of 60% and a specificity of 100%. Thus early response markers for effective LGG are limited, but could be highly impactful following additional validation.
Stay updated, free articles. Join our Telegram channel

Full access? Get Clinical Tree


