9 Molecular Imaging and PET/CT
Molecular Imaging in Radiation Oncology
Noninvasive biologic imaging has been developed and enhanced for more than a half century since the first medical ultrasonic measurement in 1954,1 the invention of a clinical x-ray computed tomography (CT) scanner in 1972,2 and the acquisition of the first magnetic resonance image (MRI) in 1973.3 These methods have evolved to offer high imaging performance in terms of scanning time, spatial resolution, and image quality, and now are commonplace in medical settings. In general, the source of contrast in these imaging modalities is gross tissue anatomy or structure. For example, x-ray CT differentiates tissues on the basis of their density and x-ray absorption, which vary greatly between bone, air, and water but minimally between different soft tissue types. MRI detects differences in proton density and magnetic relaxation, which can vary substantially between soft tissues. Many of these properties have only tangential relationships to the physiologic or functional aspects of the tissue being imaged, however. A tumor may be difficult to localize on CT because its absorption properties are not significantly different than the tissue from which it arose. This shortcoming of conventional anatomic imaging prompted the development of molecular imaging, loosely defined as the noninvasive detection, localization, and quantitation of specific molecular entities or physiologic processes in a living organism.
Positron Emission Tomography
Basic Physics
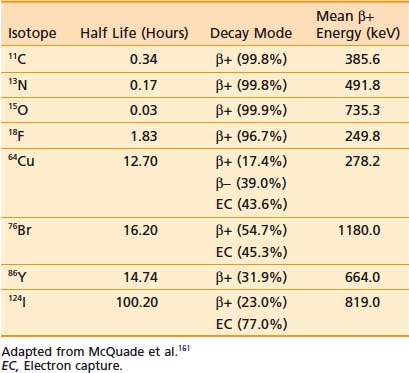
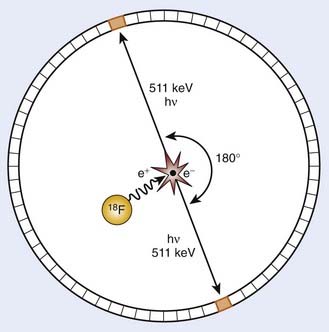
PET is an imaging modality derived from the unique physics of radioactive decay of positron-emitting radionuclides. Such non-natural isotopes, including 11C, 13N, 18F, 64Cu, and 124I (Table 9-1), are unstable and decay through the conversion of a proton within the nucleus into a neutron, a neutrino, and a positron that is subsequently emitted from the atom. This decay process reduces the atomic number of the atom by 1 and ejects the positron from the nucleus. The emitted positron has a mean travel distance, dependent on the medium and its energy, in the range of 1 to 10 mm. After traveling some distance, the positron annihilates with its opposite particle the electron, and their energy is converted into two “annihilation” photons of 511 keV emitted in opposite directions.
To detect and localize such events, PET devices were developed as arrays of detectors that can convert the high-energy photons into optical photons through scintillation crystals, such as bismuth germanate and lutetium oxyorthosilicate, and subsequently into electrical pulses using photomultiplier tubes. Unlike similar devices for single-photon emission computed tomography that must rely on physical collimators to restrict the field of view of each detector to a defined spatial volume, PET scanners operate on the principle of coincidence detection. Because each positron emission event results in two photons traveling at 180 degrees to each other, PET detector arrays are designed to identify pairs of detectors that report events within a short (typically 6-20 nanoseconds) window of each other. These pairs of events are termed coincidence events. A typical PET acquisition involves the measurement of millions of coincidence events from a subject containing a distribution of a positron-emitting compound. This detection strategy is demonstrated in Figure 9-1. The concept of PET scanning was conceived in the late 1950s and early 1960s,4 resulting in the advent of a clinically useful scanning device in the early 1970s.5,6 Modern clinical PET scanners achieve spatial resolutions of 4 to 6 mm, with sensitivities in units of counts per second for a 1 µCi point source at the center of the scanner of 200 to 2000.7
The performance of modern PET scanners is dictated by a number of factors. To conserve momentum in the positron-electron annihilation, the directions of travel of the annihilation photons are not perfectly collinear, with the divergence from collinearity approximately 1 degree or less. This slight noncollinearity between the emitted photons limits the resolution of PET, becoming more severe with increasing detector bore sizes. In addition, thick scintillator crystals are typically used in detectors to increase their photon-stopping ability. However, the thickness of the crystal can cause uncertainties in localizing events, particularly for detector pairs whose joining lines are at oblique angles to the detector face (such as detector pairs on the same side of the circular array). This causes a loss in spatial resolution for regions of the image away from the center of the scanner. Emerging “depth of interaction” detector technology has been developed to estimate where within a crystal an event occurred to mitigate this effect.8,9 Scattered photons detected by the PET scanner as well as random coincidences occurring when photons from two separate positron events are recorded as a coincidence affect both the quantitative ability of PET as well as the spatial characteristics of resulting images. Strategies for random coincidence corrections and scatter rejection have been developed to combat these phenomena, and are discussed in the Image Reconstruction and Analysis section.
A recent achievement in PET scanner design has been the realization of time-of-flight (TOF) PET systems. From the inception of PET, engineers have striven to construct detectors with temporal responses fast enough to not only identify coincidence photons measured on separate detectors, but also to quantify the time lag between the arrival of each of the coincidence photons. This time can then be used to calculate where along the line connecting the two detectors the positron event occurred, increasing the quality of reconstructed PET images. One vendor now has a TOF PET-CT system available, the performance of which has been favorably compared with conventional PET scanners.10 In addition, combination of PET imaging technology with respiratory monitoring devices has resulted in the acquisition of motion-resolved, four-dimensional (4-D) PET data sets using methods analogous to 4-D CT.11,12
Integration With Computed Tomography
The principal advantage of PET/CT is the ability to interpret the PET images in the context of the anatomic reference provided by a high-spatial-resolution CT data set. This has been shown clinically to enhance the diagnostic interpretation of these data beyond that possible through consideration of the PET or CT in isolation.13 However, the integration of PET and CT has yielded other benefits as well. A key technical improvement afforded by PET/CT is the ability to correct the PET data for photon absorption within the subject, using the CT image to estimate the anticipated photon attenuation along the line joining each detector pair. Whereas attenuation correction was previously performed in standalone PET scanners using transmission images acquired with the PET detectors using a rotating rod source, the high signal-to-noise ratio and spatial resolution of CT images has significantly enhanced the performance of this correction. Furthermore, the development of hybrid PET/CT scanners has accelerated the inclusion of PET data in radiation treatment planning because it is possible using these devices to acquire coregistered PET data at the time of CT simulation.
Image Reconstruction and Analysis
The traditional method of reconstruction for PET data has been the filtered backprojection technique, analogous to that used in x-ray CT. This method involves filtering the projection data using a ramp filter in the frequency domain, and uniformly distributing each filtered projection along the projection direction. This “backprojection,” when applied to a complete tomographic data set, then gives a reconstructed image. The sensitivity of this algorithm to high-frequency noise necessitates further filtering at the cost of spatial resolution. More computationally expensive iterative reconstruction techniques have evolved to address the shortcomings of analytic backprojection methods. In general, these methods operate through successive adjustments of the reconstructed parameter distribution, which is then subjected to a forward projection operator producing the corresponding expected measured data set that can be compared directly with the experimentally measured data. This strategy allows modeling of the acquisition process and can account for attenuation, scatter, noise, and other experimental factors. Examples of reconstruction methods of this type now in commercial use include maximum-likelihood expectation maximization,14 ordered-subset expectation maximization,15 and row-action maximization-likelihood16 algorithms. Following reconstruction of the data into spatial images, a system calibration factor determined from quality assurance procedures is then applied to convert the images from units of counts per second into units of activity per unit volume (µCi/mL).
Positron Emission Tomography Radiotracers
The prevalent radiotracer in use in PET imaging is 2-deoxy-2-18F-FDG. FDG is an analog of glucose in which the hydroxy group typically found in the second position of the six-member ring has been replaced with 18F.17 Originally developed as an anticancer agent, 2-deoxyglucose (2DG) was designed to be cytotoxic to tumor cells that depend on glycolysis for energy production.18 This compound is taken up into cells by glucose transporters, and undergoes phosphorylation by hexokinase in the first step of glycolysis. However, because of the absence of the 2-hydroxyl group, the molecule cannot be further metabolized, and because at this stage the molecule has been phosphorylated and acquired a charge, it cannot easily cross the cell membrane and be cleared. This “trapping” of FDG within glycolytically active cells therefore generates a PET signal that can be imaged. Although 2DG as a cancer therapeutic has suffered largely because of the large doses required to out-compete endogenous glucose and the normal tissue toxicities thereby incurred, FDG has proven successful as a PET radiotracer because the trace doses administered avoid toxicity and because the uptake of this compound by tumors can be as much as 20 times that of surrounding normal tissue. A typical clinical dose for human imaging is up to 15 mCi of FDG at a specific activity of greater than 200 mCi/µmol, corresponding to a maximum mass dose of FDG of 75 nmol.
Although FDG PET now has proven clinical applications in a variety of oncologic sites, it has several shortcomings. Observation of elevated FDG uptake on a PET scan of a cancer patient could be associated with (1) increased tumor mass or cellularity, (2) upregulation of glucose transporters, (3) upregulation of hexokinase, (4) inflammatory responses, or (5) muscle activity. Therefore, although FDG PET can provide valuable clinical information, there have been subsequent efforts to develop more specific PET radiotracers that can report on specific aspects of an individual patient’s cancer and more fully characterize it so as to select and monitor the most effective course of treatment. 18F-fluorothymidine (FLT) is a thymidine analog that is taken up into cells and phosphorylated by thymidine kinases, resulting in a trapping similar to that of FDG.19 Although FLT is not incorporated into deoxyribonucleic acid, the association of thymidine kinase activity with S-phase cells suggests that FLT uptake gives a measure of cellular proliferation. FLT PET images acquired from human lung tumors have been correlated with proliferation measured using Ki-67 immunohistochemistry.20
An area of PET tracer development with great relevance to radiation oncology is that of agents targeting hypoxic cells. A number of compounds employing the “cellular trapping” localization scheme have been synthesized and evaluated for their ability to accumulate in cells lacking oxygen. A number of these are based on 2-nitroimidazole–containing groups, which are reduced by cellular reductase enzymes to reactive species that bind covalently to intracellular macromolecules and are thus trapped. These reduction reactions can be reversed by molecular oxygen, resulting in radiotracer trapping occurring primarily in hypoxic cells.21 Radiotracers of this type that have been evaluated in the clinic include 18F-fluoromisonidazole,22 18F-fluoroazomycin arabinoside,23,24 and 2-(2-nitro-1H-imidazol-1-yl)-N-(2,2,3,3,3-pentafluoropropyl)-actamide (18F-EF5).25,26 64Cu-Diacetyl-bis (N4-methylthiosemicarbazone) (64Cu-ATSM) is another hypoxia-selective PET radiotracer, employing a longer-lived 64Cu radionuclide label, which employs bioreductive pathways causing the molecule to become charged to induce intracellular trapping.27,28
In addition to radiotracers that become trapped within cells, a second class of PET agents are those that bind to specific proteins expressed on the surface of cells. Radiotracers of this type are common in neurologic studies of neuronal receptors; however, this localization method has frequently been applied to oncologic imaging as well. An emerging radiotracer of this type is arginine-glycine-aspartic acid peptides labeled with 18F or 64Cu. These compounds have been shown to bind to αςβ3 integrins expressed on endothelial cells of angiogenic vessels, allowing imaging of the molecular aspects of angiogenesis using PET.29,30 In addition to small molecule probes, labeled antibodies against a variety of targets have been developed as PET radiotracers,31 providing a mechanism for translating antibodies developed for molecular biology applications into imaging agents. A key design constraint for receptor-binding PET radiotracers is that they must have high specific activity so as to avoid competition for binding sites between labeled (detectable) and unlabeled (undetectable) probe molecules within the radiotracer formulation.
A final class of PET radiotracers deserving mention are those that are used to measure vascular perfusion, such as 13N-NH3 and 15O-H2O. The short half-lives of these compounds as well as their biodistributions limit their use in PET experiments to short time frames after injection. Commonly, dynamic images are acquired rapidly after injection and fit to compartmental models to extract estimates of vascular volume or perfusion from the measured time-activity data.32–34
Magnetic Resonance Spectroscopy
Basic Physics
 ) in water in biologic tissues to encode spatial information and create an image, MRS exploits the latter property given previously to differentiate protons or other nuclei with quantum spin based on their molecular association. This technique forms the basis of the use of NMR techniques for the identification and measurement of chemical structure. Although MRS can be used to study any nuclei possessing quantum spin, including 1H, 19F, and 31P, the proton (1H) has the highest intrinsic sensitivity for nuclear measurement and has been studied in the most detail in vivo, and is the subject of this discussion.
Magnetic resonance pulse sequences used for the acquisition of spectroscopic data began with the simplest “pulse and measure” technique in which a 90-degree excitation pulse is applied to a sample under a strong static magnetic field, and the resulting free induction decay signal is recorded using an inductive coil. More sophisticated spin echo sequences employing a subsequent 180-degree refocusing pulse35 were developed to avoid signal losses caused by field inhomogeneities and other static disturbances characterized by the relaxation rate T2*. To apply MRS to living subjects, a number of further technical issues must be resolved. Although it is feasible to obtain a homogeneous sample of a chemical for NMR analysis, for in vivo subjects, a mechanism of restricting the imaging volume is required. In the most straightforward sense, this can be achieved by using acquisition hardware with a limited sensitive volume. Surface coils have been applied in this regard as their transmission and reception sensitivity is very high near the coil aperture but falls off quickly.36 More flexible methods have been developed to select volumes for spectroscopic measurement through software rather than hardware. This can be done in a manner identical to that done for slice selection in MRI, through the marriage of excitation pulses with a well-defined bandwidth and linear magnetic field gradients applied along a specific spatial dimension. Biologic spectroscopy acquisitions can apply three sequential selective excitations to excite orthogonal planes of spins, resulting in the final selection of a rectangular volume of interest. This technique can be implemented using either three 90-degree pulses, termed stimulated echo acquisition mode (STEAM),37 or by one 90-degree and two refocusing 180-degree pulses, termed point resolved spectroscopy (PRESS).38 PRESS is unable to achieve the short echo times (TEs) of STEAM because it uses multiple refocusing pulses, but it has the advantage of being a true spin echo technique and therefore insensitive to T2* signal losses.
In addition to the problem of suppressing signals from spins outside the volume of interest, in vivo MRS also faces the difficulty of removing signals from spins present in compounds other than those of biochemical interest. The largest of these is water, which is present in biologic tissues in molar concentrations and is several orders of magnitude more abundant than the metabolites of interest. Such an overwhelming signal can dominate the dynamic range of an MR system and prevent accurate quantitation of other less intense spin resonances. Strategies for suppressing the water signal from spectroscopic acquisitions focus on either destroying the coherent magnetization produced by water protons or on excluding the resonance frequency of water protons from the bandwidth of the excitation pulse. The former technique has been achieved through use of chemical shift selective saturation (CHESS) pulses, which consist of a 90-degree excitation pulse, specific to the resonance frequency of water protons, followed by a strong dephasing gradient pulse.39 CHESS methods can be expanded to other potentially unwanted resonances such as lipid by modification of the pulse bandwidth or inclusion of additional CHESS pulses prior to measurement. The alternate approach, that of excluding the unwanted resonances from the bandwidth of the excitation pulses, can be achieved using frequency-selective techniques analogous to those described for STEAM and PRESS. However, the difficulty of simultaneously selecting both a restricted spatial volume (in conjunction with magnetic field gradients) and a restricted spectral range using a single pulse is apparent. This problem has been solved through the development of spectral-spatial selective pulses that incorporate complex varying gradient and pulse waveforms.40
Although single-voxel spectroscopic acquisitions remain useful for a variety of diagnostic purposes, application of MRS in radiation oncology has been contingent on the development of methods for imaging spectroscopic signals. This goal is complicated by the dependence of spin resonance frequency and hence chemical shift information on the applied magnetic field, which prevents the use of frequency-encoding readout gradients like those used in MRI. The simplest solution to this problem is to apply a series of phase-encoding gradients along the spatial axes prior to the acquisition of an echo, and to step the intensities of these gradients so as to map out frequency space, or “k space,” to the desired extent and resolution. This procedure, termed chemical shift imaging (CSI) or magnetic resonance spectroscopic imaging (MRSI), has been applied to acquire MR spectra from two- and three-dimensional (3-D) grids of voxels. The time required for such acquisitions is given by the number of acquired voxels multiplied by the repetition time of the sequence. Faster spectroscopic imaging solutions have been pursued by applying time-varying gradients during readout and deconvolving the contribution of these gradients from the measured spectroscopic information during reconstruction,41 in an approach similar to that of echo-planar MRI. This technique, termed fast or spiral CSI, can reduce the acquisition time required for spectroscopic imaging at the expense of more pronounced susceptibility and aliasing artifacts also encountered with echo-planar MRI.
Image Reconstruction and Analysis
The raw data obtained from a spectroscopic acquisition must first be processed, corrected, and reconstructed. Spectroscopic imaging data must first be Fourier transformed along each phase encoding direction to separate the data into spatial voxels. Because of the nature of the frequency domain acquisition of MRSI data, the relatively coarse voxels can be retrospectively positioned and reconstructed within the excitation volume by multiplying the acquired data array by a complex exponential. This data is then Fourier transformed to generate a frequency spectrum, which is then subjected to a variety of corrections for spectral frequency and baseline and peak phase.42 When this reconstruction and correction procedure has been completed, the peaks of interest within the acquired spectra may then be identified and peak parameters (height, area, width) calculated.
A general difficulty in interpreting MRS relative to other molecular imaging modalities is that the measured data includes both spatial dimensions as well as a spectral, frequency dimension. A variety of classification techniques have been reported for discriminating normal from neoplastic tissues on the basis of spectroscopic information.43–49 Of these, the work of McKnight and colleagues is particularly relevant to radiation oncology because it condenses the data contained in a spectrum into a single metric, or alternately translates a 4-D MRSI data set into a 3-D volume image more immediately familiar to modern radiologists and clinicians. This is accomplished for brain MRSI data by performing a regression analysis using the choline and N-acetyl aspartate (NAA) levels calculated for all voxels in an MRSI data set, and classifying each spectrum based on the distance its choline and NAA levels lie from the regression line calculated for an automatically selected population of “normal” spectra. This distance is called the z score or abnormality index, and serves as a measure of the deviation between a voxel’s spectrum and that of normal tissue.
Site Restrictions
Several phenomena limit the application of MRSI methods to several well-suited anatomic sites. First, the tissue of interest must contain a metabolic or molecular signature that makes it worthwhile to investigate with spectroscopy. To be detected by in vivo MRS, a metabolite must be present in appreciable concentrations to produce a detectable signal. In general, this requirement necessitates millimolar concentrations for the spin groups of interest.50,51 Furthermore, the transverse relaxation time (T2) of the spin population must be sufficiently long relative to the TE used in the acquisition sequence to avoid complete relaxation of the magnetization before signal measurement. This precludes detection of macromolecules or compounds that are tethered to large complexes, such as membrane-associated molecules. Finally, the peaks of interest must be adequately removed from other peaks present in the spectrum so that they can be independently resolved and quantified. In addition, the macroscopic structure of the tissue must be amenable to the acquisition of high-quality spectroscopic data. This mandates that it be of relatively homogeneous magnetic susceptibility. In addition, because of the relatively long duration of MRS acquisitions, the tissue should not be subject to excessive motion.
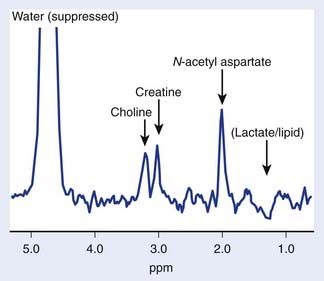
The brain is particularly suited for interrogation with 1H MRS techniques. It is a relatively static organ and is largely free of air–tissue interfaces that can introduce difficulties in producing a constant magnetic field across it. A long TE spin echo acquisition sequence can detect five basic types of metabolites in the brain: choline-containing compounds, creatine, NAA, lactate, and mobile lipids, as shown in Figure 9-2. Choline levels in glioma are generally increased relative to normal cerebrum52–59 reflecting altered membrane phospholipid metabolism54,59,60 or increased cellularity in neoplastic tissue.54,59–61 High-grade (World Health Organization grade 4) gliomas do not show the same magnitude of choline elevation as lower grade gliomas; this is thought to be related to the micronecrotic nature of these lesions.54 The appearance of the MRS creatine peak in brain neoplasms appears to be inversely correlated to tumor grade, with grade 4 lesions demonstrating the most reduced creatine levels relative to normal tissue.60 NAA has been shown to be localized in neuronal cells,62–64 allowing its use as an MRS marker of viable neurons. Dramatic reductions in the MRS NAA signal are observed in studies of gliomas, which are indicative of the death of neurons as they are encroached upon by the invading neoplasm, or the displacement of neuronal tissue by tumor-related mass effects.52–59 The ability to simultaneously observe both a tumor-associated resonance (choline) as well as a marker associated with normal tissue (NAA) enhances the diagnostic ability of MRS. Lactate and lipid protons both resonate in the 1.0 to 1.5 ppm range. Lactate, the end product of anaerobic glycolysis, has a controversial status in clinical brain MRS; some have associated its presence with poor clinical outcome indicative of tumor hypoxia,60 whereas others have noted that lactate accumulation is nonspecific and can be either an intrinsic property of the tumor or an effect of treatment-induced ischemia.54 Lipid signals in brain MRS can either come from spectral contamination from subcutaneous fatty tissues included in the MRS volume, or from micronecrosis and cellular breakdown present in high-grade or post-treatment lesions.56,65 Lipid resonances may be an indicator of membrane breakdown and necrosis, potentially reflective of the necrotic nature of glioblastoma multiforme. Increasing magnetic field strength and decreasing echo times and spatial resolutions have facilitated the detection of an increased number of metabolites from brain tissue, including glutamine, glutamate, taurine, inositol, and aspartate.66
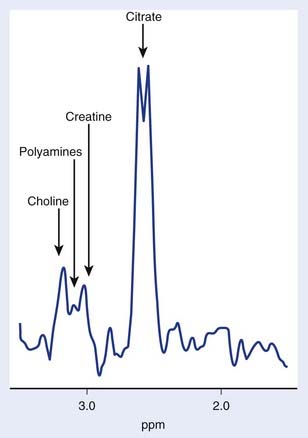
The use of transmission and reception coils inserted into the rectum has allowed the acquisition of high signal-to-noise ratio MRI and MRS data from the prostate. Long-echo MRS studies of the prostate allow quantitation of choline, creatine, and citrate as demonstrated in Figure 9-3. As in brain MRS, choline is a marker of altered neoplastic membrane metabolism, and the MRS peak it generates can similarly be used as a biomarker of cancer.67 A peak containing contributions from polyamine compounds including spermine and spermidine is found at 3.1 ppm, but its detection can be complicated by broad line widths and by its proximity to the choline and creatine peaks, especially at 1.5 T. Decreased polyamine levels have been associated with malignant prostate cancer.68 However, the principal marker of normal prostate metabolism in spectroscopic measurements is citrate, present in the MR spectrum as a quartet centered at 2.6 ppm. Citrate is produced, accumulated, and secreted by normal epithelial cells within the gland. During the process of malignant transformation, prostatic cells become dedifferentiated and correspondingly lose their capacity for citrate production and secretion. This results in levels of MRS-visible citrate being reduced in neoplastic tissue relative to normal tissue.
Several groups have attempted to study breast cancer using spectroscopic methods. The problems of water and lipid suppression are exacerbated when measuring within the breast; however, improved techniques have proven adequate for the robust detection of relative choline levels across the breast.69 However, in breast spectroscopy there is no easily detectable normal marker to play the role that NAA does in brain MRS and citrate does in prostate MRS.


