Fig. 1.1
Structure of elements comprising the eukaryote protein coding (mRNA) gene. Modified from [40]. Used under creative commons attribution license
DNA Encoding Messenger RNA, Enhancers, and snRNA
The eukaryotic protein encoding gene consists of a promoter region located 5′ to the portion of the DNA that codes for protein followed by the nucleotides coding for the amino acids that make up the protein and finally by a noncoding extension of the mRNA (termination segment) that contains a consensus sequence AATAAA which marks the site in the RNA transcript where the mRNA is cleaved and a tail of adenine nucleotides is added (poly A site—Fig. 1.1) [36, 41]. Most promoters contain a consensus sequence TATTAA (TATA box) located 25–35 bases and another consensus sequence G/C G/C G/C GCCC at 32–38 bases upstream of the initiation site. A series of multimeric proteins called transcription factors facilitate the binding of RNA polymerase II to the promoter sequence. These are referred to as TF (transcription factor) II (for polymerase II) and “A”, “B”, … The first site binds a transcription factor TFIID (TBP) and the second TFIIB (GTF2B). These factors in turn recruit additional transcription factors TFIIA (GTF2A1/2), TFIIF (GTF2F2P1), and TFIIE (GTF2E1/2), and together these transcription factors recruit RNA polymerase II to form the transcription initiation complex which begins the creation of mRNA at the transcription initiation start site [36, 41]. Basal rates of transcription are generally very low unless other transcription factors are present binding to enhancers.
An enhancer is operationally defined as a portion of DNA that can activate transcription of a target promoter in an orientation and location independent manner [42]. Enhancers frequently map to within 2.5 Kbp of the promoter but may be located upto 1 Mbp or more distant [43–45] although they are generally on the same chromosome [46]. Binding between transcription factor and enhancer sequence is highly DNA sequence specific [47, 48]. Enhancer and promoter elements are brought into proximity through a looping process [47–49] as well as by relocation of the active gene from the periphery of the nucleus to its interior [50]. Enhancers are generally identified experimentally in their active state by displaying an “open” configuration which makes them highly sensitive to partial degradation by DNase I treatment (DNase I hypersensitive sites; DHS) and by the presence of certain posttranslational modifications to the histone proteins that combine with DNA in the nucleus to make chromatin at enhancer sites (described subsequently below). Between 400,000 and 8.4 million enhancers have been identified in the human genome [51, 52] and similar numbers have been mapped for other species [53, 54]. This is truly quite remarkable when one remembers that the entire human genome only contains approximately 20,000 protein coding genes [1] and that less than 10 % of these or approximately 1,300–1,400 have been identified as potential transcription factors [55]. Differences in patterns of activation of enhancer elements drive the gene expression patterns that are responsible for cellular differentiation and developmental identity [52–54, 56, 57] and individual promoters can interact with multiple enhancer elements [44, 45]. Additional DNA elements that together with their specific binding proteins can affect transcriptional activity include silencers which repress gene expression, insulators which isolate enhancers from nearby genes, and promoter–tethering elements which facilitate the interaction between enhancers and target core promoters [39, 58].
The transcribed portion of a protein encoding gene consists of multiple segments called exons and introns. Exons comprise the parts of the gene that will become the final mRNA molecule that is translated into protein with the intervening segments (introns) being excised or spliced out of the primary RNA transcript (pre-mRNA) [59]. Splice sites are found at the 5′ and 3′ ends of introns and the RNA sequence that is removed begins with the dinucleotide GU at its 5′ end, and ends with AG at its 3′ end. Another important sequence occurs at what is called the branch point, located anywhere from 18 to 40 nucleotides upstream from the 3′ end of an intron. The branch point always contains an adenine, but it is otherwise loosely conserved [38, 60, 61]. Splicing occurs within the nucleus in several steps and is catalyzed by large (60S) ribonuclioproteins particles called spliceosomes composed of smaller ribonucleoproteins (snRNPs) and other proteins called splicing factors [59]. The RNA molecules (snRNAs) which are part of these smaller snRNPs represent another form of noncoding RNA. They are transcribed from single exons by Polymerase II except for the one named U6 which is transcribed by Polymerase III [62, 63]. 92–94 % of genes with three or more exons are known to undergo alternative splicing and for 85 % the frequency of the minor component(s) or isoforms is at least 15 % [64–66]. Alternative splicing is regulated through the binding of RNA binding proteins expressed at variable levels between tissues that bind to enhancer and silencer elements with or surrounding alternatively splice exons [66, 67].
Along with splicing to remove introns, the 5′ and 3′ ends of the mRNA are also modified [59]. At the 5′end of the pre-mRNA molecule, GTP reacts with the triphosphate group on the 5′ carbon of the ribose of the first nucleotide of the pre-mRNA to form a 5′–5′ triphosphate linkage. The N-7 nitrogen of guanine is then methylated to complete formation of the 5′ cap of the mRNA. At the 3′ end of the pre-mRNA molecule the transcript is cleaved by an endonuclease that recognizes the sequence AAUAAA and poly(A) polymerase adds about 250 adenylate residues to the transcript. The now mature mRNA is then translocated to the cytoplasm to be transcribed into protein.
Ribosomal RNA and snoRNA Genes
Ribosomal genes for 18S, 5.8S, and 28S rRNAs are organized as clusters of tandem repeats of approximately 43 kb with an intergenic spacer (IGS) segment of approximately 30 kb and a single transcribed region of 13 kb. The latter codes for a transcript of 47S that contains 5′–3′ the 18S rRNA, 5.8S rRNA, and 28S rRNA molecules [63, 68, 69]. The clusters of rDNA are located on the five acrocentric chromosomes 13, 14, 15, 21, and 22 [69, 70] in a region of the respective chromosomes known as nucleolar organizing regions [71–73]. Clusters can contain from 1 to 140 repeats [69]. 400–600 copies of the 43 kb ribosomal gene repeat are present of which approximately half are active at any one time [69, 74]. Polymerase I is recruited to the promoter by an upstream binding transcription factor, RNA polymerase I (UBTF also known as UBF) and a multimeric selectivity factor (SF1) consisting of transcription associated factors (TAFs) comprised of TATA box binding protein (TBP) and other associated factors TAFI110 (TAF1C), TAFI63 (TAF1B), and TAFI48 (TAF1A) [68, 74]. The genes for 5S rRNA consist of a cluster of repeated 2.2 kb genes located on chromosome 1q42 [75, 76] with a recent study demonstrating a range of 35–175 repeats with an average of 98 repeats per haploid genome [69]. 5S rRNA is transcribed by Polymerase III [63] outside of the nucleolus and is transported into the nucleolus after complexing with ribosomal L5 protein [77]. Both 5S and 18-28S gene clusters are highly variable between individuals and are subject to meiotic rearrangement at a frequency of >10 % per cluster per meiosis [69].
snoRNAs are a group of 60–300 nucleotide long noncoding RNAs which function mostly for rRNA maturation. snoRNAs associate with proteins, forming snoRNPs and hybridize transiently to pre-rRNA molecules to identify positions for cleavage in pre-rRNA and specific sites of 2′-O-methylation and pseudouridine formation [78–80]. One of the cleavages by which transcribed spacer sequences are removed from pre-rRNA is catalyzed by a snoRNP called RNase MRP. Its snoRNA is homologous to the RNA of RNase P involved in tRNA processing (see below) and based on this homology, the cleavage reaction is thought to be catalyzed by the MRP snoRNA molecule [80], The two main classes of snoRNAs are C/D snoRNAs and H/ACA snoRNAs. The former contain two sequence motifs RUGAUGA (Box C) and CUGA (Box D) while the latter contain AnAnnA (Box H) and ACA motifs [81]. 44 of the 456 snoRNA genes identified in humans possess independent polymerase II promoters while the remaining genes are located in introns of genes coding for proteins involved in nucleolar function, ribosomal structure, or protein synthesis [79]. This suggests the possibility of coordinately regulated expression of snoRNAs and ribosome biogenesis but this has yet to be clearly demonstrated [79].
Transfer RNA Genes
Transfer RNAs (tRNAs) represent the adapter molecules that enable the genetic code of triplets to be translated into a protein molecule’s linear sequence of amino acids [82]. The initial map of the human genome identified 497 transfer RNA (tRNA) active genes grouped into 49 families based on their anticodon features dispersed throughout the human genome with the majority clustering in small regions on chromosome 6 and 1 and the remaining found on all of the remaining chromosomes except 22 and Y [1]. tRNA genes are transcribed by RNA polymerase III and have a somewhat unusual promoter consisting of two sequences termed A-box, and B-box located down stream of the first transcribed nucleotide (+1; transcription start site or TSS) within the transcribed 5’ end of the tRNA gene [63]. TSS is most frequently located between 12 and 20 bp upstream of the “T” marking the beginning of the A box [34]. As with Polymerase I and II, Polymerase III must be recruited to the promoter of the tRNA gene through interaction with several multimeric transcription associated factors. In this case the first step is the binding of one called TFIIIC (GTF3C1) to the A and B boxes which then recruits a multiprotein factor TFIIIB (BDP1) to an approximately 50 bp site upstream of the TSS. Polymerase III is then recruited and transcribes the tRNA gene until it encounters a sequence of four Ts which cause termination of transcription [34]. Both the 5′ end and 3′ end of the primary transcript are cleaved, the removal at the 5′ end being performed by a riboprotein termed RNase P in which the RNA portion has catalytic activity [35]. A minority of tRNA transcripts contain an intron which must be spliced out. The splicing reaction involves a different biochemistry than the spliceosomal and self-splicing pathways [80]. Ribonucleases cleave the RNA and ligases join the exons together [33, 83]. tRNA molecules undergo many post-transcriptional modifications [33] the most crucial of which is the addition of the nucleotides CCA to the 3′ end [84, 85].
Processed tRNAs are typically 70–80 nucleotides in length and possess a secondary structure usually visualized as a cloverleaf structure with 4 “stems” three of which are closed at their distal ends by loops while the fourth “stem” contains the 5′ and 3′ ends of the tRNA molecule [82]. The anticodon used to match the amino acid attached to the tRNA’s 3′ end with the corresponding proper triplet on mRNA is present in the middle loop of the molecule [82]. The tRNA molecule folds into a tertiary “L”-shaped structure with the anticodon located at the end of the “long” part of the “L” and the CCA (3′ end) located at the end of the “short” part of the “L” [82, 86] (see Fig. 1.2). In order for tRNA to carry out its function it must be correctly paired to its amino acid. The attachment of the appropriate amino acid to a tRNA is carried out by a specific aminoacyl-tRNA synthetase. Each of 20 different synthetases recognize one amino acid and all its compatible tRNAs. The amino acid is attached to either the hydroxyl group of carbon 2 or 3 of the ribose part of the terminal adenine on the 3′ end of the tRNA (ribose of the “A” of the 3′ terminal “-CCA”). Class I synthetases attach the amino acid to the 2′ hydroxyl of the terminal adenylate in tRNA while class II synthetases attach the amino acid to the 3′ hydroxyl [82].
Fig. 1.2
Initiation of Translation—large and small ribosomal subunits bind to mRNA at codon AUG (for explanation of E, P, A regions see text)
The function of tRNAs as adapters for translation of amino acids into proteins is well understood but recent studies have identified fragments of tRNAs as potentially important in gene regulation in a variety of physiologic and disease states including cancer [87, 88]. Space does not permit discussion of this topic but one mechanism for some of the actions is by working as small interfering RNAs [87] which is discussed later in this chapter.
Protein Synthesis
The Nucleolus and Ribosome Biogenesis
Morphologically, the nucleolus is a membraneless organelle within the nucleus in which actively transcribed rRNA genes are located and where maturation/processing of rRNAs, and assembly of rRNAs with ribosomal proteins takes place [71, 89]. The nucleous forms at the end of mitosis. Nucleolar organizing regions (NORs) appear as secondary constrictions on metaphase chromosomes, contain relatively undercondensed chromatin [90] and have been shown to take part in nucleolus formation in interphase nuclei [91, 92]. In humans each of the acrocentric chromosomes (numbers 13, 14, 15, 21, and 22) can have a secondary constriction in the short arm, can take part in nucleolus formation [91, 92] and, as previously noted, each has been shown to be the site of rRNA genes in humans [69, 70, 92]. Thus, currently the term NOR is used to refer to the chromosomal locations in which ribosomal genes are found [92, 93]. Not all NORs are associated with active ribosomal gene transcription. However, nucleolar formation does appear to be dependent on resumption of rRNA synthesis and processing after mitosis in order for formation [94]. If a NOR’s rRNA genes are actively transcribing rRNA during interphase then the NOR on the metaphase chromosome can be stained with silver stain [92, 95] because during mitosis, transcription factor UBTF, promoter selectivity factor SL1 (TAF1A), and polymerase I associate with those rRNA genes [93]. McStay and colleagues created multiple human HT1080 cell lines stably transfected with a plasmid (XEn) containing an array of 80 repeats of a 60/81-bp enhancer sequence from intergenic Xenopus rDNA which also binds human UBTF. These XEn transfected lines demonstrated secondary constrictions and silver staining at the chromosomal locations of plasmid integration and recruited UBTF and also subunits of polymerase I and SL1 (TAF1A) the latter presumably secondary to interaction of the latter two with UBTF [96]. These pseudo NORs did not, however, lead to formation of nucleoli or result in synthesis of rRNA. Recently, the same investigators stably transfected a construct consisting of the XEn sequence combined with a human rRNA promoter and a mouse rDNA gene into HT1080 cells resulting in the formation of a fully functional ectopic nucleolus [73]. The chromatin of NORs from separate chromosomes and the ectopic NOR occupy separate territories within the nucleolus. The study supports a model for nucleolar biogenesis in which the binding of UBTF to enhancer regions of the rDNA genes serves to “bookmark” these locations during mitosis leading to function-dependent assembly of nucleoli at the completion of mitosis [73].
Ultrastructurally, the nucleolus consists of three zones surrounded by a shell of heterochromatin. The central zone is referred to as the fibrillary center (FC) and represents the location of paused rRNA genes or rRNA genes undergoing transcription. rRNA processing mainly occurs in the next region, the dense fibrillary component (DFC). In the next region, the granular component (GC) is the place where the early steps of ribosome assembly occur [71, 89]. When assembly of ribosomal subunits in the nucleolus is complete, they are transported through nuclear pore complexes to the cytoplasm, where they appear first as free subunits [80].
Translation of Messenger RNA (mRNA)
As noted in the earlier discussion of the Central Dogma, the nucleotide sequence of a protein encoding gene is copied into the nucleotide sequence of its transcript mRNA which is then used to direct the synthesis of a sequence of amino acids to form a protein. Each amino acid is identified by a triplet of nucleotides (codon; see Table 1.1). With only a few exceptions this code is used by all living organisms. All amino acids except methionine (Met) and tryptophan (Trp) are encoded by more than one codon [82]. Since 3 of the codons, UAG, UGA, and UAA are used to indicate the end of the protein translation (termination codons), the cellular protein translation mechanism must be able to discriminate amongst the remaining 61 codons. Humans appear to have only 47 separate families of tRNA genes [1] so another mechanism must be available in order for protein synthesis to be carried out. This can be achieved by enabling a single tRNA to base pair with codons where the Watson/Crick base pairing rules C → G and A → U have been “relaxed” for the third base pair in the codon (first base pair of the anticodon). The first base of an anticodon determines whether a particular tRNA molecule reads one, two, or three kinds of codons. If the first base of the anticodon is a C (cytosine) or A (adenine) it will only base pair with a codon whose third base is G (guanine) or U (uracil “U” for RNA or thymine “T” for DNA) respectively. If the first base of the anticodon is U or G then the U can base pair with either purine A or G and if G is in the first position of the anticodon it can base pair with either pyrimidine C or U. Figure 1.2 shows the codon UUU for phenylalanine base pairing with anticodon GAA since humans do not have a tRNA with the anticodon AAA [1]. Some tRNAs will have inosine in the first position of the anticodon and in this case inosine is able to base pair with either C, A, or U. This imprecision is referred to as “wobble”.
First position (5′ end) | Second position | Third position (3′ end) | |||
|---|---|---|---|---|---|
U | U | C | A | G | |
Phe | Ser | Tyr | Cys | U | |
Phe | Ser | Tyr | Cys | C | |
Leu | Ser | Stop | Stop | A | |
Leu | Ser | Stop | Tryp | G | |
C | Leu | Pro | His | Arg | U |
Leu | Pro | His | Arg | C | |
Leu | Pro | Gln | Arg | A | |
Leu | Pro | Gln | Arg | G | |
A | Ile | Thr | Asn | Ser | U |
Ile | Thr | Asn | Ser | C | |
Ile | Thr | Lys | Arg | A | |
Met | Thr | Lys | Arg | G | |
G | Val | Ala | Asp | Gly | U |
Val | Ala | Asp | Gly | C | |
Val | Ala | Glu | Gly | A | |
Val | Ala | Glu | Gly | G | |
Protein synthesis begins in eukaryotes with the attachment of a 40S ribosomal subunit to the cap at the 5′ end of eukaryotic mRNA. The 40S ribosomal subunit, carrying a special initiator Met-tRNA (Met-tRNAi), eukaryotic initiation factor 2 with bound GTP (eIF2 · GTP), then begins to scan through the 5′ UTR until it encounters the first AUG [97–99]. A 60S ribosomal subunit then joins the paused 40S subunit and selection of the start codon is fixed. The 80S ribosome has three adjacent binding sites for tRNA which are in a 5′–3′ direction—an “Exit” or E site, a “Peptide” or P site and an “new amino acid” or A site (see Fig. 1.2). When the 80S ribosome is first formed the Met-tRNAi occupies the P site. The initiator Met-tRNAi is the only tRNA that can bind directly to the P site of the ribosome. The A site is open exposing the next codon in the mRNA. Next elongation factors EF1α (EEF1A1) and EF1βγ complexed with GTP deliver an aminoacyl-tRNA to the A site of the ribosome (in Fig. 1.2 this is Phe-tRNA) which is associated with exchange of GTP for GDP. The amino group of the aminoacyl-tRNA in the A site is now positioned in the peptidyl transferase center of the ribosome adjacent to the ester linkage holding the methionine molecule to the initiator tRNA. The peptidyl transferase center includes rRNA bases that promote breakage of that ester bond with the form an amide bond between the carboxyl group of the methionine and the amino (NH2 −) group on the A site aminoacyl-tRNA. Eukaryotic EF2 mediates GTP-driven translocation of the ribosome causing it to move over one codon on the mRNA in the 5′–3′ direction. At this point the empty-tRNAi is moved into the E site of the ribosome and exits it, the tRNA containing the growing peptide moves into the P site and the A site is then opened to receive a new amino acid so that the process of adding a new amino acid can be repeated . Termination occurs when a stop codon is encountered. A release factor binds to the ribosome in the A site and the peptide is released from the ribosome. Eukaryotic elongation factor 3 (eIF3) prevents the reassociation of ribosomal subunits in the absence of an initiation complex. The result is a new protein synthesized in the amino-to-carboxyl direction [98–101].
Modulation of Translational by Small Noncoding RNAs
While the initial control over the presence and abundance of a cellular protein is through transcription of the gene’s mRNA, the level of translation of the mRNA has been shown to be dependent on a group of small noncoding RNAs through a process referred to as RNA interference (RNAi) [102–104]. The most prominent class of these small noncoding RNA molecules in mammals is known as micro inhibitory RNA (miRNA) and 1,881 annotated human microRNA loci have been identified in humans to date [105]. It is predicted that more than 60 % of protein-coding mRNAs are directly targeted by miRNA [106]. Mammalian cells appear to have very few endogenous genes that can code for another class of these RNAs referred to as small interfering RNAs (siRNAs) [107] although a few examples have been reported in mouse oocytes and embryonic stem cells [108–111]. miRNA genes are interspersed throughout the genome in humans involving all chromosomes with the fewest number (2) found on Y [112]. In animals >30 % occur in clusters which appear to be transcribed as a single unit [113]. 53 % of currently annotated human miRNA genes reside within host protein-coding or ncRNA genes [114]. miRNA genes may be transcribed by either Polymerase II or Polymerase III [115, 116] with current evidence favoring Polymerase II for intragenic genes and either Polymerase II or III for intergenic miRNA genes [117]. Primary miRNA transcripts contain one or more segments with a stem and loop structure (analogous to what can be seen in tRNA) and the endoribonuclease Drosha excises the miRNA double stranded stem loops from the primary transcript producing an approximately 70 nt intermediate (pre-miRNA). This is transported to the cytoplasm where it is further cleaved by RNase III Dicer, a key enzyme in miRNA maturation, to form functional mature miRNAs . The latter are incorporated into a complex of proteins including the AGO subfamily of Argonaute proteins called the RNA-induced silencing complex (RISC). Here one of the RNA strands is degraded leaving a single stranded RNA that can guide the RISC to a specific complementary sequence in the mRNA [104, 107]. The initial view was that RISC always bound to a sequence in the 3′ untranslated region (3′-UTR) of the target mRNA through base pairing with nucleotides 2–7 or 2–8 (the seed region) from the 5′-end of the miRNA and that this always resulted in inhibition of translation [102]. More recently, however, miRNAs have also been shown to increase or decrease expression of protein-coding genes by targeting different regions (3′-UTR, 5′-UTR, and coding sequences) and interacting with proteins [104, 118].
miRNAs appear to be critical in important processes relevant to this volume including DNA repair [119] and regulation of DNA replication [120] and may interact directly with nuclear DNA of promoter regions to influence protein abundance at the level of transcription [121, 122]. Another potentially important interfering small RNA, PIWI-interacting RNAs (piRNA) will be considered below with regard to control of endogenous transposon expression. In addition, miRNAs can be detected in blood and other body fluids of patients with cancer and may be of value in its diagnosis and/or management [123].
The Human Genome and Transcriptome
In 2001 the International Human Genome Sequencing Consortium published its first draft of the human genome sequence [1]. This was followed in 2003 by the start of a project—the Encyclopedia of DNA Elements (ENCODE)—to delineate all of the functional elements encoded in the human genome sequence [124, 125]. A number of reports have been published to date based on ENCODE Project findings [124, 126–128]. The information and implications from this ongoing project are massive and a summary of many of the issues can be reviewed here [2, 3]. Here we will address two topics which are the repetitive elements in the genome and the portion of the genome that is transcribed.
Repetitive Sequence Component Within the Genome
Fifty-five percent or more of the human genome is comprised of repetitive DNA sequences [1, 129]. One category comprising 10 % of genomic DNA consists of simple sequence repeats, segmental duplications, tandem repeats and satellite DNA sequences, and processed pseudogenes [1, 130]. Forty-five percent of genomic DNA consists of transposable elements (TEs) [1]. TEs can be thought of as endogenous parasites within the genome which are designed to replicate and insert copies of themselves elsewhere within the genome [131, 132]. TEs consist of two classes, DNA transposons and retrotransposons. DNA transposons mobilize using an encoded transposase which cuts the TE from its existing genomic location and acts to “paste” it into a new location [131]. DNA transposons are said to be inactive in humans [131]. Retrotransposons (retrotransposable elements; RTEs) mobilize via a reverse transcriptase intermediate. They are classified into Long Terminal Repeat (LTR) RTEs, whose structure and mechanism of mobilization and insertion resembles that of retroviruses, and non-LTR RTEs, which do not contain LTRs and resemble integrated mRNAs [131]. In humans LTR RTEs are not believed to be actively capable of retrotransposition or if so then only rarely [132]. Three classes of non-LTR RTEs that appear to undergo active transposition in humans are long interspersed nuclear elements (LINEs; ~6 kb) specifically the L1 subfamily and two classes of shorter interspersed nuclear elements. The latter are Alu short interspersed nuclear elements (Alu-SINEs; ~300 bp) and elements composed of an Alu-SINE plus a variable number tandem repeat sequence plus a region from the env gene and 3′ LTR of the endogenous retrovirus HERV-K10 (SVA; ~2 kb) [132, 133]. LINEs are transcribed using Polymerase II from an internal promoter that directs transcription at the transcription start site of the L1 RTE [133]. Alu-SINEs are transcribed by Polymerase III. SVAs are probably transcribed by Polymerase II. The process of retrotransposition requires the transcription of an mRNA intermediate and its reverse transcription into cDNA and can cause the disruption of genes by insertional mutagenesis [131, 133]. L1 RTEs are described as autonomous as their genome encodes all of the proteins required for retrotransposition. Alu-SINE and SVA RTEs are nonautonomous and accomplish retrotransposition by coopting L1 proteins [131, 132].
Endogenous retrotransposition is repressed in human cells under normal conditions, predominantly via silencing by promoter DNA methylation [131]. In addition, in model systems a class of small RNAs called PIWI-interacting RNAs (piRNAs) have been shown to be important in suppressing RTEs through a mechanism related to but distinctly different from that for siRNA and miRNA [134]. These small RNAs are slightly larger than siRNA and miRNAs, are generated from single-stranded precursors in a manner independent of RNase III enzymes such as Drosha and Dicer and associate with the PIWI subfamily members of the Argonaute family of proteins to recognize and cleave the transposon RTE RNAs. piRNAs have been shown to be especially important in oogenesis and spermatogenesis in mouse and Drosophila where interference with piRNA expression and/or PIWI Argonaute protein expression leads to high expression of mobile elements and sterility [131]. piRNAs have recently been demonstrated to be expressed in human testis in manner reflective of the pattern of expression seen in the fore mentioned model systems [135].
RTE transcription products have been detected using RT-PCR in human oocytes [136], by cloning from a cDNA library prepared from reverse transcribed RNA of human embryonic stem cells [137] and from several normal human tissues and human cancer cell lines by RT-PCR and northern blot [138, 139]. Approximately 80–100 human L1 elements are estimated to be potentially active in the average human [140, 141]. L1 transcription and/or mobilization is upregulated by different types of stress including genotoxic stress, oxidative stress and, in the mouse, exercise stress [141, 142]. Interestingly, in a recent in vitro screening of 95 compounds for ones that enhance human L1 mobilization, the anti-pyretic analgesic salicylamide was found to not only increase L1 promoter activity but also slightly enhance L1 retrotransposition in HeLa cells [141]. Derepression of retrotransposons has also been documented during replicative senescence of human cells [143–145] and the protein product of Sirt6 (SIRT6 in humans), a prototypic longevity gene in mice, binds to the promoter of L1 silencing its transcription [146]. Few studies have attempted to survey transposable element transcription genome-wide using high throughput sequencing due to the ambiguity in assigning short reads mapping to more than one genomic location (multi-mapping reads; [147]). However, using a “fractional counts” method which at least partially overcomes this problem, Criscione et al. were able to show that many of the LTR retrotransposons in humans are transcriptionally active in multiple human cell lines and that cancer cell lines displayed increased RNA Polymerase II binding to retrotransposons than cell lines derived from normal tissue. They also found significantly higher levels of L1 retrotransposon RNA expression in prostate tumors compared to normal-matched controls [147]. Retrotransposons are increasingly being considered for their potential role in human diseases [148, 149].
Transcriptome
The ENCODE Project
The first attempt to comprehensively map the human Transcriptome was carried out by the Encode Pilot Project [150]. The ENCODE pilot project selected DNA from 30 Mb (~1 %) of human genome. 15 Mb was manually selected based on the presence of well-studied genes or other known sequence elements and the existence of a substantial amount of comparative sequence data. The second 15 Mb was chosen from 30 to 500 Kb randomly selected regions demonstrating a good sampling of regions with varying content of genes and other functional elements [150]. Two types of tiling arrays were constructed that spanned these regions, oligonucleotide arrays and spotted arrays [150–152]. Repetitive elements were removed by RepeatMasker [153]. The study examined RNA from 11 cell lines and 20 tissues.
The next phase of ENCODE, which was completed in 2012 [51], introduced two significant changes. Now studies were extended to the entire genome (the remaining 99 %) and use of massively parallel or next generation sequencing (NGS; see Chap. 5 of this volume) was instituted. The latter greatly increased the sensitivity and through-put analysis of fragments of DNA from such techniques as ChIP, FAIRE, and DHS [154] which were now sequenced and mapped directly to the DNA of the human genome. Techniques used to directly evaluate RNA were likewise utilized with equally dramatic increases in sensitivity and through-put [28, 155]. In addition, a new research effort, Genome Wide Association Studies (GWAS), had begun the goal of which was to find genetic variations associated with a particular disease by rapidly scanning markers across the genomes of many people [156]. These studies are supported by a public-private partnership, the Genetic Association Information Network (GAIN) that includes the NIH, the Foundation for the National Institutes of Health, Pfizer Global Research & Development and others and independently by various individual NIH institutes.
Transcriptome as Viewed from the ENCODE Pilot Project
With regard to transcription and assuming that the ENCODE 30 Mb were representative of the entire genome, one might have expected approximately 2 % of the region to have been transcribed. However, the study found that over all samples 92.6 % of bases represented in the ~30 Mb ENCODE region were transcribed into primary transcripts and 24.1 % into processed transcripts [150]. This was at least partly explained by the fact that 63 % of the transcripts mapped to regions outside of those for the annotated genes of this DNA and did not appear to code for protein [150]. Alternative splicing was a common feature occurring in 86 % of multi-exon gene loci which generated >5.4 transcript variants per locus on average [157]. This was further evaluated using 5′ rapid amplification of cDNA ends (RACE) and tiling arrays for the 399 genes located entirely within the ENCODE regions using RNA derived from 12 tissues. Investigators were able to detect RNA transcribed from 359 of these loci [150, 158]. 90 % of these genes contain a novel sequence some of which extended 50–100 kb 5′ to the annotated gene’s 5′ transcription start site. The studies demonstrated that a given gene may both encode multiple protein products and produce other transcripts that include sequences from both strands and from neighboring loci often without encoding a different protein [150, 158]. Transcription start sites (TSS) were assessed using two 5′-end-capture technologies, that is, cap analysis gene expression (CAGE) in which short (∼20 nucleotide) sequence tags originating from the 5′ end of full-length mRNAs are sequenced [159] and paired-end tag (PET) sequencing of cDNA [160]. 4,491 TSSs were found from these analyses, almost 10 times more than the number of established genes which was felt to potentially explain the extensive degree of transcription previously noted [150]. These findings were refined and extended in the subsequent phase of the ENCODE project which examined the entire human genome.
ChIP, DHS, and FAIRE: Techniques to Identify Enhancer Sequences
Other studies to characterize the genome in conjunction to RNA transcription were performed. ChIP-chip studies sought to identify promoter and enhancer sights by first treating chromatin with restriction enzymes to fragment it, next immunoprecipitating chromatin using antibodies to polymerase II and various transcription factors and then assaying the DNA fragments on microarrays [160]. Two other techniques used to obtain open regions of DNA likely to contain active regulatory sites were DNA isolated from DNase hypersensitive sites (DHSs) and from formaldehyde-assisted isolation of regulatory elements (FAIRE) [161, 162]. In the former assay chromatin is treated with low concentrations of DNase I and the fragments separated on an agarose gel. The low molecular weight fragments were isolated, amplified, and examined on tiling arrays. In the FAIRE technique, the chromatin is treated with formaldehyde to cross-link histones to other histones and to DNA. The chromatin is then fragmented by sonication and extracted with phenyl:chloroform. The DNA fragments from the open regions of chromatin without histones separate into the aqueous phase of the extraction and the histone:histone and histone bound DNA sequester to the organic phase. The DNA fragments recovered from the aqueous phase were amplified and examined on tiling arrays. Loci identified by these techniques were presumed to represent enhancer elements (transcription factor binding sites) and were designated regulatory factor binding regions (RFBRs). 65 % of these RFBRs were located within 2.5 kb of known or novel TSSs. Further analysis indicated a relationship between tissue specificity and unique TSSs and regulatory clusters (RFBRs) that were detected in the tissue [150].
Histone Modifications (Marks)
Histones represent another important class of molecules associated with the control of DNA transcription [163]. Within chromatin, DNA is tightly wrapped around a disc-shaped core of eight histone proteins—two molecules each of histones H2A, H2B, H3, and H4. Double-stranded DNA that is 146 base pairs long is wrapped around this protein core to form the nucleosome. Another histone, H1 binds to the DNA as it exits the nucleosome. Nucleosomes are arranged initially as 10 nm diameter fibers [164] with some studies suggesting higher orders of super coiling into 30 nm or greater diameter fibers [46, 163] though the view of chromatin consisting of predominantly of 30 nm fibers is currently disputed [164]. Eukaryotic cells contain large multi-subunit proteins called chromatin-modifying complexes [163, 165] that posttranslationally modify the histones within the nucleosomes to cause the chromatin to be more or less compact (see Fig. 1.3; (modified after figure in Box 1 Histone Code in Sparmann et al. [166])). Modifications include acetylation, methylation, phosphorylation, and ubiquitination which operationally function by either disrupting chromatin contacts or by affecting the recruitment of nonhistone proteins to chromatin which can orchestrate the ordered recruitment of enzyme complexes to manipulate DNA [165, 167]. The histone modifications are created by pairs of enzymes that exhibit antagonistic effects toward each specific modification [168, 169]. For example, histone acetyltransferases (HATs) acetylate lysines, while histone deacetylases (HDACs) remove the acetyl groups of lysines [168, 169]. Acetylation of histones may in turn act as docking sites to stabilize or further recruit other protein complexes including chromatin remodelers which in turn can reposition or evict nucleosomes along the DNA in an ATP-dependent fashion thus creating nucleosome-free regions on enhancer sequences [170]. The ENCODE project tested for a number of these modifications applying ChIP-chip using the well-studied histone H3 and H4 modifications histone H3 acetylation at lysine 9, 14, (H3ac), histone H4 acetylation at lysine 5, 8, 12, 16 (H4ac), and histone H3 methylation at lysine 4 mono-, di-, and trimethylation (H3K4me1, H3K4me2, H3K4me3, respectively) [171]. The resulting maps and subsequent studies have indicated clear patterns of histone modifications. Chromatin DNA locations that are high in H3K4me1 but low in H3K4me3 have proven to be highly predictive of enhancer locations [170] and H3K4me1 is a mark of active enhancers. The TSSs of genes are closely associated with H3K4me3, H3K4me2, and H3ac modifications and H3K4me3 is a mark of gene promoters. TSS patterns differed between active and inactive genes. Expressed genes had distinct peaks of H3K4me2, H3K4me3, and H3ac modification downstream from the TSS. H3K27ac is a mark of transcriptionally active regions. The histone H3K27me3 is a mark of repressed regions and is generated by the Polycomb repressive complex 2 (PRC2) [172] discussed subsequently in section “Polycomb Group (PcG) Proteins”. Another mark of repressed regions is H3K9me3 which is a repressive mark associated with constitutive heterochromatin and repetitive elements [51, 125, 173]. The histone modification profiles show differences between cell lines associated with differences in gene transcription [125, 171].
Fig. 1.3
Histone posttranslational modifications are necessary for control of gene transcription. Modified from [166]. Used with permission
Splice Variants
Studies from the ENCODE project published in 2012 which examined the transcriptomes in 15 cell lines [126] found that, cumulatively, 74.7 % of the human genome was covered by primary transcripts and 62.1 % by processed transcripts. As in the ENCODE pilot project, genes expressed many splice variants simultaneously with an average of about 10–12 expressed isoforms per gene per cell line. One isoform dominates in a given condition usually capturing a large fraction of the gene’s total transcripts—at least 30 %. In a related study, transcripts of 492 protein coding genes on human chromosomes 21 and 22 were analyzed for locations of their 5′ and 3′ transcriptional termini [174]. For 85 % of these genes the boundaries extended beyond the current annotated termini most often connecting with exons of transcripts from other well annotated genes [174]. This finding could potentially cause problems for molecular pathologists since chimeric transcripts might be regarded as cancer specific [175]. This particular issue was addressed recently by Greger et al. [176] who examined RNA sequencing data from cell lines prepared from 462 individuals who participated in the 1000 Genomes project [177]. They identified 81 RNA tandem chimeric transcripts from the cell lines of these normal individuals. Six chimeric transcripts were intrachromosomal fusions of genes located on different strands and 15 were interchromosomal fusions. Six fusion transcripts had been regarded as cancer-specific [176]. None of the fusion transcripts are currently used clinically but the finding of these chimeric transcripts does raise questions with regard to the issue of adequate controls.
Alternative splicing is known to influence biological outcomes such as sex determination, neural differentiation, and programed cell death and can contribute to cancer progression [178]. Xiong et al. were able to identify 20,000 unique single nucleotide variants likely to affect splicing [178, 179]. The method correlates the presence of SNVs and the presence or absence of inclusion of a specific codon in the target transcript and does not take into account the presence or absence of a disease phenotype. Nevertheless, the method was successful in identifying misspliced genes with neurodevelopmental phenotypes in individuals with autism and expressed misspliced variants of MLH1 in patients with Lynch syndrome [179].
Noncoding RNAs
The compilation by ENCODE of all genes and transcripts identified in the ENCODE project is referred to as GENECODE [127]. Version 21 (June 2014 freeze) contains 196,327 transcripts and 60,155 genes [180]. Of these genes 19,881 are protein coding genes, 35,758 noncoding RNA genes with the remainder consisting of pseudogenes and immunoglobulin/T-cell receptor gene segments [180]. With regard to noncoding RNA genes 15,877 are classified as long noncoding genes (lnc) which is the term used for transcripts that are not associated with protein-coding loci with a minimum size of 200 bp. As has been noted earlier, not all genes encode for proteins the most obvious and abundant being genes for rRNA and tRNAs but also snRNAs, snoRNAs, miRNAs, and piRNAs. However, transcript function has generally been defined in terms of its role in protein expression. Mudge et al. [181] now suggest that in light of the abundant number of genes for noncoding RNAs and chimeric mRNAs the definition be broadened and a functional transcript be defined “as one that makes a contribution to phenotypic complexity, regardless of the mechanism by which this occurs”. Nonfunctional transcripts would then comprise all transcripts created by biological mechanisms (as opposed to technical artifacts) for which no such “contribution to phenotypic complexity” can be as yet determined.
Long Noncoding RNAs
Long Noncoding RNA Functions
The proportion of lncRNAs transcripts that have a confirmed function is small [181] but the number of studies of lncRNAs is rapidly increasing [182] which is broadening understanding of gene regulation in health and disease [183–186]. Transcription of lncRNAs occurs from a variety of circumstances. These include transcription from the complementary strand of protein-coding genes (anti-sense transcripts), bidirectionally from polymerase II promoter sites, from enhancer sites (eRNAs), from intergenic regions (lincRNAs), and from repetitive element- associated noncoding RNAs [182]. LncRNAs tend to be expressed at low levels but are sufficiently conserved to suggest functionality for some members [182]. LncRNA expression is more cell type specific than protein-coding genes [126]. In pairwise correlations computed between lncRNA and protein-coding genes (lncRNA-mRNA) from 16 Human Body Map tissues using RNA-seq expression values, lncRNAs showed particularly striking positive correlation with the expression of antisense coding mRNA genes [187]. Bidirectional transcription from promoters seems to be widespread and conserved through evolution suggesting that it may facilitate protein-coding gene expression by promoting an open chromatin structure at the promoter or by recruiting transcriptional regulators [182, 188]. eRNA expression correlates with the expression of neighboring genes [182, 189] and may play a role in establishing cell-type-specific chromatin restructuring at enhancers [190]. Repetitive element-associated noncoding RNAs such as noncoding RNA from intergenic retrotransposons may alter protein expression as their transcription was shown to correlate with expression of the nearest upstream or downstream RefSeq transcript (within 100 kb) [191] but the mechanism for this effect is unclear.
A number of long noncoding RNAs referred to as competitive endogenous RNAs (ceRNAs) appear to act as “decoys” or “sponges” and to “soak up” miRNAs which might otherwise regulate translation of an expressed mRNA. Some transcribed pseudogenes have been shown to act in this manner [185]. In the case of PTEN and KRAS [192], Poliseno et al. used siRNA to suppress the transcribed pseudogene PTENP1 which is homologous to that for PTEN. This resulted in down regulation of PTEN expression due to increased levels of miRNAs that target the PTEN miRNA recognition region (miRNA-response elements (MRE)) of the PTEN mRNA. They also found in a group of colon cancer patients that copy number decrease in the PTENP1 locus was associated with down regulation of PTEN in the patients’ tumors. In the same model system the investigators demonstrated that over expression of the KRASP1 pseudogene caused enhanced expression of mutant KRAS and an increased growth rate of the cell line [192]. An analogous finding that the intergenic long noncoding RNA (lincRNA) HULC (hepatocellular carcinoma up-regulated long non-coding RNA) acts as a ceRNA or “sponge” for miR-372 has been reported [193]. HULC contains a CREB transcription factor binding site (DNA enhancer element) located at −67 to −53 nt in its core promoter as well as a miRNA recognition element for miR-372 in its transcript. Inhibition of miR-372 leads to reduced translational repression of another target gene, PRKACB, which in turn leads to phosphorylation and activation of CREB which auto stimulates HULC transcription. This will then presumably “soak up” more miR-372 further enhancing PRKACB activity and HULC transcription [185, 193].
Many lncRNAs bind to the previously mentioned large multi-subunit protein chromatin-modifying complexes and appear to cause epigenetic modification of gene expression through their interactions with chromatin-modifying complexes and through three dimensional (3D) modification of chromatin [182, 194]. Functionality of these lncRNAs will be further considered below in sections “Long Noncoding RNAs Recruit Chromatin Modifying Complexes” and “Some lncRNAs Alter the 3-Dimensional Structure of Chromatin In Vivo”.
Regulation of Gene Expression of Long Noncoding RNAs
Although there are clearly transcript and context specific features, regulation of lncRNAs genes seems to follow paradigms for protein coding genes. Genes for expressed lncRNAs have histone modifications indicative of actively regulated gene promoters but show lower and more tissue-specific expression than protein-coding genes in mice [128]. Hu et al. examined expression and regulation of a minimum of 1,524 lincRNAs during T cell development and differentiation of which 73 % were unannotated [195]. These lincRNAs are located in genomic regions enriched for protein coding genes with immune-regulatory functions and many of them appeared to be regulated by the key T cell transcription factors TBX21 (T-bet), GATA3, STAT4, and STAT6 [195]. In the case of another lncRNA XIST (Xist in mouse), the promoter regulatory region contains a binding site for the transcription factor ZFP42 (REX1) which acts to suppress XIST transcription. Embryonic cells express an X linked gene RLIM (RNF12) whose protein acts to degrade ZFP42 (REX1). In female embryonic cells where two X chromosomes are present, the level of RLIM (RNF12) protein rises to a level sufficient to cause degradation of enough ZFP42 (REX1) that lncRNA XIST is activated causing one of the X chromosomes to undergo X chromosome inactivation [196]. In another example, the long intergenic noncoding RNA HOTAIR has been shown to be transcriptionally regulated by MYC (c-MYC) through a response element located ~1,053 upstream of its TSS [197]. Interestingly, HOTAIR contains an miRNA recognition element in its transcript for miRNA-130a and may play a role as a “sponge” or ceRNA for this miRNA in certain tumors while miRNA-130a may act to control the levels of HOTAIR through the mechanisms previously described for degradation of messenger RNAs [197].
While it would appear that lncRNA gene regulation follows the same processes and mechanisms as for protein encoding genes, some systematic differences between them appear to exist [198]. Alam et al. found that A/T-rich mono-, di, and tri-nucleotide patterns are enriched at the promoters of lncRNA genes, relative to the promoters of protein-coding genes. On the other hand CpG islands (CGIs) overlap with about two-thirds of protein-coding gene promoters while lncRNA gene promoters quite rarely overlap with CGIs. The investigators also examined in silico the predicted incidence of known enhancer sequences, that is, transcription factor binding sequences (TFBSs) [55] at the promoters of both gene types and found 74 TFBSs overrepresented in promoters of protein encoding genes and 140 TFBSs over represented in promoters of lncRNA genes [198]. Included among those TFBSs over represented in promoters of lncRNA genes were 13 (27 %) of the total known human nuclear hormone receptors. lncRNAs have been reported to play a direct role in the regulation of transcription factor proteins especially nuclear hormone receptor proteins [199–202]. The transcription factors NKX2-2, members of the HOXD cluster and CEBPA which are known to be regulated by lncRNAs also had their enhancer sequences (TFBs) over represented in lncRNA gene promoters [198]. The finding that several TFs that are known to be directly regulated by lncRNAs demonstrate enrichment of their putative TFBSs at lncRNA promoters suggests that the TFs and the lncRNAs may participate in a bidirectional feedback loop regulatory network. The investigators overlapped lncRNA-promoter-enriched TFBSs with ENCODE ChIP-seq experimental evidence for the corresponding TFs across all ENCODE ChIP-seq datasets [203] and identified three TFs whose sequences were not only over represented at lncRNA gene promoters but were also detected by Chip-seq data thus indicated that they were presumably activate at the respective genes. The three TFs were GATA3, ARID3A, and MEF2A [198]. This overlap at least suggests that these three TFs might direct genome-wide lncRNA transcriptional programs. GATA3 was previously discussed as a regulator of lncRNA genes in relation to T cell development and differentiation [195]. Other comparisons indicated that lncRNA genes tended to be associated with more repressive chromatin than protein-encoding genes but this might be due to: (a) generally lower levels of expression by lncRNA genes, (b) the fact that lncRNA genes show greater tissue specificity of expression than protein encoding genes, and (c) indicators (marks) of expressive and repressive chromatin have been largely defined for protein encoding genes and therefore marks that are indicative of noncoding gene expression have as yet not been defined [198, 204]. These findings also raise the possibility that cells may be able to modulate lncRNA expression levels independently of mRNA levels via distinct regulatory pathways [198].
Transcription Factors and Enhancer Elements
Cellular phenotype reflects a cell’s growth requirements and functional capabilities which the cell manages through its pool of transcribed genes and transcriptome. As noted earlier, at least for protein encoding genes, gene transcription is highly dependent on association of the gene’s promoter region with enhancer elements and their bound transcription factors [52, 56, 57]. The number of transcription factor proteins are estimated to be 1,300–1,400 based on a survey of proteins with DNA binding domains and most of these are unannotated [55]. A gene expression study using Affymetrix U-133 GeneChips, which contain probes for 873 TFs, was performed on 32 normal tissues and showed expression of 510 TFs in at least one tissue. Approximately 1/3 (161 TFs) were present in all or most tissues with similar expression levels (ubiquitous TFs) while 2/3’s were selectively expressed in a few tissues (specific TFs). 172 TFs (34 %) were completely unannotated and were distributed similarly into the “ubiquitous” (69 TFs) and “specific” (103 TFs) categories [55].
While within the cell there is a one-to-one correspondence between a transcribed gene and its DNA sequence, there are on average tens to hundreds or more binding sites for each transcription factor [51, 52]. The ENCODE project provided two separate estimates of enhancers per cell one in the range of 400,000 “regions with enhancer-like features” [51] and the second 8.4 million “distinct DNase I footprints” [52]. When TFs bind to enhancer elements they cause the chromatin to decondense making the DNA accessible to cleavage by DNase I. However, the fragment of DNA actually bound to the TF is resistant to further DNase I cleavage leaving it as a “footprint” which can be isolated and sequenced [205]. If enough adjacent DNA sequence remains in the isolated “footprint” segment then the enhancer sequence can be assigned to a specific location within the human genome [52]. Using this approach applied to DNase I cleavage libraries from 41 diverse cell types, Neph and colleagues identified collectively 45,096,726 6–40 bp footprints across all cell types which they resolved to 8.4 million distinct footprint elements, each occurring in one or more cell type [52]. The number of footprints found per cell type ranged from 434,000 to 2.3 million. The ~400,000 “regions with enhancer-like features” is a value derived from a bioinformatics Hidden Markov Model (HMM) study based on inputted chromatin features such as DNase I hypersensitive sites, FAIRE data, and histone mark (ChIP-seq) data applied to nonoverlapping 200 bp segments of genomic DNA [206]. HMM attempts to assign a state (E.g. enhancer, promoter, TSS, and repressed) based on the inputted data [207] (see [208] for a nonbiological understandable example of HMM; see [209] for a bioinformatics example). The bioinformatics model presumably has use when applied to data across broad classes of metazoa [210] but will not be further considered here. The 8.4 million footprints were reduced to 683 unique motifs of which 394 were identified in experimentally-grounded motif models in three transcription factor databases (TRANSFAC [211, 212], JASPAR [213], UniPROBE [214]). Of the 289 novel motifs, all showed features of in vivo occupancy and evolutionary constraint similar to motifs for known transcription factors and showed cell-selective occupancy patterns highly similar with well-established TFs [52]. Neph et al. used the DNase I footprint data from the 41 cell lines to construct transcription factor regulatory networks and demonstrated that these networks were highly cell type specific reemphasizing the role of transcription factors in determining cell type specificity [57]. To construct the networks 475 transcription factor genes with well-annotated recognition motifs were identified using the three previously mentioned transcription factor databases [211–214] along with all DNase I footprints within a 10 kbp interval centered on the hub gene’s transcriptional start site (i.e., the hub gene’s proximal regulatory region or promoter region). To construct the network, each TF gene (hub) was connected to every other TF gene that the hub gene appeared to regulate by virtue of the presence of hub gene’s footprint in the other TF gene’s promoter region. These connections represented the regulatory interactions (edges) of the network. 475 transcription factors theoretically have the potential for 225,625 combinations of TF-to-TF regulatory interactions or network edges. However across all cells only a total of 38,393 unique, directed TF-to-TF edges were observed with an average of 11,193 TF-to-TF edges per cell. Regulatory interactions were highly cell-selective and were most frequently restricted to a single cell type, and collectively the majority of edges were restricted to four or fewer cell types. Only 5 % of edges were common to all cell types [57]. There was good agreement between the generated or “de novo” networks with TF-to-TF circuitry of known networks. The investigators computed for each cell type a normalized network degree (NND) vector [215] to capture the degree to which different cells type networks utilize similar transcription factors and clustered the cell types based on their NND vector. The resulting network clusters arranged the cell types into groupings that paralleled both anatomical and functional phenotypic characteristics [57]. These studies further verified that differences in patterns of activation of enhancer elements drive the gene expression patterns that are responsible for cellular differentiation and developmental identity [52–54, 56, 57].
Chromatin Structure and Epigenomics
Chromatin Structure
Overview of Organization of DNA and Chromosomes Within Interphase Nuclei
The nucleus is the largest organelle within the eukaryotic cell measuring 5–10 μm in diameter [216, 217]. It is surrounded by two phospholipid bilayer membranes. The two membranes fuse at the nuclear pores through which RNA and proteins are transported between nucleus and cytoplasm. In many cells, the outer nuclear membrane is continuous with the rough endoplasmic reticulum, and the space between the inner and outer nuclear membranes is continuous with the lumen of the rough endoplasmic reticulum [216]. Beneath the inner nuclear membrane is a layer termed the nuclear lamina which is a mesh-work of type V intermediate filament proteins called Type A and B lamins [216–218]. The human genome contains about 1,300 discrete lamina-associated domains (LADs) that range in size from 80 kb to 30 Mb and together contain thousands of genes [219, 220]. The vast majority of lamina-associated genes are transcriptionally inactive and enriched in repressive histone marks such as H3K27me3 and H3K9me2 [219, 220]. The remainder of the interior of the nucleus is occupied by chromatin comprising the 46 human chromosomes, various nuclear bodies including the nucleolus [73, 89], Cajal body [221], nuclear speckles [222], various multi-subunit chromatin-modifying complexes [163, 165], proteins and lncRNAs responsible for RNA transcription [223] and DNA replication [224], and actin filaments and monomers [225, 226]. The nuclear space not occupied by the sub-inner membrane lamins, chromatin, and various nuclear body components is generally referred to as the nucleoplasm. The question regarding whether the nucleoplasm is filled by a “nuclear matrix”, that is, by some sort of nucleus-wide arborized network of filaments extending throughout the nucleoplasm has been intensely debated for the last 15 years [227–230] with the consensus seeming to not favor its existence ([230, 231] though this view is not universal [232, 233]). One source for such a matrix might originate from the nuclear lamins. In addition to being present in the nuclear lamina region, both types of lamins are also present in the nucleoplasm [218, 234]. In the nucleoplasm type A lamins are highly mobile while type B lamins are mainly immobile [234]. This suggests that nucleoplasmic type B lamins are either assembled into some type of structure or are tightly associated with other unknown immobile structural components [218, 234]. Recently, Belin et al. examined the nucleoplasm with probes for monomeric and filamentous actin [226]. Monomeric actin was detected in nuclear speckles, globular structures enriched in pre-mRNA splicing factors, which was said to be consistent with proposed interactions between actin and RNA-processing factors [222]. Filamentous actin was present in punctate structures throughout the interchromatin space and was excluded from chromatin-rich regions. Actin filament motion was quite slow and said to be “backtracking” in a manner characteristic of particles embedded in a viscoelastic medium such as a protein-based mesh similar to the proposed nuclear “matrix” [225].
Interphase Chromosomes Are Arranged in Chromosomal Territories (CTs)
The nucleus holds two copies of the human genome. The human genome consists of approximately 3.3 billion base pairs and in solution DNA has a dimension of 0.334 nm of length for each base [235]). Thus each human haploid genome measures approximately 1.1 m in length. Two copies of this DNA must be folded and arranged within the cell’s 5–10 μm diameter nucleus in a manner that allows transcription, replication, and cellular differentiation to occur. The end points of this process, that is, the initial folding of DNA and combining with histone proteins to form a 10 nm diameter chromatin fiber of nucleosomes (Fig. 1.3 above [163, 164]) and the localization of chromosomes into chromosome territories (CTs) within the interphase nucleus (Fig. 1.4 (figure 1B in [236])) [236, 237] are well documented. However, there are multiple unanswered questions regarding the higher order organization and arrangement of chromatin fibers within CTs as well as with regard to the proximity patterns of CTs themselves [238]. Proximity patterns of CTs, that is, their radial arrangements and neighborhood arrangements within nuclei appear to vary across cell types without any clear overarching generalizations in evidence. In spherical nuclei of lymphocytes the CT for gene rich chromosome 19 is predictably located near the center of the nucleus and that for gene poor chromosome 18 located in the periphery [237]. In the flattened oval nuclei of human fibroblasts the size and other physical parameters of the chromosomes appeared to have a greater impact on the location proximity patterns between chromosome CTs [236–238]. Gene-dense and/or highly expressed sequences were found equally distributed throughout their respective territories [237]. In other studies, while a given neighborhood arrangement of CTs was stable once established at the onset of interphase, this arrangement was not maintained following metaphase in daughter cells [237, 239]. Nuclear arrangements of CTs as well as chromatin order within CTs and genetic loci have been reported to undergo major changes during cell differentiation and upon certain functional demands such as erythroid differentiation, adipogenesis, hormonal stimulus, and when proliferating cells become quiescent following serum starvation [240–242]. One striking example of altered arrangement of chromatin within nuclei occurs in the nuclei of rod photoreceptor cells of nocturnal mammals. In these cells heterochromatin is localized in the nuclear center whereas euchromatin, as well as nascent transcripts and splicing machinery, line the nuclear periphery [243]. The inverted rod nuclei act as collecting lenses, and computer simulations indicate that columns of such nuclei channel light efficiently toward the light-sensing rod outer segments [243].
Fig. 1.4
Chromosomal territories of human G0 Fibroblast Nucleus (46, XY). Modified from [236]. Used under creative commons attribution license
CTs Are Composed of Chromatin Domains (CDs)
CTs are postulated to be built up from chromatin domains approximately 1 Mbp in size [237, 238]. This size was chosen on the basis of early studies using autoradiography indicating that in S-phase nuclei replication foci measured 1 Mbp in size on average and that these replication domains appeared to be a constant recurring feature of the chromatin over multiple cell cycles [238, 244–246]. Evidence for a functional chromatin domain size of ~1 Mbp also comes from a study by Kolbl et al. [247]. These investigators measured the radial nuclear position in a human Burkitt lymphoma cell line of three marker genes located on the short arm of chromosome 1 but separated by at least 10 Mbp. Expression levels as measured by qPCR of the three genes were the same whereas the total expression strength (TES) calculated as the sum of the transcription of all genes annotated within a surrounding window of about 1 Mbp DNA differed for each region. Radial nuclear position of the studied regions and genes correlated with total expression strength (TES) with highest TES occupying the most interior nuclear position [247].
Chromatin within the 1 Mbp domains is assumed to undergo varying degrees of compaction that enable it to fit within the dimensions of the CT and the nucleus (Fig. 1.5). Studies by Maeshima and others suggest that this compaction is accomplished through a process of irregular folding of the 10-nm fibers [46, 164]. The exact nature of the irregular folding is unclear and has been posited to be due to macro-molecular crowding [164, 248] associated with specific proteins such as cohesion and/or codensin II [164, 249, 250] or to formation of fractal globules from repeated crumpling (fractal model) that is a form of folding in which the clumped strands of chromatin within the globules avoid becoming entangled [46, 251, 252].
Fig. 1.5
Chromatin organization in the mammalian nucleus. Chromatin organization in the mammalian nucleus. (a) Chromosomes are organized in chromosome territories. (b) Chromosome territories are comprised of fractal globules, and fractal globules from adjacent chromosome territories can interdigitate. (c) Chromatin fibers interact (i) within a fractal globule (frequent), (ii) between fractal globules of the same chromosome territory (rare), or (iii) between adjacent chromosome territories (very rare). (d) Chromatin is resolved as a 10 nm “beads on a string” fiber consisting of nucleosomes. Modified from [46]. Used with permission
Arrangement of Chromatin Within CTs as Viewed by Microscopy
The arrangement of chromatin within CTs has been postulated to follow one of three patterns ([238] and references therein). In the chromosome territory-interchromatin compartment (CT-IC) model, CTs are built up from highly folded chromatin in chromatin domains (CDs) surrounded by a perichromatin region (PR) containing less condensed (decondensed) chromatin and a nearly DNA-free interchromatin compartment (IC) between the chromatin domains. The processes of DNA transcription, DNA replication, RNA splicing, and DNA repair take place in the perichromatin region (PR). In the interchromatin network (ICN) model euchromatin is made up from chromatin from chromatin fibers, which intermingle more or less homogeneously by constrained diffusion both in the interior of CTs and between neighboring CTs. In the giant loop field (GLF) model and long-range field (LRF) model transcription occurs on giant chromatin loops which expand from the surface of CTs and form a field of intermingling loops. When transcription ceases, the giant loops collapse back into condensed core domains of CTs. Using 3D structured illumination microscopy (3D-SIM) which detects targets of emitting fluorophores with an approximately eightfold improved resolution over conventional confocal laser scanning microscopy [253], Schermelleh et al. detected the presence of channels emanating from nuclear pores and extending through the lamina and into the heterochromatin [254]. Markaki et al. studied nuclei of C127 cells derived from a mouse mammary tumor using 3D-SIM and Hela cell nuclei with spectral precision distance/position determination microscopy (SPDM). The latter allows time-resolved single-molecular localization with a localization accuracy of a few nanometers in the lateral plane of the specimen [255]. Their studies examined nuclei for newly synthesized (nascent) RNA and DNA using BrUTP to detect the DNA and ATTO 488-dUTP to visualize the RNA. Immunofluorescence was used for detection of RNA polymerase II, histone H3K4me3, and H4K8ac the latter two of which are enriched at promoter regions of genes. Their studies clearly demonstrated the pattern of chromatin domains separated by interchromatin channels consistent with the CT-IC model. Chromatin domains showed decondensed chromatin along the edges of the IC which location was also the exclusive site of Polymerase II, nascent RNA, and nascent DNA. IC varied in width across a broad range from narrow channels to “lacuna” size ≥400 nm. Narrow IC channels could be filled with decondensed chromatin representing the PRs from two closely neighboring CDs whereas the interior of IC lacuna was home to splicing speckles but chromatin (giant loops or otherwise) was absent [241].
Chromosome Conformation Capture Techniques
Chromosome Conformation Capture (3C)
Molecular testing utilizing chromosome conformation capture (3C) and its derivative techniques 4C, 5C, and Hi-C along with next generation sequencing has greatly aided understanding of the 3D organization of the genome within the cell nucleus and long-range chromatin interactions between promoter and enhancer elements [252, 256–261]. 3C is mainly used in hypothesis-driven experiments, based on some prior knowledge such as the genomic locations of functional elements of interest [258, 262]. In preparing to undertake the study, areas of interest on the human genome which one wishes to investigate regarding possible joint proximity are identified. A restriction enzyme site is identified that will cut out each of the target sequences and PCR primers are made to the 3′ end of each of the target restriction fragments. The study is performed by first isolating nuclei and then treating them with formaldehyde which results in cross-linking pieces of chromatin that are in physical contact with each other [258, 262]. Next the chromatin is digested with the restriction enzyme of choice. The digested chromatin is diluted and ligation carried out under conditions such that “intra-molecular” ligation is favored. Under these circumstances some of the pieces of restricted DNA in the cross-linked chromatin fragments containing DNA from different target areas will ligate together such that their primer sites are aligned for proper amplification during PCR. The chromatin fragments are then treated by heating to 65 °C in the presence of proteinase K to release the ligation products which are detected via PCR-based methods [262]. The results of this type of study are a frequency table of the proportion of times that a specific target links with another one of the selected target sites (one-to-one assay).
Circular Chromosome Conformation Capture (4C)
Each of the remaining types of chromosome conformation capture assays follow the same general methodology outlined above but with increasing greater and more generalized detection of proximity associations. In the circular chromosome conformation capture (4C) technique investigators first identify specific genomic sequences (the “view-point” sequences) such as genes stimulated by the glucocorticoid receptor [263] for which they desire to learn the proximity partners. In the 4C method they do not need to know anything regarding the sequence or location of possible proximity partners. The view-point sequence is marked by a restriction site (generally a 6 bp cutter site) at its 3′ end and a second different restriction site (generally a 4 bp cutter site) at its 5′ end. PCR primers are then created at the 5′ and 3′ ends of the view–point sequence such that they extend away from each other. In line with the 3C protocol, chromatin is restricted with the 6 bp cutter then subjected to ligation under conditions favoring “intra-molecular” ligation during which time some view-point and proximity sequences join to each other. The reaction is then digested a second time with the 4 bp cutter and again ligated under conditions favoring “intra-molecular” ligation. Under these circumstances some of the DNA fragments from the view-point sequence which had linked to proximity segments during the first ligation will now form circles during the second ligation that contain a view-point and proximity sequence thus enabling the PCR primers to amplify across the proximity sequence and create a library of proximity fragments with portions of the viewpoint sequence on each end to identify which viewpoint sequence the proximity sequence was linked to in vivo. The base sequences of the interacting chromatin DNA can then be assessed using NGS or microarray (chip) techniques thus permitting testing of one (view-point sequence) to all (proximity) sequences.
Carbon Copy Chromosome Conformation Capture (5C)
Chromosome conformation capture carbon copy (5C) technology [264] was designed and implemented by the same group that developed the original 3C methodology and represents a scaled-up version of the latter. To carry it out it is necessary to design and create hundreds of primers that reflect the 3′ sense and antisense sequences at all of the restriction sites across the genomic regions which one wishes to interrogate for chromatin interactions (see Dostie et al.; supplemental tables 3 and 4 [264]). The 5′ and 3′ primers each have a specific sequence on their 5′ and 3′ extended tails (T7 promoter sequence used for 5′ primer sequence tails and T3 promoter sequence used for 3′ primer sequence tails). The 5′ and 3′ primers are hybridized with the DNA fragments generated by a 3C assay in a multiplex ligation assay. The successfully ligated 5′ and 3′ primer pairs identify the presence of 3C DNA fragment that represents a specific long range chromatin interaction. The successfully ligated primers now constitute the 5C library and are detected by PCR amplification of the ligated reactants using T7 and T3 PCR primers followed by NGS or microarray detection of the amplified products. The investigators validated the assay in studies of a 400-kb region containing the human β-globin locus and a 100-kb conserved gene desert region [264]. 5C allows testing of many-to-many chromatin interactions across a genome [257].
Hi-C Chromosome Conformation Capture (Hi-C)
Hi-C chromosome conformation capture technology permits unbiased identification of chromatin interactions across an entire genome [252] thereby allowing testing of all-to-all chromatin interactions [257]. Conceptually, it is the simplest of the fore described chromosome conformation capture technologies. It begins with the 3C steps of formaldehyde crosslinking and restriction digestion using a restriction enzyme which leaves a 5′-overhang. The latter is filled using a biotinylated nucleotide and the resulting blunt-end fragments are ligated under dilute conditions that favor ligation events between the cross-linked DNA fragments. The resulting DNA sample contains ligation products consisting of fragments that were originally in close spatial proximity in the nucleus, marked with biotin at the junction. A Hi-C library is created by purifying and shearing the DNA and selecting the biotin-containing fragments with streptavidin beads. The library is then analyzed using NGS, producing a catalog of interacting fragments [252]. One disadvantage of this approach is that because of the all versus all approach, the number of possible interactions increases as the square of the number of sights interrogated. Thus a tenfold increase in resolution requires a 100-fold increase in sequence depth [257].
3D Organization of the Genome and Long-Range Chromatin Interactions
Transcriptionally Active and Inactive Chromatin Compartments
3C techniques have begun to offer both conformation and important additional understanding of 3D and long range chromatin interactions within the nucleus [252, 257, 260, 261, 265–268]. In Hi-C studies in both human and mouse cells CT formation was confirmed [252, 268] which showed that loci located on the same chromosome interact far more frequently than any two loci located on different chromosomes though the latter were not completely excluded [252, 261, 268]. Thus genomic linkage is clearly a very dominant factor in determining the 3-dimensional connections of any gene or regulatory element [261]. Additionally, Hi-C data revealed the presence of subchromosomal compartments termed A and B where the loci clustered in the A compartments were generally gene rich, transcriptionally active, and DNase I hypersensitive, while loci found in B compartments were relatively gene poor, transcriptionally silent, and DNase I insensitive. A and B compartments were made up of groups of large multi-Mb chromosomal domains (median size 3 Mb in mice) [252, 261, 268]. Recently, using an improved Hi-C technique, six compartments were identified in the human genome each characterized by differences in various different marks relating to gene activity [269]. A video describing the folding model for DNA according to the investigators findings as well a comment on the findings by Frances Collins can be viewed at [270].
Topologically Associating Domains (TADs)
More recently, high-resolution Hi-C and 5C data have led to the identification of small domains within larger A and B compartments in human, mouse, and Drosophila genomes referred to as topologically associating domains (TADs) [265–267, 271]. These domains are characterized by long-range associations between promoters and enhancers located mainly in the same domain, but less frequent interactions between loci located in adjacent domains. TADs have a median size of 880 kb in mice, with a range of tens of kb to several Mb [265]. This is the same length scale as the microscopic CDs, suggesting that TADs represent the same structures. Genes located within the same TAD tend to have coordinated expression during differentiation, pointing to a role of TADs in coordinating the activity of groups of neighboring genes. As discussed earlier, since CDs appear to correlate with units of DNA replication [241] this may also turn out to be a feature of TADs. TADs do represent a feature of chromosome organization that is largely conserved across mammalian cell types [265, 266], in contrast to A and B compartments (active and inactive gene sets respectively) that are related to cell-type specific gene expression. TAD boundary regions are enriched in transcription start sites, binding sites for the CTCF protein and the repressive histone mark H3K9me3 [265, 272]. Between TADs are distinct boundaries where chromatin interactions switch their directionality from an upstream bias (interactions within the current TAD) to a downstream bias (interactions within the adjacent TAD) [273]. TAD boundaries are also enriched in tRNA genes and Alu/B1 and B2 SINE elements [265, 273] and from earlier discussions of tRNA and SINE repetitive elements as would be expected to contain binding sites for TFIIIC [273]. Because both CTCF and TFIIIC interact with cohesin and condensins either TFIIIC alone or in combination with CTCF might have a causal role in genome organization at TAD boundaries [269, 273]. TADs also appear to be genetically defined as deletion of a boundary region in the X chromosome inactivation center led to partial fusion of the two flanking TADs [266]. Exactly why genes are organized within TADs is unclear but since TADs most frequently interact with enhancers from the same TAD, one possible function of TADs is to limit promoters to a restricted set of enhancers [274].
Many Dynamic Promoter-Enhancer Contacts Appear to Exist (“Pre-wired”) Prior to Occupancy of Enhancer Elements by Transcription Factors
A recurring feature in sets of genes regulated by different signal transducers including TGF-α, IFNγ, β-estradiol, 5α-dihydrotestosterone, and glucocorticoids as well as several loci induced by p53 (TP53) and FOXO3 is that the responsive genes appeared to be largely “pre-wired”, that is, their enhancer elements (DNA) have already been positioned through looping to be in proximity, that is, adjacent to the genes they regulate even prior to being occupied by the appropriate transcription factor (TF) [44, 49, 275–277]. In the case of TGFα (TGFA) Jin et al. using Hi-C analysis on a human fibroblast cell line (IMR90) found that 10 % or less of enhancer-promoter sites of TGFα (TGFA) responsive genes changed following TGFα (TGFA) treatment. To further generalize this finding Jin et al. examined six additional promoter-enhancer pairs by 3C assays in four different cell types (IMR90, HUVEC, MCF7, and LNCaP cells) under different stimuli (IFN-γ [IFNG], TNF-α [TNF], β-estradiol, and 5α-dihydrotestosterone, respectively). In all of these examples, evidence supported preexisting promoter-enhancer contacts between enhancers and target gene promoters prior to enhancer activation by TF and target gene induction [44].
Epigenomics
The epigenome represents the sequence-independent mitotically heritable properties of the genome that modulate the genome’s functional output, that is, its transcriptome and it is the differences in the transcriptomes expressed within each of the 200 or more different cell types in a given individual which accounts for the different tissue phenotypes [52, 56, 57, 173, 278]. Dynamic mechanisms involved in the control of gene expression have been discussed in earlier sections. Here the focus is on processes that enable mitotic heritability.
DNA Methylation
Methylation of DNA is one epigenetic mechanism controlling gene transcription and occurs with transfer of a methyl group to the cytosine of a CpG dinucleotide [278, 279]. CpG dinucleotides are concentrated in genomic regions called CpG islands ranging in size from 200 bp to several kilobases and typically located near gene promoters [278, 280]. DNA methylation is established de novo by DNA methyltransferase (DNMT) enzymes DNMT3a and DNMT3b and maintained during DNA replication by DNMT1 [279]. It is usually associated with gene silencing [279].
Polycomb Group (PcG) Proteins
Polycomb group (PcG) proteins are critical regulators of normal differentiation [281] through modification of chromatin that induces gene silencing [166, 282, 283]. PcG proteins are organized into mainly two multi-protein complexes, e.g., Polycomb Repressive Complex 1 and 2 (PRC1 and PRC2) [172]. The Polycomb complex PRC1 consists of Pc, Ph, Psc, and dRing, but many additional proteins have been found to copurify with PRC1 ([284]. PRC2 includes Eed (Esc), Suz12, RbAp48, and the catalytic subunit, Ezh2 (E(z) [284]). In Drosophila in which these proteins were first studied, PRC1 and PRC2 are recruited to genes to be silenced via association with proteins that bind to specific DNA sequences called Polycomb response elements (PREs) located next to the target genes [172, 280]. However, in mammals this recruitment mechanism fails to account for most PcG protein occupied sites in vivo and protein occupancy correlates most precisely with broad domains delineated by unmethylated CpG islands of target genes which may act as PREs in vertebrates [280]. In addition, recruitment of PcG proteins has been shown to involve lncRNAs [172, 285, 286]. The central function of PRC2 is to methylate Histone H3 on K27 with the trimethylated product (H3K27me3) widely viewed as the operative chromatin mark that accompanies PcG induced gene silencing [172]. H3K27me3 contributes to PRC1 targeting and chromatin interaction. PCR1 ubiquitylates histone H2A on K119 which plays an important role in PCR1-mediated gene silencing. PRC1 also causes compaction of chromatin and may inhibit transcription by binding to general transcription factor TFIID (TBP) thereby blocking RNA polymerase II transcription activation [172].
Histone Modifications
Posttranslational modifications of histones H2A, H2B, H3, and H4 represent another epigenetic mechanism for regulating gene expression and cell fate and have been discussed earlier in section “Histone Modifications (Marks)” (see Fig. 1.3 [166, 287]). As noted a number of histone modifications are marks of repressed chromatin such as H3K27me3 and H3K9me3. How these histone marks and other states responsible for gene silencing are transmitted through DNA replication and mitosis is still unclear but the 90 KDa nuclear protein UHRF1 may be involved. UHRF1 can recognize the hemi-methylated state of newly replicated DNA and the methylation state of H3K9 and recruit DNMT1 and H3K9 methyltransferases to methylate each molecule respectively [168].
Long Noncoding RNAs
Long Noncoding RNAs Recruit Chromatin Modifying Complexes
Transcription of long noncoding RNAs is essential for normal development but a functional understanding of how lncRNA exert its epigenetic effects is poorly understood [288]. Chromatin structure is modified and controlled by large multi-subunit proteins called chromatin-modifying complexes [163, 165, 167]. Long noncoding RNAs have been show to bind to a number of these proteins including the chromatin-modifying complex Polycomb Repressive Complex 2 (PRC2) as well as other chromatin-modifying complexes [182, 194, 285]. TUG1 is a lincRNA ubiquitously expressed in human tissues which binds to PRC2 and is induced in p53-wild type but not p53-mutant cells. Its promoter contains many highly conserved binding sites for p53 and depletion of TUG1 abolishes p53’s repressive action on up regulation of cell-cycle genes [289]. This suggests that an important function of lincRNAs maybe to guide chromatin-modifying complexes to specific genomic loci [182, 285].
“Cousins” of Chromosome Conformation Capture -CHiRP, RAP, CHART, and ChOP: Additional DNA Proximity Technologies to Study 3-Dimensional Structure of Chromatin In Vivo
“Chromatin Isolation by RNA Purification” (ChIRP) is designed to capture DNA binding sites for interacting lncRNA. With ChIRP lncRNA is crosslinked to protein/DNA adducts using gluteraldehyde in vivo. Cells are lysed and the chromatin sonicated followed by hybridization with multiple biotinylated oligonucleotide tiling probes which collectively cover a large percentage of the lncRNA. Then chromatin complexes are purified using magnetic streptavidin beads, followed by stringent washes. lncRNA bound DNA or proteins are eluted with a cocktail of Rnase A and RnaseH. DNA is characterized by qPCR or next generation sequencing (NGS). Also, additional techniques to assess proteins may be performed such as protein dot-blotting [290]. “Capture hybridization analysis of RNA targets” (CHART) is a technique that is similar to ChIRP. Cells are subjected to cross-linking using formaldehyde. A biotinylated capture oligonucleotide ~24 bp complementary to the target lncRNA is hybridized to chromatin which is sheared by sonication and purified using streptavidin beads. Aliquots to be studied for DNA binding sequences are subjected to heat treatment to reverse the cross-linking and the DNA purified with QIAGEN columns and examined by qPCR or NGS. Samples for protein analysis are treated with SDS and β-mercaptoethanol and subjected to Western Blot [291, 292]. In “Chromatin oligoaffinity precipitation” (ChOP), a biotinylated antisense oligonucleotide is used to affinity purify the target RNA and associated biomolecules from human cells treated with formaldehyde. PCR is then used to determine whether the target RNA is present at specific regions of the genome [293]. “RNA Antisense Purification” (RAP) uses biotinylated antisense 120-nucleotide antisense probes tiled across the entire length of the target RNA to form extremely strong hybrids with the target RNA thereby enabling purification using denaturing conditions that disrupt nonspecific RNA-protein interactions and nonspecific hybridization with RNAs or genomic DNA. High resolution mapping of the associated DNA target sites is achieve upon sequencing of the captured DNA. Any lncRNA is robustly captured with minimal optimization. To purify the endogenous lncRNA and its associated genomic DNA from cross-linked cell lysate RAP uses DNase I to digest genomic DNA to ~150 bp fragments, which provides high resolution mapping of binding sites. LncRNA is robustly captured even in the case of extensive protein-RNA interactions, RNA secondary structure, or partial RNA degradation [294].
Some lncRNAs Alter the 3-Dimensional Structure of Chromatin In Vivo
HOTAIR
Hox transcript antisense intergenic RNA (HOTAIR) lincRNA is located on chromosome 12q13.13 and is transcribed in the opposite direction of the HOXC gene at the HOXC locus to produce a 2.2 kbp transcript [185, 295]. HOTAIR is increased in expression in primary breast tumors and metastases and is a powerful predictor of eventual metastasis and death in primary tumors [296]. The 5′ domain of HOTAIR binds to Polycomb Repressive Complex 2 (PRC2), and the 3′ terminus of HOTAIR binds to the LSD1/CoREST/REST complex which promote coordinated H3K27 tri-methylation and H3K4 demethylation, respectively for gene silencing [295]. HOTAIR recruits the bound complexes to hundreds of genomic sites including the HOXD genes on chromosome 2q31.1 where it induces gene silencing by DNA methylation across 4 kb of the HOXD locus [156, 185, 297]. Its action on HOXD is said to be in “trans” since HOTAIR must physically relocate to a different chromosome. Targeted disruption of HOTAIR in knockout mice led to the derepression of hundreds of genes, including genes within the HOXD cluster causing a gain of chromatin marks associated with gene activation (H3K4me3) and a loss of Polycomb repressive marks (H3k27me3) at HOXD gene loci along with defects in development of spinal vertebrae and limbs [295, 298]. ChIRP-seq results support the role HOTAIR lincRNA as an active recruiter of chromatin modifying complex PRC2 [299]. ChIRP identified 832 HOTAIR genome-wide occupancy sites on multiple chromosomes and showed a significant pattern of co-occupancy when overlaid with genomic-binding data of PRC2. Many sites were annotated as enhancers and introns and HOTAIR binding events were typically no more than a few hundred base pairs, a pattern reminiscent of transcription factors. One of the high confidence HOTAIR ChIRP-seq peaks mapped to the intergenic region between HOXD3 and HOXD4, which corresponds to the middle of a broad domain of H3K27me3 and PRC2 occupancy loss upon HOTAIR depletion [299]. Unbiased analyses of HOTAIR occupied genes revealed enrichment for genes involved in pattern specification processes (p = 8.7 × 10⁻⁷), consistent with prior data that HOTAIR enforces the epigenomic state of distal and posterior positional identity [296, 299]. Analysis of HOTAIR binding sites revealed enrichment of a GA-rich polypurine motif and recent studies of mammalian Polycomb Response Elements (PREs) also identified GA-repeats as a shared feature [299–301].
NEAT1
NEAT1 (Neat1 in mouse) is a 3.7 kb, stable, and abundant nuclear-retained polyadenylated lncRNA transcribed from a gene located on chromosome 11q13.1 [302–304]. It is present in paraspeckles, which are nonmembranous nuclear organelles responsible for retention of adenosine-to-inosine edited mRNAs [186, 303, 305]. Tumor hypoxia has been shown to induce nuclear paraspeckle formation through transcriptional activation of NEAT1 leading to cancer cell survival [306]. Transcription of NEAT1 leads to recruitment of four proteins required for formation of functional paraspeckles at the site of lncRNA transcription [304]. Continuous transcription of NEAT1 is required for maintenance of the paraspeckle and disassembly of paraspeckles occurs if transcription of the lncRNA is interrupted even though the level of NEAT1 does not change [304]. Paraspeckle creation can also be induced by artificially tethering the NEAT1 lncRNA to DNA [303]. NEAT1 shows that lncRNA may by its presence “seed” the creation of a physical and functional domain within the nucleus, that the latter occurs at the site of NEAT1 transcription and that the domain exists only so long as the lncRNA is actively transcribed.
XIST
The interphase inactivated X chromosome reflects a facultative heterochromatin domain which contains chromatin changes including chromatin compaction, methylation of CpG islands of housekeeping genes, replication occurring late in S phase, histone H4 hypoacetylation, enrichment of histone macroH2A1 a histone H2A variant with a large nonhistone domain, and histone H3K27me3 enrichment ([307] and references therein [308]). In female mammalian cells which inherit two X chromosomes, one chromosome is inactivated in order to achieve balanced expression of X-linked genes with corresponding male cells [309, 310]. X chromosome inactivation (XCI) therefore provides one model for the formation of heterochromatin from euchromatin and in the mouse embryonic stem (ES) cell system takes place over approximately 7 days following initiation of differentiation [309, 311]. XCI has been shown to be dependent on expression of the long noncoding RNA, XIST, which is located on the X chromosome that will be inactivated (Xi) [312, 313]. XIST RNA expression or loss of expression is believed to play a role in cancer development as described later in this section [314, 315]. XIST is transcribed from the X inactivation center (XIC) [316] on the proximal long arm of the X chromosome at Xq12-q13 [317]. The XIST gene is the only gene expressed solely from the inactivated X chromosome in female cells [318]. Control of XIST gene expression is complex and relies in part on the transcription of another long noncoding RNA Tsix which is transcribed in the antisense orientation to Xist and represses Xist transcription [309, 310]. As Tsix and Xist are antisense and therefore complementary to each other it has been proposed that they form a double stranded RNA which is processed in a Dicer dependent manner into an siRNA that is involved in regulation of Xist expression and Xi (inactive X) gene inactivation [319]. In addition to Tsix, reference was made earlier to the role of the Xist repressive transcription factor ZFP42 (REX1) which during differentiation is degraded through the action of the X-linked gene RLIM (RNF12) facilitating the up-regulation of Xist on Xi (see section “Regulation of Gene Expression of Long Noncoding RNAs”). Transcription of Xist results in a “cloud” of Xist transcript that are distributed in 2- and 3-dimensional space within the nucleus coincident with the inactivate X chromosome or Barr body [320]. In 3D analysis and reconstruction of the Xist RNA domain and inactivated X-chromosome volume, the Xist RNA domain was found to covers ~70 % of the Xi-chromosome territory [321]. Because of the topological overlap of these two domains, the XIST RNA is said to “paint” the inactive X chromosome (Xi) at interphase [320]. Using FISH Xist transcripts are seen to initially accumulate at the site of transcription at the X inactivation center and then to progressively envelop the Xi. Accumulation of Xist on Xi is dependent on the protein HNRNPU (heterogeneous nuclear ribonucleoprotein U) and its RNA and DNA binding properties [322, 323].
In the mouse embryo system the first changes that are observed with FISH within in the Xist (XIST in humans) RNA domain of Xi are depletion of RNA polymerase II and associated transcription factors [321]. X-linked genes that will subsequently be repressed in the fully inactivated Xi can be identified outside and at the edge of the Xist (XIST in humans) RNA domain on day one but become reduced in number and transferred into the interior of the Xist RNA domain at 24–48 h after initiation [321]. Transcriptional silencing requires a repeat motif termed the A-repeat domain located in the 5′-end of Xist (XIST in humans) [324] which Zhao et al. demonstrated directly binds PRC2 [286]. XIST (Xist in mouse) transcription is essential for initiation of silencing, but maintenance of X-linked gene repression on the Xi at later stages of cellular differentiation appears to rely on other epigenetic mechanisms including DNA methylation and histone modifications particularly formation of H3K27me3 [307, 325, 326]. Histone modifications and DNA methylation occur with the recruitment of chromatin modifying complexes including PcG proteins PRC2 and PRC1 [327, 328]. Moreover, Xist involvement in gene silencing is not limited to its interactions with PRC2 [308]. Other chromatin modifying complexes are also involved including Structural Maintenance of Chromosomes Hinge Domain-containing protein 1 (SMCHD1) which like PRC2 appears to require Xist transcription to accumulate on Xi and which associates with another histone mark of heterochromatin H3K9me3 and is essential for Xi compaction [329].
Techniques that capture 3D chromatin conformation (RAP and CHART) show that during initiation of XCI, Xist moves from its transcription locus at XIC to distal sites across the X-chromosome that are defined by their spatial proximity in the nucleus to the Xist transcription locus [294]. Xist initially localizes to the periphery of actively transcribed regions [294, 330] thus confirming earlier FISH studies, but gradually spreads across the transcribed regions through a mechanism dependent on the A-repeat domain. Thus Xist initially localizes to distal sites across the chromosome by exploiting chromatin proximity arising out of Xi chromosome conformation.
Continued transcription of Xist RNA and its persistent association with the inactivate X chromosome throughout the lifetime of the female suggests a continuing requirement for Xist in somatic cells [320] but while several studies have pointed to a reduced stability of silencing of X-linked genes on Xi when Xist expression is reduced or absent [331, 332] other studies have shown X inactivation to be independent of Xist expression in differentiated cells [325, 326]. However, recent studies have uncovered stochastic single-gene reactivation and a loss of Polycomb repression when Xist is conditionally deleted in mouse fibroblasts [333]. Moreover, while the preceding studies have all been conducted with model systems in tissue culture, supernumerary X chromosomes have long been associated with human cancers as for example in the case of breast and ovarian cancers which frequently lose the Xi and duplicate the active X, and in the case of XXY men which have a 20- to 50-fold increased risk of breast cancer [314, 315]. In a 2 year in vivo study in mice the Xist gene was conditionally deleted from one X chromosome in the blood compartment after day 10.5 at which time Xi inactivation has been established [315]. Assuming that persisting Xist (XIST in humans) expression was not required for subsequent normal cellular development one would expect to see no difference in the frequency of development of disease in mutant mice that had lost Xist expression than in normal mice in which Xist expression persisted. However, mutant females develop a highly aggressive myeloproliferative neoplasm and myelodysplastic syndrome (mixed MPN/MDS) with 100 % penetrance. This lead the investigators to propose that Xist loss results in Xi reactivation and consequent genome wide changes that lead to cancer, thereby causally linking the X chromosome to hematopoietic cancer development in mice [315].
Related posts:

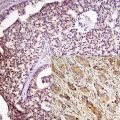
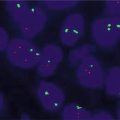
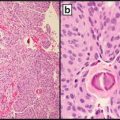
Stay updated, free articles. Join our Telegram channel

Full access? Get Clinical Tree


