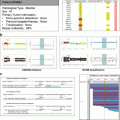
Fig. 4.1
G band ideograms of human chromosome 11 at (from left to right) 350, 550, and 850 band resolution (From Bickmore 2001)
The karyotyping analysis, tool for cytogenetics, was useful for human genetic research (i.e., species evolutionary mitosis and meiotic processes etc.) and in medicine to associate genomic disorders to clinics (translocation, leukemia; gains, Huntington disease, trisomy 21 in Down syndrome; sex chromosomal aberrations, Turner syndrome; etc.). Interestingly, such techniques open new area of research such as DNA replication, and gene dosage theories appeared to be linked to chromosome copy numbers. In 1961, Mary Lyon proposed that X chromosome compaction was related to the random inactivation of one female X chromosome.
Main biochemical discoveries made in 1950s such as the understanding of the DNA composition specificity (A, T, C, and G) demonstrated by E. Chargaff, the characterization of the DNA structure made by J. Watson and F. Crick in 1953, and the genetic code leading to a specific protein synthesis done by M. Nirenberg in 1963 solved basic issues in biology. In 1977, a rapid sequencing approach was described by F. Sanger using labeled and degenerated nucleotides (dideoxynucleotide) to synthesize a new DNA strand that migrates into an acrylamide gel according to their size, upon an electric field (electrophoresis). In 1983, a reaction called polymerase chain reaction (PCR) was set up by K. Mullis to amplify a portion of a genome producing billion copies of a target in 4 hours.
Those two techniques were very helpful to imagine in 1985 the sequencing of the human genome and launch the international programs such as the Human Genome Project, which began in 1990 in the USA, the UK, France, Germany, Japan (NIH, Welcome Trust Sanger Center, etc.). In the summer 2000, a public consortia and a private company (Celera, headed by Craig Venter) proposed a first draft of the human genome, revealing that 95 % of the genome was sequenced and also that two human genomes are 99.5 % identical and contain ~30,000 genes in a ~3 Gb. This was possible using cloning methods inserting long genomic fragments (~200,000 bp) into bacteria to create libraries, followed by sub-libraries containing smaller pieces of DNA (1000–2000 bp), which were used for sequencing and mapping.
In the other hand, the HapMap Project (International HapMap Consortium 2003, Japan, the UK, Canada, China, Nigeria, and the USA) analyzes thousands of genomes to identify sequence variants across multiple populations (Asian, African, Europe, etc.) that would affect common or specific disease. As ten millions of single nucleotide polymorphisms (SNPs) may occur in the human genome, the way to analyze SNP consists to genotype each allele. The analysis of SNP shared by several DNA was useful to identify common region, inherited, for example, in order to reduce the number of interesting SNP into haplotypes. The map of haplotypes was predicted to contain SNP present in 90 % of population, and they were evaluated by sequencing the targeted SNP (in the HapMap programs). Several tools were designed to analyze thousands of SNPs, randomly speared among the genome or not. The interest in such study is to perform linkage study that facilitates the understanding of a specific disease mutation. It is interesting to know if a specific population is affected or not by a mutation and if it is due to a specific haplotype or SNP. This information could be also taken into account to adjust treatment or avoid side effects (e.g., metabolism of a drug).
4.2 Fluorescence In Situ Hybridization Techniques
In order to analyze more precisely the number of chromosomes and their content, in situ hybridization techniques were developed on metaphases or on fixed tissue sections, to hybridize onto nucleic acids, single-strand DNA or RNA molecules coupled to a radioactive, and fluorescent probe or non-fluorescent probes (i.e., biotin). In the late 1960s, rough first protocols were set up to identify, for example, the localization of amplified ribosomal genes in Xenopus oocytes, by the use of purified and radioactive ribosomal RNA in 1969 (John et al. 1969; Gall and Pardue 1969; Langer-Safer et al. 1982). From the 1980s till date, hundreds of publications describe easier methods to prepare probes by genetic engineering coupled to specific fluorescent probes in order to detect loci copy numbers (Volpi and Bridger 2008). Most of the probes used for fluorescent in situ hybridization (FISH) approaches today were generated in the Human Genome Project.
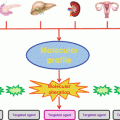
Depending on the aim of the FISH, the probes used can be short (10–25 nt) to detect messenger RNA or microRNA, for example, or longer to detect repetitive sequences near centromeres such as satellite DNA, telomeres, or other sequences of interest. Multiprobes can be applied for translocation assessments or for the quantification of repetitive elements or transposons (Singer 1982; Weiner 2002) such as SINE (Short Interspersed Nuclear Elements) or LINE (Long Interspersed Nuclear elements). Furthermore, multicolor FISH techniques were used to perform chromosome painting (Ried et al. 1998, Fig. 4.2), in order to monitor rearrangement in long genes such as large rearrangements of BRCA1 or BRCA2 in breast and ovarian cancers (Gad et al. 2001, 2002).
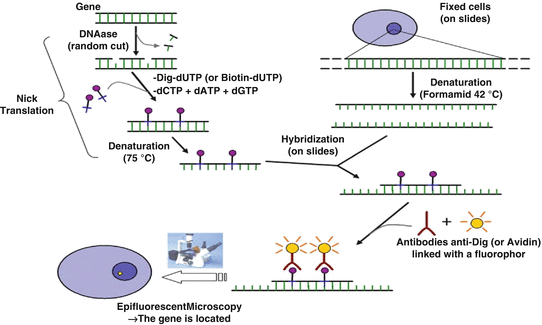

Fig. 4.2
Principle of fluorescent in situ hybridization (FISH)
In breast cancers, human epidermal growth factor receptor 2 (Her2) is quantified in routine on fixed tissues. The receptor is detected using dedicated antibodies to perform immunochemistry (IHC). When the IHC results are equivocal, the FISH technique is used to confirm the Her2 status. Specific probes for Her2 hybridize a 190 kb region (17q11.2-q12) including the Her2 gene (i.e., PathVysion Her2 Kit, FDA approved, Abbott Molecular). Furthermore, in order to take into account polysomy, another probe located in the centromere of chromosome 17 is also hybridized on centromeric alpha satellite sequences (CEP17 (Waye and Willard 1986)). This second probe is labeled with a different fluorescent probe. Almost 20 metaphases should be analyzed to quantify the number of Her2 and CEP17 genomic copies. Depending on the number of Her2 copy number (>2, ≥4, >6) and depending on the Her2/Cep17 ratio (<2), the result will indicate positive or negative status and may orient patient into Her2-targeted therapies (http://www.asco.org/guidelines/her2).
4.3 Comparative Genomic Hybridization
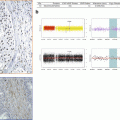
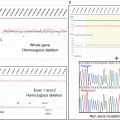
Comparative genomic hybridization (CGH) appeared in 1992 (Kallioniemi et al. 1992) to improve resolution of karyotyping and FISH techniques. CGH technique allows to gain in resolution of karyotypes as compared to Giemsa banding to enlarge the number of analyzed targets as compared to the FISH technique. CGH techniques identify more precisely genomic aberrations such as losses, deletions, gains, amplification, and certain translocation. To perform a CGH, high-quality normal metaphase spreads needed to be spread on a glass slide from normal cells (Fig. 4.3). Next two different labeled DNAs are hybridized on the slide under specific conditions (Weiss et al. 1999) to avoid nonspecific hybridization of DNA onto repetitive sequences (addition of human Cot1) and background noise. In fact, tumor DNA needs to be extracted and biotinylated, and a normal genomic DNA needs to be extracted and digoxigenin labeled, separately. After a competitive hybridization of 1 μg of DNA, tumor DNA is detected using avidin coupled to FITC (Fluorescein IsoThioCyanate), and normal DNA is detected using red-fluorescent rhodamine antidigoxigenin molecules. The sex of the patient is required for this kind of experiment in order to choose the best DNA controls to adjust X and Y for signal normalization of sex chromosomes. Depending on the ratio measurement, copy number aberrations could be identified by this method. Ratio of measurement represents: (1) normal DNA copy numbers when identical signals are quantified in green and red; (2) DNA deletions when higher signals are measures in red; and (3) DNA duplications or amplifications when signals are measured in green. CGH analysis has its limitations when it comes to balanced translocations (i.e., Ewing tumors), inversions, ring chromosomes etc. Limitations also include the sensitivity of CGH detection. Detection of small deletions is not easy and the interpretation of gains could be also difficult in specific ploidy (i.e., sarcomas, breast tumors, etc.) requiring specific bioinformatics tools.
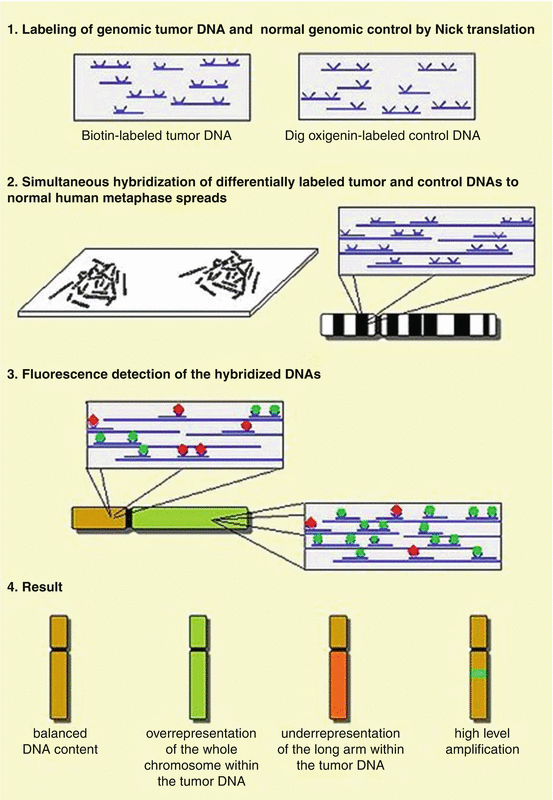

Fig. 4.3
Principle of comparative genomic hybridization (CGH)
In this context, the CGH technique was rapidly improved with the use of artificial chromosome such as BAC (bacterial artificial chromosome) (Pinkel et al. 1998), which is widely used in the Human Genome Project. Other preparations such as (Kallioniemi et al. 1994) yeast artificial chromosome (YAC), plasmid artificial chromosome (PAC), and PCR products were also used as templates for the competitive hybridization of molecules. Preparations of artificial chromosomes or PCR amplicons were controlled by sequencing before their deposition onto glass slide. Many efforts from public and private labs were engaged to set up protocols in order to improve the array designs and production of array. Principle of comparative hybridization of labeled molecules was reused to obtain the ratio of tumor DNA copy number relative to normal DNA copy number. Tumor and normal DNAs were separately fragmented using ultrasounds and coupled to specific fluorophores such as cyanine 3 or cyanine 5 (orange and red probes) before competitive hybridization.
CGH array was an evolution of CGH and facilitated high-throughput analysis of dozen of tumors, because of the use of commercial or custom-spotted glass slides (Davies et al. 2005). CGH arrays are designed with long oligonucleotides (i.e., 60mers on Agilent technologies arrays, NimbleGen arrays) to hybridize labeled DNA. The resolution was improved to 40 kb instead of 5–10 Mb with CGH (Forozan et al. 1997), but resolution varied a lot depending on the needs. For example, Garnis et al. designed a high-content CGH arrays (Garnis et al. 2004a, b, c that quantify DNA copy number changes within a 52 Mb region of 8q21–24 to define breakpoint and limits of amplicons near MYC oncogene in oral dysplasia and cancer squamous cell carcinomas. Results highlighted differences in minimal altered regions, but results also confirm the need of high-content CGH array to improve accuracy on breakpoints and DNA copy number changes. The same observation was confirmed on breast tumor by Pollack et al. (2002) and on other tumor types. At this period, the Agilent Company developed genome-wide CGH arrays to analyze human genome using 60mer oligonucleotides and synthesize directly using inkjet technologies, instead of spotting BAC or PCR products.
During the development of CGH arrays, developments were also conducted on softwares to manage the intensities and algorithms to emphasize the information highlighted from complex tumors such as breast tumors.
4.4 Single Nucleotide Polymorphisms’ Arrays
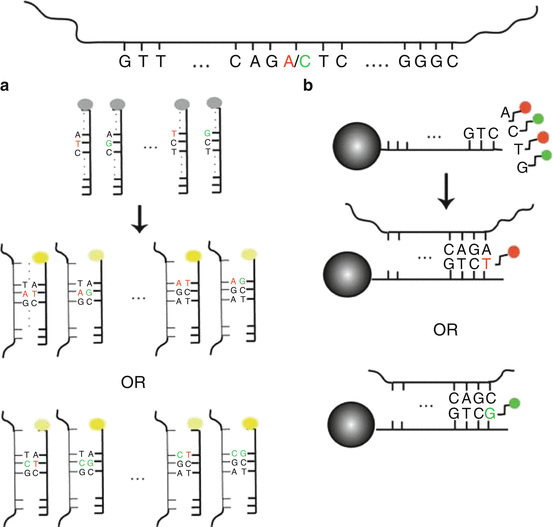
In parallel to CGH developments, microarrays interrogating single nucleotide polymorphism (SNP arrays) have been designed to perform high-throughput genotyping and linkage study. Affymetrix and Illumina set up two different tools to interrogate SNPs (Affymetrix mapping assays, Illumina bead array). In both tools, two alleles of selected SNP were measured using a set of probes (Affymetrix) or a single probe (Illumina) for each SNP. Fig. 4.4 extracted from T La Framboise (2009) illustrates the two different approaches that allow genotyping and DNA copy number calculations based on sequence interrogation.
Affymetrix was the first company to propose SNP arrays to characterize 12,000 SNP arrays in 1999 and to define genotypes (AA, AB, and BB), using 25mers probes. To reduce genome complexity, Affymetrix protocols were based on a first enzymatic digestion (i.e., HindIII, Xba), followed by a ligation of generic adaptors used next to PCR amplified amplicons of 100–1200 nt. Depending on the SNP assay, DNAs were next fragmented using DNAse I or using UDG/APEI complex if dUTP is incorporated in the cDNA synthesis. Fragments are next biotinylated using a specific DNA polymerase: terminal deoxynucleotidyl transferase (TdT) that binds a biotinylated nucleotide at the 3′ extremity of the fragment. Those labeled molecules, corresponding to targets, are next prepared to hybridize arrays. With the improvement of technical properties of microarrays (size of features from 11 to 5 μm, scanner upgrade), the SNP array content has been amplified to 500 k. In 2007, Affymetrix has implemented non-polymorphic probes (CNV, for copy number variant) in order to improve calculation and DNA copy numbers in particular. Affymetrix SNP6.0 or CytoScan HD probes are actually interrogating ~2 M markers (900kSNP and 900 k CNV in SNP6.0 array and 743 k NSP and 1.953 M CNV for CytoScan array). The improvement in terms of molecular biology consists of reduction of number of steps (one enzyme used in CytoScan instead of two for SNP6.0, 250 ng vs 500 ng as input; less PCR in CytoScan protocol). Other improvements concerned normalization steps to take into account mismatches and/or multiple probes to quantify each SNP, to assign genotypes and DNA copy numbers (i.e., BRLMM, Birdseed).
Detection of genotypes using Illumina procedures requires small amount of genomic DNA (200–400 ng) to detect specific fragments that contains SNP of interest by the mean of bead arrays (50mer probes) and dedicated protocols (GoldenGate assay, to detect between 48 and 1536 SNPs; Infinium Assay, to detect between 3072 and 1 million SNPs).
Stay updated, free articles. Join our Telegram channel

Full access? Get Clinical Tree


