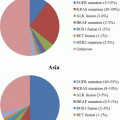
Fig. 4.1
Specimens used for the EGFR mutation test in Japan. The sample categories summarized from ~17,000 samples submitted to one of the laboratories in 2009 [38]. Tissue samples (i.e., FFPE and frozen tissue) are indicated in warm colors, while cytological samples (i.e., bronchoscopy specimens and pleural effusion) are indicated in cold colors
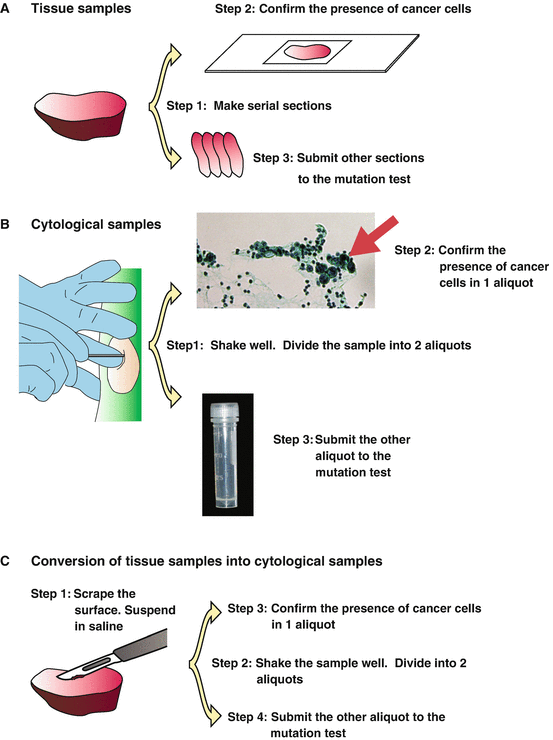
Fig. 4.2
Sample preparation procedures. (a) Tissue samples. Step 1: Serial sectioning. Step 2: The presence of cancer cells is confirmed in 1 section. Step 3: The EGFR mutation is investigated using other sections. Macro-dissection may be required to remove normal tissue before step 1. (b) Cytological samples. Step 1: Suspend the cells in saline. Divide the samples into 2 aliquots. Step 2: Confirm the presence of cancer cells in 1 aliquot. Step 3: Investigate the EGFR mutation using the other aliquot. (c) Preparation of cytological samples from tissue. Step 1: Scrape the surface of the tissue. Suspend the cells in saline. Step 2: Divide the samples into 2 aliquots. Step 3: Confirm the presence of cancer cells in 1 aliquot. Step 4: Investigate the EGFR mutation using the other aliquot
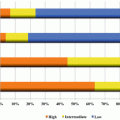
Clinical samples contain both normal cells and cancer cells. Currently, pathological examination is the only way that is able to diagnose cancer. Then, how much is cancer cell content in pathologically cancer-positive samples? Figure 4.3a shows our result, suggesting that the cancer cell content in the cancer specimens are usually >1 % [23]. This indicates that the methods that are able to test samples with cancer cell content of 1 % is adequate for testing clinical samples [24].
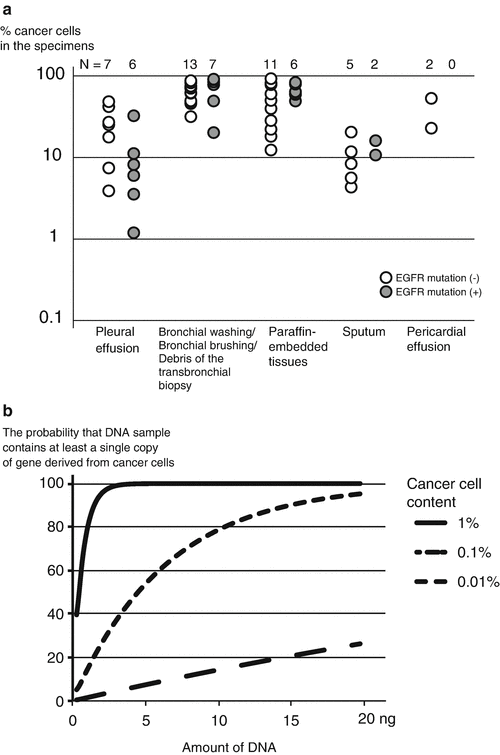

Fig. 4.3
Cancer cell content and the required amount of DNA. (a) The number of cancer cells and normal cells was counted in the microscopic slides randomly selected from those used for establishing the diagnosis of cancer. (b) The required amount of DNA. The probability that DNA sample contains at least a single copy of gene derived from cancer cells. When the cancer cell content is small, a huge amount of DNA is required to avoid false-negative result due to a sampling error
The amount of DNA is very important for properly performing mutation test. In the test that identify mutations in a single-copy gene such as EGFR, the requirement for testing samples with a 1 % cancer cell content automatically determines the required amount of DNA. A single cell contains about 6.4 pg of genomic DNA. For detecting mutation occurring in 1 % of the cells, 640 pg of genomic DNA is required by a simple calculation. In actuality, the number of the cells sampled conforms to the binomial distribution, and thus more DNA is required (Fig. 4.3b). Two to 10 ng of DNA is recommended when testing samples with 1 % cancer cell content. If lesser amount of DNA is used, false-negative results may occur [22].
Formalin-fixed, paraffin-embedded (FFPE) tissue, snap-frozen tissue, and cytological samples are the types of samples most frequently used in the molecular diagnosis, and each has advantages and disadvantages. FFPE samples provide clear histological data and are best for fluorescent in situ hybridization (FISH) and immunohistological examination (IHC). However, FFPE samples are not the best for the examination of DNA and RNA. Procedures employed for fixation and embedding significantly degrade both DNA and RNA. DNA is often modified, providing artificially mutated sequences. RNA is usually severely damaged [25–28]. Snap-frozen tissue well preserves both DNA and RNA and allow histological examination. Although the quality of morphological information is not as good as that obtained from FFPE samples, they allow high-quality molecular biological analyses. Cytological samples do not provide information on the tissue architecture. However, DNA and RNA are well preserved in good quality, especially when cells are collected and stored in a preservative solution (e.g., RNAlater Solutions, ThermoFisher Scientific Inc.) just after sample isolation. The most prominent advantage of the cytological samples is that they can be isolated from almost all patients. It is therefore very important to utilize cytological samples for the molecular diagnosis for all patients benefit from molecular targeting drugs [22].
Cell-free DNA (cfDNA) is a source of DNA recently attracted much attention [29, 30]. It has been shown that the amount of DNA that is released from cancer cells into bloodstream is enough to allow molecular biological analyses in some patients with an advanced disease. DNA is isolated from plasma or urine. The problem is that, when mutation is not found, it is not easy to know whether cancer does not have mutation being investigated or the amount of DNA from cancer cell is not enough. Therefore, the interpretation of the result of a DNA test using cfDNA should be cautiously done, when a negative result is obtained.
4.5 Methods
The optimal methods for the molecular testing differ depending on the type of samples (tissue or cytological samples) and on the type of materials (DNA, RNA or protein). Most of the methods that are used for examining DNA or RNA at the nucleotide level utilize the polymerase chain reaction (PCR) or reverse-transcriptase polymerase chain reaction (RT-PCR). Gross changes of the chromosome structure are detected by the fluorescent in situ hybridization (FISH). The localization of a specific protein in the tissue is detected by the immunohistochemistry (IHC). Currently, the EGFR, KRAS, or BRAF mutations are detected by the PCR-based technique, while the presence of the ALK-, ROS1-, or RET-fusion genes is detected by RT-PCR or FISH [4]. The ALK-fusion genes are also detected by the IHC [31].
4.5.1 PCR-Based Methods
DNA is very stable and easy to isolate. Therefore, a DNA-based test is easy to perform. Many of the PCR-based methods amplify the mutation hotspots by PCR. Then the presence of mutated sequence is investigated by nucleotide sequencing or by a fluorescence-based technique like the TaqMan assay [32]. The methods include scorpion ARMS [33], the PNA-LNA clamp [34], the cycleave PCR [35], the PCR-invader [36], and the cobas EGFR mutation test [37]. The former four methods have confirmed to detect mutations from samples with a cancer cell content of 1 % [25], while the latter is able to detect from samples with 5 % cancer cells according to the package insert.
The most prominent characteristics of these methods are the implementation of special techniques that increase sensitivity, because the mutant sequences should be detected in the presence of large amount of backgrounds. For example, if the cancer cell content is 1 %, the wild-type EGFR sequence exists 200-fold more over the mutant EGFR sequence. Figure 4.4 illustrates how the PNA-LNA PCR clamp method [34] increase the sensitivity, which enables to detect mutant sequences from almost all clinical samples that are pathologically positive for cancer cells.
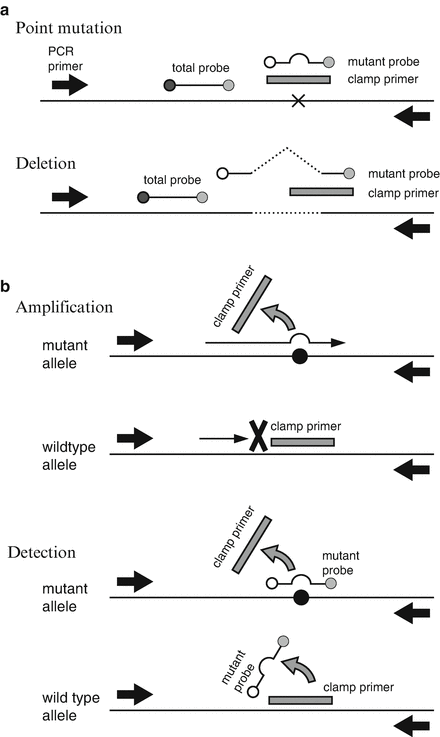

Fig. 4.4
PNA-LNA PCR clamp system [34]. (a) Primer and probes positions. Point mutation: Both the clamp primer and the mutant probe are located on the mutation site. The “total probe” to detect both mutant and wild-type fragments is on the adjoining sequence. X indicates the mutation. Deletion: The clamp primer partly covers the deletion. Sequences located on both sides of the deletion are joined to make the sequence of the mutation probe. A dashed line indicates a deletion. Black arrows are the PCR primers. (b) Schematic presentation of the reaction to detect point mutations. In the amplification process, the clamp primers fail to bind to the mutation sequences but binds to the wild type, resulting in the preferential amplification of mutant sequences. In the detection process, the mutant probes bind to the mutant sequences but fail to bind to the wild type partly because of mismatches and partly because of the competitive displacement by the clamp primers. The signals are detected by the 5′ nuclease assay. A black circle indicates a mutation
A weak point common to most of the PCR-based methods is that they are able to test only a limited number of locations on the genome. Therefore, PCR-based methods are not applicable when locations of mutations disperse in a wide range on a genome. A representative example is the EML4–ALK-fusion gene. The breakpoint that is the junction of the EML4 gene and the ALK gene is not fixed and is found in a wide range in the introns. Therefore, it is hard to identify the presence of the EML4–ALK-fusion gene by identifying the breakpoint sequence. Accordingly, the EML4–ALK-fusion gene is identified directly using RT-PCR or indirectly using FISH or IHC.
4.5.2 RT-PCR-Based Methods
RNA is very labile and is easily degraded. Therefore, when handling RNA, a special precaution should be made. Moreover, RNA is not directly amplified by the DNA polymerases. It should be converted to DNA (complementary DNA: cDNA) by the reverse transcriptase (RT) and then amplified by PCR. The set of reactions is collectively called as RT-PCR. The mRNA of a fusion gene is a hybrid having the 5′ side of one gene and the 3′ side of the other gene. If a DNA fragment is amplified by RT-PCR using the primers specific for each side, it indicates that a fusion gene is present. Therefore, RT-PCR is the method of choice when good quality of RNA is available, as isolated from snap-frozen tissue or cytological sample immediately stored in a RNA preservation solution.
4.5.3 Next-Generation Sequencing (NGS)
NGS is capable of determining nucleotide sequence from millions of nucleotide fragments simultaneously. Therefore, using NGS is an attractive approach for simultaneously testing multiple genes from multiple samples, and the tests using the NGS is actively developed. The challenges are that the NGS were originally developed for determining a huge number of DNA fragments at the cost of correctness. Meanwhile, the mutation tests require correctness because the results are used in clinical practice. The NGS often misread normal sequence as mutant sequence, which causes serious consequences in the clinical practice. Procedures that reduce the false reading are vital for the development of NGS-based tests. Germ-line polymorphisms such as single nucleotide polymorphisms (SNPs) are not hard to detect. However, somatic mutations as found in the clinical samples with a cancer cell content of 1 % are not easy to correctly identify. Moreover, the turnaround time from sample submission to the report of the result takes weeks for NGS-based tests, while it should be less than a week for utilizing the result in clinical practice. More efforts are required for overcoming these problems in NGS.
4.5.4 Utilization of Liquid Biopsy Samples
Recently it has been reported that DNA fragments from cancer cells may shed into the bloodstream and can be isolated from serum or urine (cell-free DNA: cfDNA). Genetic mutations in cancer cells may be detected using cfDNA. Because the ratio of cancer cell-derived cfDNA to normal cell-derived DNA (endothelial cells, leukocytes, etc.) is hard to know, detection of mutation from cfDNA is performed using very sensitive methods. Therefore, the methods employed are digital PCR or highly sensitive PNA-LNA PCR clamp, which may detect mutations from samples of which cancer cell content is less than 1 %. However, when the cancer-derived cfDNA occupies less than 0.1 % of DNA detection is almost impossible, because the mount of input DNA automatically determines the limit of the detection (Fig. 4.5). Furthermore, use of more than 10 ng DNA is difficult, because the yield of cfDNA is not large. When the cancer-derived cfDNA occupies from 0.1 to 1 %, the effect of DNA polymerase error becomes evident. DNA polymerase sometimes misincorporates nucleotides during PCR. This produces mutant sequence from normal sequence, and normal DNA is misinterpreted as mutant DNA. When the ratio is more than 1 %, the mutation test itself is not difficult. The use of cfDNA is a very attractive approach, and if appropriately used, it enables to decide treatment without performing biopsy.
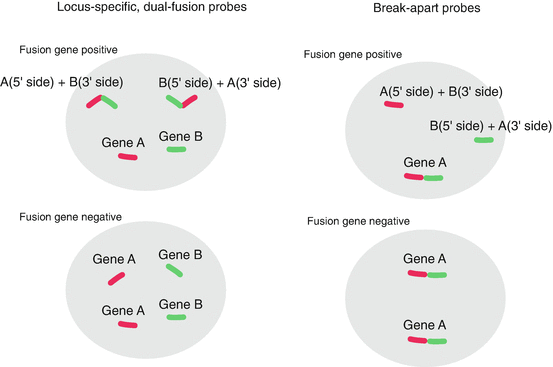

Fig. 4.5
FISH. (a) The test using the locus-specific, dual-fusion probes. Color probes are located on different genes, such as the EML4 gene and the ALK gene. When these 2 genes form a fusion gene, both colors are observed at the same position. (b) The test using the break-apart probes. Color probes are located on the 5′ side and the 3′ side of a single gene. When one gene forms a fusion gene with the a fusion partner gene, two colors are separately observed
4.5.5 FISH (Fluorescent In Situ Hybridization)
FISH has been used in the test of hematological malignancies, in which chromosomal translocations or deletions are commonly found. Moreover, the ALK gene is one of the genes frequently found at the breakpoint of a chromosomal rearrangement and forms a fusion gene. As a result, FISH test for the ALK-fusion genes had already been established in the field of hematology when the EML4–ALK-fusion gene was found in lung cancer, and thus the test was directly applied to it.
There are two different FISH tests: tests using the locus-specific, dual-fusion probes and test using the break-apart probes (Fig. 4.5). For detecting ALK-fusion genes, ROS1-fusion genes, and RET-fusion genes, test using the break-apart probes is employed [4]. The test using break-apart probes is applicable to a gene that has multiple fusion partners. The weak points of FISH are that the procedure is complicated and the interpretation of the result under microscope is often difficult.
Stay updated, free articles. Join our Telegram channel

Full access? Get Clinical Tree


