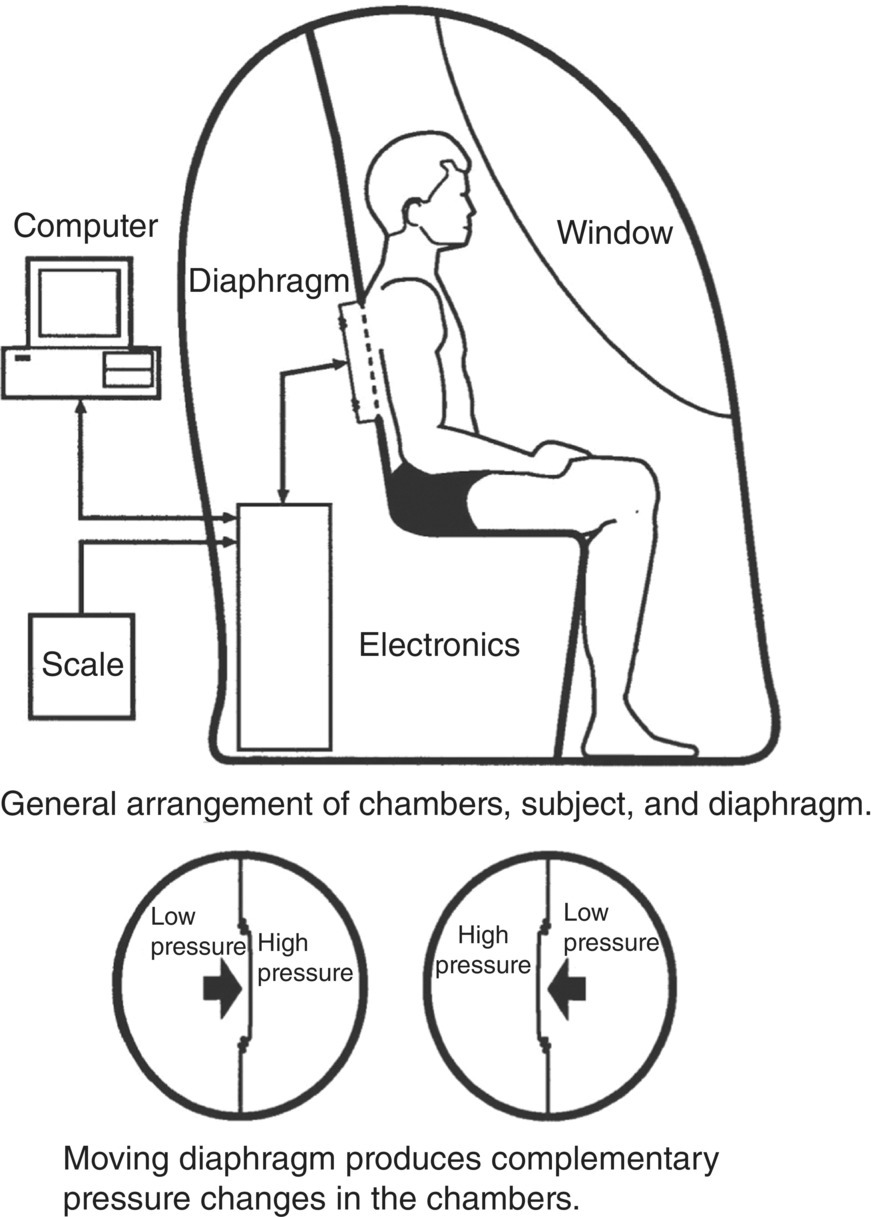
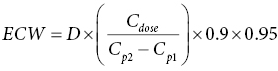
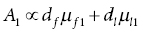
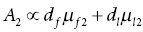
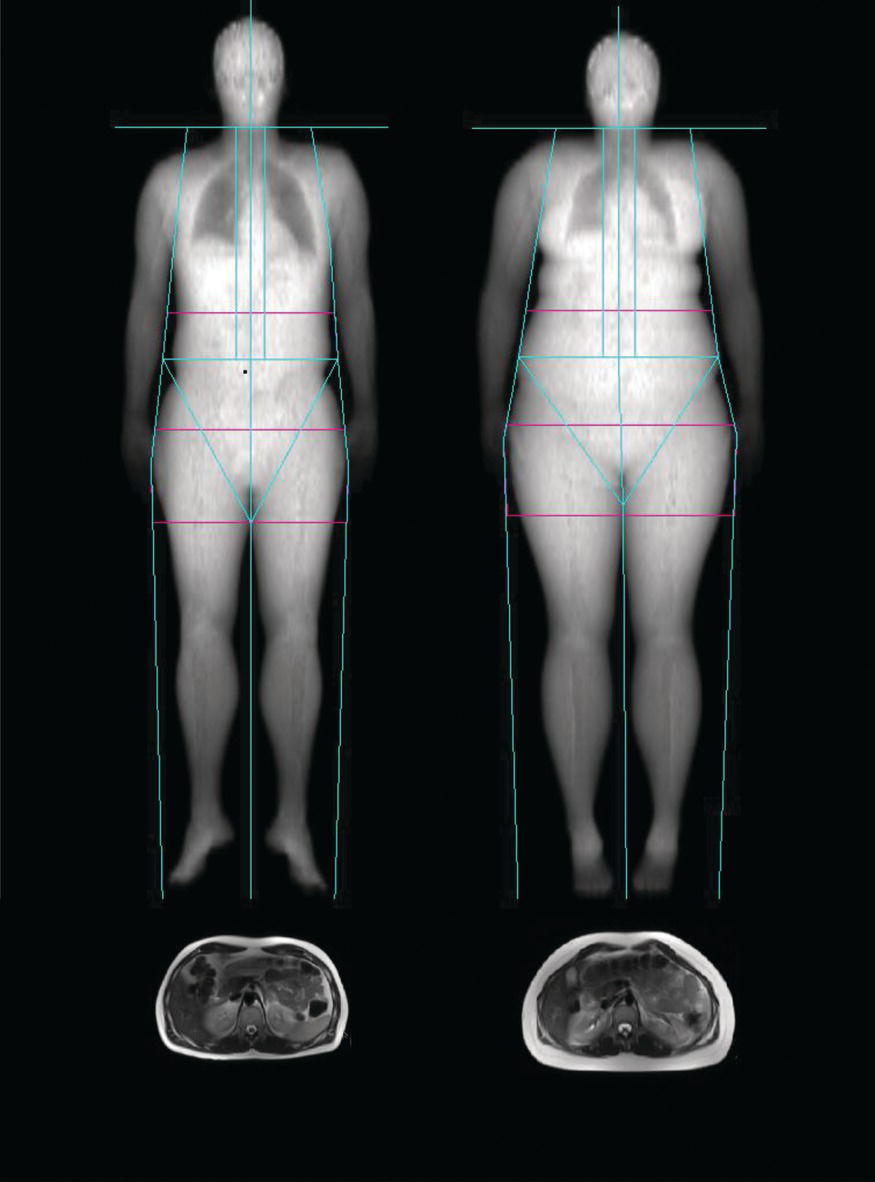
11 Peter Murgatroyd,1 Les Bluck2 and Laura Watson1 1 NIHR/Wellcome Trust Clinical Research Facility 2 MRC Human Nutrition Research This chapter aims to explore a range of techniques for the assessment of body composition. The concept of body composition in terms of compartments such as fat and lean will be developed. The chapter will then cover the basic anthropometric measurements, height, mass and body volume, on which many of the subsequent methodologies depend. The first compartmental measure discussed will be total body water, which may be subdivided into its intra- and extra-cellular components. Dual energy x-ray absorptiometry is a precise method for fat, lean and bone quantification, and offers both whole-body and regional analyses. The bone measurement contributes, with height, mass and volume, to multicomponent models that describe the compartmental masses. Magnetic resonance, a very versatile technique, and computed tomography will then be discussed. Next we will look at some lower-technology measurements that may contribute to an understanding of nutritional status and to lower-precision representation of body composition. These will include muscle mass and strength, anthropometric approaches, ultrasound and bio-electrical impedance analysis. The merits and shortcomings of these approaches will be discussed, with consideration given to those that may be valuable for measurement in individuals and those that may be more appropriate in larger cohort research. Finally, consideration will be given to placing an individual’s measurement in the context of reference data. The term body composition may be used to describe the body from a chemical perspective, in terms of elements, molecules and compounds, from a tissue and organ perspective, or in terms of compartments defined by their physical characteristics and functions. While there is some overlap between these descriptive approaches, the most widely applied methodologies discriminate between fat, lean, bone mineral and fluid spaces. From a nutritional perspective these compartments arguably hold most interest. Fat, for example, is the primary energy store and may be found in excess, as in obesity, or may be depleted, as in anorexia or malnutrition. Bone mass may be compromised by deficiencies in calcium or vitamin D. In a broader context, body composition measurements can be characteristic of clinical disorders and contribute to the description of phenotypes. The balance between fat and lean compartments may be atypical, as in some thyroid hormone disorders. Fat storage may be compromised, as in disorders such as severe insulin resistance and in lipodystrophy. A notable, nutritionally important omission from the list of primary compartments is glycogen, which may be stored in liver and muscle. Its diffuse distribution makes it challenging to quantify in mass terms, although its flux can be estimated, as we shall see. Some measurement methodologies do not separate all the compartments, but may combine lean with water as lean body mass (LBM), or combine all but fat into a single compartment, referred to as fat-free mass (FFM). These combinations reduce the number of discrete compartments to three or two respectively. Though measurements of total body composition may be valuable, insight into regional distribution may be more so, in some instances in the context of a specific tissue or organ such as liver or skeletal muscle. Water, for example, may be partitioned into intra- and extra-cellular spaces; fat may be subcompartmented into depots such as subcutaneous, intra-muscular, intra-myocellular, visceral and hepatic and its distribution between legs, arms, trunk and so on may also be explored. Many of these subcompartments again have clinical relevance and atypical or ectopic distribution may be characteristic of a range of disorders, as for example in the fatty liver diseases. A feature of body composition measurement is the difficulty of determining the absolute accuracy of methods. The characteristics of tissue compartments such as fat and lean used in their measurement are heavily dependent on properties determined by cadaver analysis, and reported cadaver analyses are understandably rather few in number. In practice, a four-component model describing fat or lean mass in terms of body mass, body volume, total body water and bone mass is most usually taken as the criterion against which to assess the absolute accuracy of other methodologies (see Section 11.11). The limits of agreement between this and other methods are often investigated by the Bland–Altman approach, in which neither of the pair of methods being compared is assumed to be superior. Fortunately, in a nutritional or clinical context absolute accuracy is not always crucial to measurement. The predominant requirements are most commonly either to detect changes within an individual or group, or to identify differences between groups or between health and disease. Detection of changes and differences is much more dependent on the precision of methods (which may be deduced from analysis of repeated measures) than on their accuracy. In the subsequent methodological descriptions in this chapter the discussion of quality will therefore focus on precision. It may be worth mentioning here that one methodology stands out when it comes to validating approaches to quantifying changes in total body fat mass. The work of Susan Jebb and colleagues has shown that dietary manipulation over a 12-day period within a whole-body calorimeter can induce changes in composition large enough to be measurable by the better methods discussed here, it can measure these changes with high accuracy, and it can do so with a precision that is at least five times better than comparator methods. In this way the properties of underwater weighing, deuterium dilution, three-component models and skinfold measurement for detecting changes have been explored. It is perhaps regrettable that this approach has not been revisited since the introduction of dual-energy x-ray absorptiometry, air displacement plethysmography, magnetic resonance and impedance methodologies. Measurement of stature (height) forms part of anthropometric assessment and is a parameter in some body composition measurements. The measurement is best performed with a purpose-designed stadiometer, which should be checked regularly for accuracy against an independent standard. The subject should be lightly clad and should stand in bare feet with heels, back and head against the stadiometer, and eyes horizontal. Two measures should be taken, with repositioning of the subject, to confirm the reliability of the measurements, and a third taken if the first two differ by 2 cm or more. Consistency in measurements repeated on different occasions is best achieved by standardising the time of day for all repeat measures. When the difference between repeats is greater than 2 cm, there should be concern about measurement error or poor technique. Measurement of total body mass underpins most body composition measurement techniques. Technically, mass represents the quantity of matter, and is expressed in kilograms (kg). Most weighing scales measure weight through the action of gravity on mass, but are calibrated in kg mass units. Guidance notes for specifying clinical weighing scales recommend scale intervals as broad as 100 g for adults, even where mass measurement is critical to treatment, hence it is rare to find clinic scales that are better than this. For body composition investigations, particularly where changes in composition are of interest, better mass resolution may be beneficial. Masses of 300 kg may be resolved to 10 g or less by an industrial platform scale. Some scales are able to show an average reading taken over a few seconds, thus suppressing the effect of movement on the displayed reading. This is a valuable feature that may repay the additional investment through higher measurement quality. Further improvements in measurement quality can be achieved by weighing the subject in an overnight-fasted, voided state and wearing night clothes or a gown. Later these clothes may be independently weighed and the subject’s naked mass derived. Measurement of body volume has traditionally been performed by water displacement, an approach that dates from the time of Archimedes, who demonstrated that the apparent loss of weight (mass is unchanged) of an immersed body is equal to the weight of the water displaced. As 1 kg of water occupies close to 1 litre, it follows that, for a totally immersed body, the apparent loss of weight equates to its volume. In practice a person usually has positive buoyancy, so the subject must wear supplementary diving weights of known immersed weight ws to ensure total immersion. The weight of water wd displaced by the subject can then be expressed as: where wa is the subject’s weight in air and ww the weight when immersed. The volume V is found as wd/ρw, where ρw is the density of water at the experimental temperature (typically 0.9957 at a comfortable water temperature of 30 °C). Thus: This is the gross body volume, which includes the volumes of supplementary weights, air in the lungs and gas in the gut. The latter is usually assumed to be 100 ml, and can be minimised if the subject is fully voided prior to the measurement. Lung volume is ideally measured at the time the immersed weight is recorded. The residual lung volume may be measured by helium dilution. To do this, a spirometer is prepared by filling to a volume (typically 5 litres) with oxygen and adding a further volume (typically 1 litre) of helium to give a total volume Vs. The resulting mixture is sampled by a helium analyser and its concentration of helium ho is recorded. During immersion, the subject breathes through a mouthpiece and tube of volume Vt. At the time of weight recording, the subject fully expires and the tube is coupled to the spirometer, from which the subject breathes the helium–oxygen mixture until a new steady concentration of helium hi is recorded. Carbon dioxide produced by the subject is absorbed and oxygen is replaced as it is consumed, so the initial volume of the spirometer is restored at the end of each expiration. The subject’s residual lung volume Vr may then be expressed as: The precision of repeated body volume estimates is typically 0.15 l. An underwater weighing system may take a number of forms. Some systems adopt vertical immersion, lowering the subject into a tank on a chair suspended from a cable incorporating a tension measurement instrument. Others put the immersion process in the control of the subject, by asking them to lean forwards or backwards into the water while sitting on an immersed platform suspended from load cells. Whatever the design, there will be subjects for whom immersion is not easy or well tolerated and so alternative approaches to volume measurement have been developed. It is also worth noting that in the interests of hygiene it may be advisable to change the water and clean the tank between subjects. Air displacement offers one alternative to water displacement for body volume estimation. The BOD POD® is a commercial implementation of this (Cosmed, Rome, Italy). The adult version is described in this section and a smaller version, the PEA POD, is available for neonatal measurements. The BOD POD consists of two chambers, a large front measurement chamber accessible to the subject and a smaller reference chamber of fixed volume, separated from the measurement chamber by an electronically driven diaphragm – see Figure 11.1. The diaphragm oscillates, causing small, equal-amplitude fluctuations in the volumes of the chambers. These induce pressure oscillations such that the ratio of the front to rear pressure amplitudes is inversely proportional to the ratio of the respective chamber volumes. The instrument is calibrated with a standard cylinder of 100 l volume, so that the change in pressure ratio resulting from this can be compared to that induced by a subject, thus enabling the subject’s volume to be expressed in terms of the standard. Figure 11.1 Schematic diagram of the BOD POD. By courtesy of COSMED and reproduced with permission. This simple theoretical principle becomes more complex in practice. Throughout most of the system the pressure and volume changes occur adiabatically – that is, without the exchange of heat. However, the system software must correct for surface area effects where the pressure–volume relationship is isothermal rather than adiabatic, around the subject’s body and the chamber walls. The isothermal region around the subject is minimised by reducing clothing to a minimum (e.g. swimwear) and compressing the hair in a bathing cap. Lung volume is not directly measured during the body volume measurement procedure. The body volume measurement may be expected to take account of lung volume, but in practice this is isothermal space and so needs separate consideration, either through prior independent measurement or alternatively by assignment of a value estimated from height and body mass. As lung volume is an isothermal space there is some tolerance of errors in its estimation; only 40% of an error in lung volume estimation propagates to the body volume measurement. BOD POD measurement is generally better tolerated and quicker than underwater weighing and is suitable for subjects up to 225 kg body mass. The measurement procedure incorporates a body mass measurement so that body fat and lean content may be calculated by a two-component model such as that described by Siri, described later in this chapter. The precision of repeated measures of body volume by ADP is similar to UWW, in the order of 0.15 l. Photonic scanning is a recent novel approach to the estimation of body volume. A three-dimensional image of the body is generated from reflections of multiple sources of light in the near infra-red region. Body volume is computed from the image. Lung volume must also be measured or estimated and deducted from the superficial volume. In contrast to ADP, there is no attenuation of errors in the lung volume estimate. Validation against UWW and ADP suggests that the average bias in estimation of body volume by photonic scanning is small, but that its precision is only half as good: 0.3 l compared to 0.15 l for ADP. The mass of water within the body may be estimated by measuring the dilution of a known mass of a tracer into the body water pool. The most commonly used tracer is water itself, labelled by enrichment in deuterium (2H), a stable isotope of hydrogen (1H) with a neutron in its nucleus. The ratio of deuterium to hydrogen in water may be determined by mass spectrometry or Fourier transform infra-red spectrometry (FTIR). Prior to dosing with labelled water, a sample of body fluid is taken for baseline ratio analysis, as deuterium is naturally present in water at an atomic concentration of about 150 parts per million (ppm) of hydrogen. Body water may be sampled as urine, blood or saliva – the latter is particularly convenient to collect. The tracer dose is usually given as a drink containing a known amount of deuterated water. The dose is typically prescribed as 0.1 g/kg body mass for mass spectrometric analysis or 0.4 g/kg for FTIR. Further samples of body fluid are taken for 2H:1H ratio analysis, usually at 3, 4 and 5 hours post dose. The aim of sample timing is to identify the highest 2H concentration in body water following absorption of the dose, before the concentration falls again due to dilution by further water, be it produced by metabolism or ingested. An adjustment is made to account for the 4% higher distribution space of 2H relative to total body water. This is due to exchange of 2H with non-aqueous hydrogen. While this section has focused on deuterium dilution, 18O labelled water may also be used as the tracer. The procedure is very similar to that for 2H dilution, though the dilution space adjustment may be smaller. The cost of 18O labelled water may be higher than for deuterated, but analytical costs may be lower. The precision achievable in total body water estimate is in the region of 0.7% of TBW, or roughly 0.4% of body mass. Total body water is distributed between the fluids inside and outside cells. Intra-cellular fluid is characterised by its potassium content. The body contains typically 3500 mmol of potassium with around 98% in cells, where it has a concentration close to 150 mmol/l. Potassium has a naturally occurring radioactive isotope 40 K with 0.012% abundance. Its half-life is exceptionally long (1.2 × 10⁹ years), but the 1.46 MeV gamma radiation from its decay may be measured in a whole-body counter. From its decay rate and the intra-cellular potassium concentration, intra-cellular fluid volume may be deduced. The precision of total body potassium (TBK) estimates has been estimated as 1.5–2.3%. As intra-cellular volume reflects cell mass, lean mass may be inferred from TBK and fat mass derived by difference from body mass. Whole-body counters are uncommon and so this methodology may not be generally applicable. Extra-cellular fluid is more easily quantified by a tracer-dilution approach. Sodium bromide is usually the tracer of choice, as bromide ions remain predominantly in the extra-cellular space. Two samples of extra-cellular fluid (plasma) are required, one prior to bromide administration and a second 3 hours after administration of 5 g of 4 mol/l sodium bromide solution as a drink. Sodium bromide concentrations are analysed in each and the extra-cellular water in g is calculated as: where D is the dose in g, C is concentration in mmol/l; p1 indicates pre-dose and p2 post-dose sample. The constant 0.9 is a correction for intra-cellular bromide and 0.95 is the Gibbs–Donnan equilibrium factor. Correction may also be made for bromide lost to urine between dosing and sampling. Estimation of extra-cellular water space by bromide dilution has an estimated precision of around 3%. Bromide is eliminated slowly, so sodium bromide may not be the ideal tracer when measurements must be repeated within a day or two. Inulin has been explored as an alternative tracer to overcome this, but it must be administered by injection or infusion. Dual-energy x-ray absorptiometry (DXA) was initially developed to measure bone density, for example in the femoral head or lumbar spine, but is equally effective for the measurement of fat and lean mass and its distribution in the whole body. The principle of DXA measurement, in somewhat simplified form, is as follows. An x-ray beam with two energy spectra (analogous to the light of two colours) is passed through the body towards a detector. Between the source and the detector, body tissues absorb some of the x-ray. The attenuation of the x-ray is proportional to the absorption coefficient μ, which is both tissue and energy specific, and to the tissue path length d. In the case of two tissues, for example fat and lean, each having a characteristic absorption coefficient, the absorbance A may be described at each of the energies as: where 1 and 2 represent the energies and f and l represent fat and lean. These expressions are solved by the instrument software to disclose the depths of the respective tissues. The instrument scans the whole body or a subregion to build up a two-dimensional image over which the tissue depths are calculated and integrated to give volumes and subsequently reported in mass units (g, kg). As these two expressions only solve for two unknowns, when bone is detected within the x-ray field it becomes one of the analysed tissues, and soft tissue above and below the bone is treated as the second, being assigned absorption coefficients derived from adjacent fat and lean measurements. Early DXA instruments employed a narrow ‘pencil’ x-ray beam. This resulted in rather long total body scan times (20–40 minutes for a whole body). More recent instruments have fan-shaped beams that enable whole-body scan times to be reduced to 5–10 minutes. Scan times of hips and spines for bone density analysis are shorter still. Image resolution has also been improved several fold. The benefit of higher resolution and smaller pixel size is improved measurement precision, particularly in the trunk where spaces between ribs may be comparable with the pixel size of low-resolution instruments. Precision derived from the standard deviation (SD) of repeated measures of total body fat and lean mass has been reported as around 900 g in both pencil and narrow fan beam instruments prior to recent resolution enhancements offered by the GE Lunar iDXA. These have seen reported precision improved more than threefold to 250 g in fat mass and 200 g in lean mass, so that precision is now comparable with that of quantitative magnetic resonance methodology and has roughly twice the power of multicomponent models to detect changes in body composition (see later in this chapter). Agreements between whole-body DXA estimates of fat and lean mass and those of the four-component criterion method (Section 11.11) are generally excellent. Examples of DXA whole-body soft tissue images for a male and a female subject are shown in Figure 11.2. The lines in the figure mark the boundaries of standard subregions for which results are reported. Custom regions may also be defined by the investigator. Figure 11.2 Whole-body images of soft tissue made by dual energy x-ray absorptiometry (DXA). On the left is an image of a male subject of 84 kg body weight and on the right a female of body weight 74 kg. Below the DXA images are images of a transverse slice though the abdomen at the level of the fourth lumber vertebra made by magnetic resonance imaging (MRI).
Methods for Assessing Nutritional Status and Body Composition
11.1 Body composition
11.2 Introduction to body composition compartments
11.3 A word about accuracy, precision and limits of agreement
11.4 Stature
11.5 Body mass
11.6 Body volume
Underwater weighing (UWW)
Air displacement plethysmography (ADP)
Photonic scanning
11.7 Total body water by deuterium dilution
11.8 Intra-cellular water by 40 K counting
11.9 Extra-cellular water by sodium bromide dilution
11.10 Fat, lean and bone mass by dual-energy x-ray absorptiometry
Principle of measurement
Ionising radiation
Related posts:

Stay updated, free articles. Join our Telegram channel

Full access? Get Clinical Tree


