Chemical shift
Multiplicity
Assignment
p-value (pCR vs. SD)
p-value (pCR vs. PR)
p-value (PR vs. SD)
4.24
m
Threonine
0.04
0.28
0.30
1.00
s
Isoleucine
0.04
0.01
0.02
2.09
m
Glutamine
0.01
0.10
0.01
7.07
s
Histidine
0.29
0.20
0.54
Further analysis focused on evaluating the performance of the metabolites in combination. Combining three NMR-derived markers (threonine, glutamine, and isoleucine) with LC-MS detected linolenic acid. The model provides 100 % selectivity and 80 % sensitivity for the prediction of pCR vs. SD with an AUROC of 0.95.
The results suggest that metabolites in the serum of breast cancer patients are indicators of tumor/host metabolism and that they can predict both sensitivity and resistance to chemotherapy a priori.
A prediction model for the outcome of breast cancer neoadjuvant chemotherapy based on metabolic profiling studies is presented. It combines NMR and LC-MS methods. A combination of four metabolites, three detected by NMR: threonine, glutamine, and isoleucine, and one by MS, linolenic acid, distinguishes groups of patients with no, partial, or complete response.
It clearly indicates that several blood-based metabolite markers are sensitive to response and that the approach is promising for predicting the response to chemotherapy. In addition, considering the strong performance as a biomarker, linolenic acid and possibly other fatty acids might be of particular interest for further validation studies.
Potential Early Diagnosis
For breast cancer, screening mammography is considered the gold standard for early detection; however, the sensitivity of this test is between 54 and 77 %, depending on the type of mammography [45]. Furthermore, mammography is uncomfortable for many patients and exposes them to radiation. As a result, many women do not obtain yearly mammograms. There is a need to find a general screening test for all cancers that would ideally be noninvasive and have high sensitivity and specificity.
Monitoring of blood or urine for glucose and creatinine continues to be an integral part of diagnostic tests run today. Although these one- or two-component chemical tests provide a quick and inexpensive way to monitor health, what distinguishes metabolomics from clinical chemistry is that metabolomics measures tens to hundreds and potentially thousands of metabolites at once, rather than just one or two. Through urinary measurement, it has the potential to become a general screening test because it is convenient, easy to obtain, and noninvasive. In this study, metabolomics is applied to study urine from women with breast cancer.
Study and Results
Comparison of 67 metabolite concentrations from healthy subjects (n:62) and subjects with breast cancer (n:38) revealed significant differences. Application of multivariate statistical data analysis (OPLS-DA) to this dataset resulted in distinction between individuals with breast cancer and those without. Five of the healthy individuals overlapped with the breast cancer category. The model parameters and validation of the PLS-DA (multivariate statistical data analysis) suggested a good model. OPLS-DA class prediction was performed as for the EOC subjects, on a total of 20 subjects, 10 each of breast cancer and healthy. As may be observed, all breast cancer and healthy test subjects were correctly classified [21].
Analysis of urinary metabolite changes revealed that many metabolites decreased in relative concentration with a cancer phenotype when compared with healthy. That the majority of urinary metabolites appeared to decrease in concentration in cancer patients is a similar result to what has been seen in colon cancer tissue metabolomics. Interestingly, some metabolites that were shown to increase in cancer tissue (such as some of the amino acids) were lower in the urine of cancer patients. Concentrations of many amino acids decrease in cancer patients relative to healthy. Decreases in tricarboxylic acid (TCA) cycle intermediates are suggestive of a suppressed TCA cycle. In a study of urinary markers of colorectal cancer, it was observed that several TCA cycle intermediates decrease in those with colorectal cancer as compared with those without [46]. The biological reason behind the metabolite changes is largely speculative at this point but likely involves a shift in energy production, as tumors rely primarily on glycolysis as their main source of energy. This phenomenon is known as the Warburg effect [47], and decreases in TCA cycle intermediates and glucose in the urine could be indicative of this phenomenon. Clearly, lower glucose concentrations were observed in women with ovarian cancer as compared with breast cancer. This could be because of the fact that more of the women with ovarian cancer were in an advanced stage of the disease. Furthermore, the use of amino acids by tumors requires the upregulation of amino acid transporters, [48] pulling these metabolites from the blood. Decreases in circulating glucose and amino acids could subsequently result in an overall decrease in energy metabolism elsewhere in the body, diminishing other metabolic pathways such as the urea cycle, resulting in lower concentrations of urea and creatine, and potentially affecting gut microbial population and/or metabolism.
So, it is suggested that a urine test is faster, easier to administer, less costly, and noninvasive and could be used as a prescreen to other forms of more invasive or uncomfortable screening.
Prediction of Prognostic Factors
There are few predictive and prognostic markers in breast cancer, but some specific markers are routinely being used for treatment planning and evaluating prognosis [49]. Estrogen receptor (ER) and progesterone receptor (PgR) status predict a possible endocrine responsive tumor, whereas human epidermal growth factor receptor 2 (HER-2)-positive tumors may be suitable for trastuzumab treatment. ER, PgR, and axillary lymph node status, together with tumor size and lymphovascular invasion, are important for predicting the clinical outcome of breast cancer patients [49–51].
High-resolution magic angle spinning magnetic resonance spectroscopy (HR-MAS MRS) can be used to describe the metabolic profile of intact tissue samples. Metabolic profiles have been shown to correlate with characteristics of several malignant diseases such as breast [15, 17, 20], brain [52], colon [53], and cervical cancer [54]. More than 30 metabolites have been described by HR-MAS MRS analysis of breast cancer tissue [20].
The study of the metabolic profile of certain cell or tissue types in combination with multivariate and analytical statistics is referred to as metabolomics. In a study, Bathen et al. showed that hormone receptor and axillary lymph node status, as well as histological grade, could be predicted by MR metabolomics [17]. The study by Bathen et al. was, however, performed using spectra from a restricted number of patients (n:77) and verified on a small amount of blind samples (n:12).
The purpose of a recent study [22] was to further explore the potential of MR metabolomics to provide clinically useful prognostic factors for breast cancer patients. The use of HR-MAS MRS and chemometrics as tools for determining prognostic and predictive factors of breast cancer was evaluated. Several multivariate classification techniques exist, and in this study, partial least squares discriminant analysis (PLS-DA), probabilistic neural networks (PNNs), and Bayesian belief networks (BBNs) were used. The relationship between the metabolic profiles of breast cancer tissue and the status of ER, PgR, and axillary lymph nodes was examined, and blind samples were predicted for verification.
Study and Results
ER and PgR status were best predicted by PLS-DA (Tables 10.2 and 10.3). For ER status, the number of correctly classified blind samples were 44/50 and 42/50 for Kennard-Stone and SPXY sample selection, respectively, while PgR status had a correct blind sample classification of 39/50 for the Kennard-Stone test set and 36/50 for SPXY. Similar results for both Kennard-Stone and SPXY sample selection indicate robust classification by PLS-DA. The sensitivity and specificity of classification were approximately equal; this is in contrast to the results of PNN and BBN where the sensitivity was higher than the specificity. The higher sensitivity may be due to the fact that, especially for ER status, there are more positive than negative samples. This could lead to networks that are more specialized in recognizing positive than negative samples. Since the probability of a sample being positive is much higher than the probability of it being negative, the network achieves a greater number of total correct classified samples by classifying most of the samples as positives. In PNNs, this can be partly overcome by the customized fitness function, allowing the user to insert a penalty whenever a negative sample is classified incorrectly. In this study, the same penalty was used for both the Kennard-Stone and the SPXY training and test sets. Although this improved the classification ability of the networks compared to networks without penalty, the classification error was still higher than that achieved by PLS-DA.
Table 10.2
Results from prediction of ER statusa
PLS-DA (1 LVs) | BBN | PNN | |
|---|---|---|---|
Kennard-stone | |||
Correct classification | 44/50 | 39/50 | 40/50 |
Sensitivity (%) | 90 | 95 | 82 |
Specificity (%) | 82 | 18 | 73 |
SPXY | |||
Correct classification | 42/50 | 41/50 | 42/50 |
Sensitivity (%) | 87 | 97 | 90 |
Specificity (%) | 73 | 38 | 64 |
Table 10.3
Results from prediction of PgR statusa
PLS-DA (1 LVs) | BBN | PNN | |
|---|---|---|---|
Kennard-Stone | |||
Correct classification | 39/50 | 35/50 | 35/50 |
Sensitivity (%) | 81 | 77 | 71 |
Specificity (%) | 74 | 58 | 68 |
SPXY | |||
Correct classification | 36/50 | 36/50 | 36/49b |
Sensitivity (%) | 77 | 84 | 80 |
Specificity (%) | 63 | 53 | 63 |
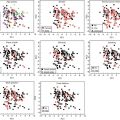
A PLS-DA model of the whole dataset with three latent variables (LVs) explains 43.8 % of the X-variance and 42.7 % of the Y-variance. The score values for ER + and ER- samples are significantly different for all three LVs (t-test, p < 0.001), and it is possible to discriminate between ER + and ER- samples in a score plot of LV1, LV2, and LV3. ER + and ER- samples are mainly separated on the first LV that represents 70 % of the Y-variance explained by the model, and ER- samples have higher score for LV1 than ER + samples. The loading profile for LV1 reveals that samples with higher score for LV1 have more of the metabolites glycine (Gly), glycerophosphocholine (GPC), choline (Cho), and alanine (Ala) and less ascorbate (Asc), creatine (Cr), taurine (Tau), and phosphocholine (PC) than samples with lower LV1 scores. The regression vector of the PLS-DA model gives an indication of the overall influence of the variables based on all three LVs. The regression vector of ER- samples appears similar to LV1 and shows the same metabolic patterns. In addition, lactate (Lac) appears to be more expressed in ER- samples.
Axillary lymph node status was best predicted by BBN with 34 of 50 blind samples correctly classified. However, this was only true for the samples chosen by SPXY sample selection, and the same number of correctly classified samples was not achieved using Kennard-Stone sample selection. PLS-DA and BBN gave similar results, and overall, all three methods gave unacceptably high classification errors. However, the number of correctly classified samples was better than expected by chance for all methods. This indicates that there is a difference between the MR spectra of lymph node-positive and lymph node-negative patients and that the metabolic profile is altered in patients with lymphatic spread compared to patients without spread.
In conclusion, ER and PgR status were successfully predicted by MR metabolomics. There is also a relationship between metabolic profile and lymph node status, although prediction of lymph node status based on MR spectra did not reach a reliable level of correctly classified samples. By combining MR spectroscopy with multivariate modeling, the biological differences between different metabolic profiles could be revealed. Here hormone receptor-negative patients appear to have more of the metabolites glycine (Gly), glycerophosphocholine (GPC), and choline (Cho) than receptor-positive patients. The data also indicate different metabolic profiles between ER status and PgR status. Thus, this study has shown that MR profiles contain prognostic information that may be of benefit in treatment planning and patient follow-up, and MR metabolomics may become an important tool for clinical decision-making in breast cancer patients.
Identification of the Presence of Micrometastasis
Current approaches, using traditional clinicopathological features or gene profiling, assess the primary tumor and estimate the risk of recurrence based on the presumption of micrometastatic disease. These tools have limitations. Consequently, an individual’s risk may be over- or underestimated.
The 21-gene Oncotype Dx assay was assessed in 355 placebo-treated patients from the NSABP-B14 trial in node-negative ER-positive disease. Ten-year distant recurrence-free survival for these patients treated with surgery alone was 86, 62, and 69 % for low, intermediate, and high recurrence scores, respectively [1]. The 70-gene MammaPrint applied to 151 lymph node-negative patients, only ten of whom received any adjuvant therapy, showed differential 10-year distant metastases-free survival between good and poor prognosis signatures at 87 and 44 %, respectively [55]. A striking feature of these studies is that some individuals, despite apparent high-risk disease, clearly have excellent long-term outcomes. This reflects heterogeneity of disease, host, and risk and highlights overestimation of risk by current prognostic tools.
An alternative to presuming residual disease is actual measurement of micrometastases. Studies of micrometastatic disease are intriguing, particularly those of isolated tumor cells (ITC) in the bone marrow and circulating tumor cells (CTC) [56–58]. Of particular interest is that not all patients with ITC or CTC develop clinically detectable metastatic disease. Thus, tumor survival depends on both favorable tumor and host characteristics. Indeed, assessment of this dynamic multifactorial interaction is a strength of the evolving field of metabolomics.
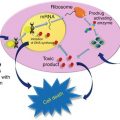
Transformed human cells exhibit profound metabolic shifts, particularly reflecting the induction of cell membrane phospholipids biosynthesis and breakdown, and preferential use of glucose through non-oxidative pathways. Metabolomic analyses of patient serum and urine samples have been shown to delineate between healthy, benign, and malignant conditions. Specifically with breast cancer, there is cell line evidence of metabolomic distinction between normal and malignant and, even more specifically, identification of malignant breast cell lines with greater metastatic potential. With breast tissue, metabolomic analyses distinguish normal tissue, benign disease, carcinoma in situ, and invasive carcinoma. The subsequent challenge is to capture the malignant metabolomic signal among the complex serum metabolomic fingerprint for an individual [59].
Information on the metabolite pattern alterations that can be significantly associated to the pathology is directly obtained through statistical analysis of the NMR profiles. A metabolomic fingerprint may exist for micrometastatic disease. More specifically, a fingerprint may exist which identifies the interaction between host and any residual disease.
Metabolomic analyses in breast cancer patients with early and metastatic disease have been carried out and compared. Prognostic ability of the fingerprint has been explored by comparison with 10-year mortality rates determined by the current prognostic tool Adjuvantionline. The pilot model, developed in 44 early breast cancer patients, was then validated in a second cohort of 45 early breast cancer patients.
Study and Results
The appeal of metabolomics is concurrent assessment of tumor and host. Indeed, survival of a specific tumor in a specific host relies on a dynamic interaction, with evasion of normal host immunity and favorable stromal environment for metastatic deposits as key factors. In this recent study, metastatic subjects were characterized by higher values of phenylalanine, glucose, proline, lysine, and N-acetyl cysteine and lower values of lipids, when compared to the spectra of both post- and preoperative patients [60].
A strength of metabolomics, as compared with current prognostic tools, may be confirmation rather than assumption of micrometastatic disease. Results reveal differential metabolomic fingerprints for most early and metastatic breast cancer patients. Among the normal noise of the metabolomic fingerprint, most patients were distinguished based on metabolomic analysis of one serum sample [60].
Metabolomic analysis assigns more patients to low risk than are assigned by Adjuvantionline. Similarly, when compared with conventional clinical and pathological factors, prognostic gene expression signatures generally identify more patients of low risk. The 21-gene Oncotype Dx shows direct concordance of 36 % in relapse risk stratification compared with an adjusted Adjuvantionline [61]. The 70-gene MammaPrint, when compared with Adjuvantionline, had stronger predictive power and provided lower-risk estimates for more patients [62]. These low-risk patients may be spared or receive less intensive adjuvant treatment.
In conclusion, the benefit of metabolomics is the incorporation of both a specific tumor profile with metastatic features and a specific host profile conducive to tumor growth. A preliminary exploration in a limited number of patients of a potential role for the evolving field of metabolomics in assessment of micrometastatic disease in early breast cancer has been presented. Clearly, this approach requires refinement and validation, but the distinction identified between early and late disease and the prognostic role of the metabolomic fingerprint provide an exciting platform for further work.
Early Detection of Recurrence
Common methods of routine surveillance for recurrent breast cancer include periodic mammography, self- or physician-performed physical examination, and blood tests. The performance of such tests is lacking and extensive investigations for surveillance have not proven effective [63]. Often, mammography misses small local recurrences or leads to false positives, resulting in suboptimal sensitivity and specificity and unnecessary biopsies. In view of the unmet need for more sensitive and earlier detection methods, the last decade or so has witnessed the development of a number of new approaches for detecting recurrent breast cancer and monitoring disease progression using blood-based tumor markers or genetic profiles. The in vitro diagnostic (IVD) markers include carcinoembryonic antigen (CEA), cancer antigen (CA 15–3, CA 27.29), tissue polypeptide antigen (TPA), and tissue polypeptide specific antigen (TPS). Such molecular markers are thought to be promising since the outcome of the diagnosis based on these markers is independent of expertise and experience of the clinician, and their use potentially avoids sampling errors commonly associated with conventional pathological tests such as histopathology. However, currently, these markers lack the desired sensitivity and/or specificity, and often respond late to recurrence, underscoring the need for alternative approaches [64].
A new approach is to use metabolite profiling (or metabolomics), which can detect disease based on a panel of small molecules derived from the global or targeted analysis of metabolic profiles of samples such as blood and urine, and this approach is increasingly gaining interest. Metabolite profiling utilizes high-resolution analytical methods such as nuclear magnetic resonance (NMR) spectroscopy and mass spectroscopy (MS) for the quantitative analysis of hundreds of small molecules (less than 1,000 Da) present in biological samples. Owing to the complexity of the metabolic profile, multivariate statistical methods are extensively used for data analysis. The high sensitivity of metabolite profiles to even subtle stimuli can provide the means to detect the early onset of various biological perturbations in real time. Metabolite profiling has applications in a growing number of areas, including early disease diagnosis, investigation of metabolic pathways, pharmaceutical development, toxicology, and nutritional studies. Moreover, the ability to link the metabolome, which constitutes the downstream products of cellular functions, to genotype and phenotype can provide a better understanding of complex biological states that promises routes to new therapy development.
Metabolite profiling gg methods are applied to investigate blood serum metabolites that are sensitive to recurrent breast cancer. We utilize a combination of NMR and two-dimensional gas chromatography resolved MS (GCxGC-MS) methods to build and verify a model for early breast cancer recurrence detection based on a set of 257 retrospective serial samples. Performance of the derived 11-metabolite biomarker model is compared with that of the currently used molecular marker, CA 27.29, in particular, for providing a sensitive test for follow-up surveillance of treated breast cancer patients.
This is the first metabolomic study that combines the information-rich analytical methods of NMR and MS to derive a sensitive and specific model for the early detection of recurrent breast cancer. The results indicate that such an approach may provide a new window for earlier treatment and its benefits.
Study and Results
The development of a metabolomic-based profile for the early detection of breast cancer recurrence is presented in a recent study [23]. The investigation makes use of a combination of analytical techniques, NMR and MS, and advanced statistics to identify a group of metabolites that are sensitive to the recurrence of breast cancer.
Related posts:
 Gynecologic Considerations for Women with Breast Cancer
Molecular Diagnosis of Metastasizing Breast Cancer Based Upon Liquid Biopsy
Breast Cancer Therapy–Classical Therapy, Drug Targets, and Targeted Therapy
Gynecologic Considerations for Women with Breast Cancer
Molecular Diagnosis of Metastasizing Breast Cancer Based Upon Liquid Biopsy
Breast Cancer Therapy–Classical Therapy, Drug Targets, and Targeted Therapy
 Breast Circulating Tumor Cells: Potential Biomarkers for Breast Cancer Diagnosis and Prognosis Evaluation
 Breast Cancer Gene Therapy
 Exhaled Volatile Organic Compounds as Noninvasive Markers in Breast Cancer
Stay updated, free articles. Join our Telegram channel

Full access? Get Clinical Tree


