This type of analysis can be used on different MR sequences or CT slices. Yet, portrayed texture from necrosis, which may be important to detect during LGG transformation, may be extracted from ADC textural analysis, whereas TA of T1 post-contrast may provide accurate quantitation of intra-lesional heterogeneity. However, it should be noticed that several methods are used for this technique, and then the results may be difficult to standardize for appropriate comparison from one series to another. Particularly, the filtration step is crucial for removing image heterogeneity due to noise, thus leading to highlight biological important heterogeneity. In addition, the order (e.g. first or second) of histogram statistical parameters is determinant for the results. Last, other authors have selected different texture analysis parameters, such as entropy derived from ADC maps [4], or combining imaging features from several sequences and using support vector machines [5]. Then the reproducibility of these methods may be uncertain, leading to increase variability in interpretation. However, Brown et al. [6] demonstrated in a study of 55 cases of oligodendrogliomas that codeleted (1p19q) tumors had significant differences in the amplitudes of intermediate frequencies on both T1 and T2—weighted images, thus allowing high sensitivity and specificity (95%) discrimination. In a follow-up study [7], heterogeneous signal intensity on T2 images was associated with codeletion.
SWI-LIV: Grabner et al. developed a technique providing quantitation of hypointensities local image variance based on 7T SWI (Susceptibility Weighted Imaging) images analysis [8]. After segmentation and pre processing with intensity correction and rescaling the intensity image, the SWI Local Image Variance was calculated using the following formula LIV = G(X2)-[G(X)]2 (X is the pre processed image and G represents a Gaussian low pass filtering). Significant differences in SWI-LIV values were found dependent on the IDH1 mutational status and type of MRI contrast-enhancement, thus leading to improve pre-operative assessment of DLGG.
Fractal Analysis
The fractal dimension (FD) is a non-integer number that characterizes the morphometric variability of a complex and irregular shape [9]. Based on SWI images which underwent automated computation, extracting two quantitative parameters: the volume fraction of SWI signals within the tumors (signal ratio) and the morphological self-similar features (fractal dimension [FD]). The results can be then correlated with each histopathological type of glioma and increase the accuracy of initial diagnosis (e.g. between WHO II and WHO III and malignant transformation of DLGG).
CEST Imaging or Molecular Imaging
Amide Proton Transfer -Chemical Exchange Saturation Transfer may also provide critical information about tumor response of glioma under chemotherapy. Although this is a recent new technique based on a specific sequence, with only few publications in our field, it represents the new trend of molecular-metabolic-physiological imaging by magnetic resonance [10, 11]. CEST contrast is obtained after applying a saturation pulse at the specific resonance frequency of an exchanging proton site. The saturated spin is transferred to bulk water, and then specific molecular information can be obtained [12], within a so called “negative contrast” [13]. In APT, chemical exchange between protons of free tissue water (bulk water) and amide groups (−NH) of endogenous mobile proteins and peptides. Those exchangeable protons are more abundant in tumor tissues than in healthy tissues [14]. Other previous reports demonstrated that the APT signal increased by 3–4% in tumor compared with peritumoral brain tissue and human brain tumor at 3T [15]. However, those chemical exchanges are dependant from other metabolic changes, as the reduction in intracellular pH after treatment with TMZ. This would also result in a decrease in APT signal because −NH proton exchange is known to be catalyzed by base [16], which is otherwise consistent with natural history of gliomas, as previously suggested in experimental and clinical studies [17, 18]. This point suggests that APT sequence may be used concomitantly with phosphorus spectroscopy for pHi monitoring.
The results of the different studies above-cited suggest that APT imaging may serve as a useful biomarker in glioma for monitoring treatment response during chemotherapy and follow-up after treatment, including for radionecrosis identification [19]. This can be implemented on a standard clinical scanner [15, 20].
14.2.2 Improving Data Analysis and Quantitation from Spectroscopy
Some works have raised during last years with the aim of provide optimized quantitation of brain tumors metabolites detected by MR spectroscopy. However, it should be noted that comparable data from different imaging centers and then, from different series, is difficult to obtain because of the heterogeneity of scanners, which is particularly important in spectroscopy, as the signal is varying in huge amounts (until two folds) from 1.5T to 3T magnets for a metabolite considered [21]. This may lead to important errors for (1) differential diagnosis from DLGG to other tumors; (2) follow-up characterization, as the successive exams for a same patient may be performed in a same center alternatively on magnets with different magnetic field strengths. Moreover, the data post-processing is also heterogeneous as numerous softwares are available in many MR centers, whatever commercial, freeware or in-house, with different solutions for quantitation. Some interactive quantification methods for the single voxel spectroscopy (SVS) such as AMARES or VARPRO, bring user lots of repetitive and unbearable work. What’s more, the quantitative result is hard to be reproduced because of the difference in user’s prior knowledge and state. Therefore, the automatic quantification is required to replace the interaction quantification for the sake of more efficiency and robustness. In their paper, Dou et al. [22] present a new automatic quantitative approach based on the convex envelope (AQoCE), compared with LC Model used on Siemens magnets. This method leads to increase both specificity and sensitivity of MR spectroscopy, thus suggesting that automated processing of MR data may avoid intra individual variability [23, 24]. This kind of software is based on mathematical algorithms, which supposes to have local specific competencies. The results, while repeatedly provided with a rigorous method in a same center, may be difficult to compare with those arising from another center. The reproducibility of some interesting results may be then random. Moreover, spectroscopic parameters are integrated in a global multiparametric analysis including contrast enhancement, related cerebral blood volume, ADC values extracted from diffusion sequence. Thus, the UCSF team [24] recently published a study on 120 patients with recurrent DLGG. They found several multivariate models with similar accuracy for predicting the grade II and the malignant transformation to grade III or IV. Hence, this kind of tools within the “kinetic” approach they allow are used in routine in some centers with expertise in the field, for the therapeutic follow-up and when the surgical resection is not possible [24]. Moreover, new proton high resolution multivoxel sequences, so-called “Laser or Mega Laser”, allow 3D metabolic mapping, including 2 hydroxyglutarate and glutamate, thus marking the tumoral spatial heterogeneity [25].
Perfusion Imaging Combination of MR DCE and DSC Imaging
Many works have been published about the predictive value of malignant transformation of DLGG [26–28]. Combined acquisitions allowing comparison of vessel compartment and permeability may provide simultaneously parametric maps of CBV, Vp and K(trans). In addition, the region(s) of highest value (hotspot) can be measured on each map, and compared with histograms of rCBV, Vp and K(trans), with global increased sensitivity of perfusion-weighted sequence [29].
14.3 From Biometabolic Model to the Genomic Through the Metabolic Signal
Numerous publications have emphasized a pro malignant role of metabolic enzymes as isocitrate deshydrogenase, succinate deshydrogenase and fumarate deshydrogenase [25]. The most investigated one until today, as the cytosolic isoform, named IDH1, is of interest because (1) its key-role in tumorigenesis; (2) the ability of proton MRS to detect and to quantify some of their metabolic counterparts (Fig. 14.1). Once mutated, the IDH1 enzyme leads to convert α-ketoglutarate to 2-hydroxyglutarate, which is identified to play a crucial role in the initiation of tumorigenesis in mutant IDH1 cells (please refer to the dedicated chapter in this book). Using point resolved spectroscopy within spectral difference editing from proton magnetic resonance spectroscopy, it is possible to detect and quantify 2-hydroxyglutarate resonance, a so-called oncometabolite, which accumulate [30]. Moreover, some authors have demonstrated the interest of longitudinal 2-hydroxyglutarate quantitation for monitoring treatment response in IDH1 mutant patients [31–33]. The authors developed a specific 3D sequence for over sampling the tumor and avoid difficulties due to heterogeneity. It is potentially available in centers with routinely use of proton magnetic resonance spectroscopy.
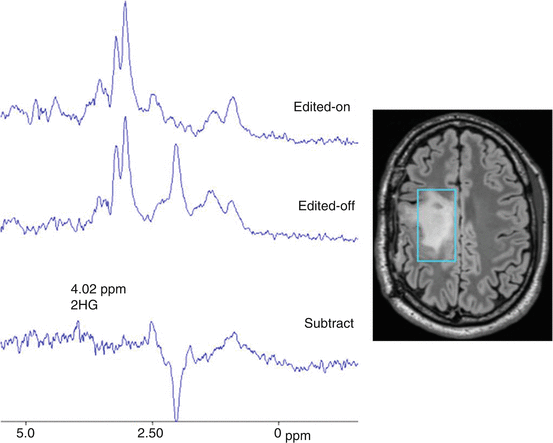

Fig. 14.1
Glioma 2hydroxyglutarate editing: Suppressed spectrum (edited on), unsuppressed spectrum (edited off), edited spectrum of 2hydroxyglutarate (4.02 ppm) derived by subtraction of spectra (on-off)
In their recent experimental works, Viswanath et al. [34] demonstrated that the IDH1 mutation may lead to a decrease of lactate production from pyruvate. They used multinuclear magnetic resonance spectroscopy, and especially 13C-MRS with dynamic nuclear polarization for pyruvate-lactate fluxes assessment, and 31P-MRS for steady-state assessment of intracellular pH and PCr. Furthermore, they showed that reduced flux of hyperpolarized [1-13C] pyruvate to hyperpolarized [1-13C] lactate could be due to reduced MCT1 and MCT4 expression in IDH1 muted cells. Increased intracellular pH in both type of cells was not modified by the drop of intracellular lactate.
Interestingly, the vascular counterpart of this “biochemical re-programming” is also accessible by MRI, during the same time of examination. Kickingereder et al. [30] provided a study in which they demonstrated that a one-unit increase in rCBV corresponded to a two-third decrease in the odds for an IDH mutation and correctly predicted IDH mutation status in 88% of patients. It has been established that increasing levels of 2 hydroxyglutarate leads to indirectly decrease of hypoxia-inducible factor 1-alpha, thus limiting angiogenic growing.
Whereas some of those results are obtained in experimental conditions with limited extrapolation to human- in vivo conditions, we must notice that they are partly consistent with theoretical conjectures expressed in previous papers [35, 36]. Yet, at this stage, before the recent knowledge assessing the links between genomic and metabolic modifications, alterations of MCT properties have been suggested by the previously published model. In this concept, glioma is considered as a general parametrical system evaluating in a viability domain, with specific ranges a value of each parameter [17, 35, 37]. Especially, high concentrations of Lactate (resulting from transport rate by MCT and pHi, are known to be not compatible with metabolic function of the parametrical system, e.g. the glioma (Fig. 14.2). This field of investigation seems to be at its beginning as the technical possibilities are increasing from year to year, especially in multinuclear magnetic resonance imaging, with the ability of studying different molecules according the nucleus studied, e.g. proton, phosphorus, carbon, sodium. Here is arising a new dimension of magnetic resonance, as metabolic one, which cross the link with the isotopic approach.
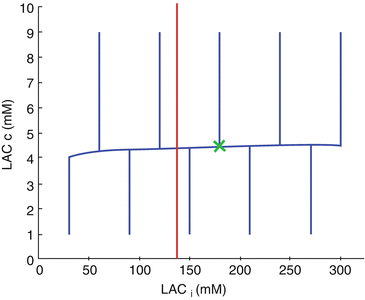

Fig. 14.2
Impact of a significantly decrease of CBF. The red line represents the maximum limit of the viability domain, with maximal acceptable value of LACi
Moreover, this approach leads to interrogate potential therapeutic ways, based on MCT targeting, with potential therapeutic monitoring of a putative response using multinuclear spectroscopy.
14.3.1 Which Sequences for Which Timing? The Challenge of Relevance
Regarding all the possibilities provided today during brain MRI examination time, the key question of patient’s compliance arises. Performing all the sequences above-mentioned as well as morphologic and functional sequences may require much more than 1 h of scanning time. This not include post-processing which should not be taken into account for the patient’s time. This is the case for texture or fractal analysis. Then the potential pertinence of each parameter from a dedicated sequence should be thoroughly considered within the therapeutic step of the patient. The improve of multivoxel proton spectroscopic sequences as Laser allow supplementary information during the same time without additional sequences, such as spatial distribution of 2 hydroxyglutarate and glutamate, both metabolites of importance for glioma monitoring, whatever they are under chemotherapy or not. Then, as stated before, periodic controls including those sequences must be performed to define the “kinetic–metabolic profile”, especially during the initial phase of management (e.g. within the diagnostic time) and at each time of therapeutic commutation. Then the parameters may be integrated into the models to ensure the optimal follow-up. Amide Proton Transfert may provide additional information, especially about the glioma response under temozolomide or in the radionecrosis hypothesis. This sequence should be added into the imaging protocol during TMZ treatment. Phosphorus spectroscopy should also be used concomitantly as stated above, and is also recommended for monitoring (pre) malignant transformation, so-called “2 + grade”, of DLGG. Because of their technical requirements, these last two sequences can be considered as “optional”, dedicated to specific centers. More generally, as evoked in the spectroscopic section, requirements of both sequences acquisition and post-processing may lead to consider that oncometabolic imaging may be realized in centers with high specialization in brain tumor imaging.
Stay updated, free articles. Join our Telegram channel

Full access? Get Clinical Tree


