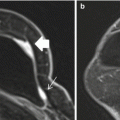
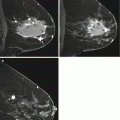
Fig. 5.1
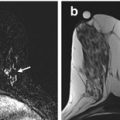
44 year old female with newly diagnosed triple negative invasive ductal carcinoma. (a) Sagittal post-contrast fat-saturated MRI nicely differentiates the untreated hypervascular tumor mass (red arrow) with delayed washout enhancing pattern (red curve) from the (b) background glandular tissue with persistent or benign enhancing pattern (blue cross and blue curve)
Mammography may overestimate residual disease because of a lack of change in the microcalcifications associated with the tumor. A study of 196 patients with invasive ductal carcinoma and ductal carcinoma-in-situ noted that the extent of microcalcifications on mammography after NAC had lower correlation with residual pathologic tumor than did residual enhancement seen on MRI [20]. Early series evaluating the role of US reported that US tends to underestimate residual tumor size and is less accurate than physical examination [21–23]. MRI is the first breast imaging modality that not only allows detailed visualization of the anatomy but also—when an intravenous contrast agent is administered or advanced sequences, such as DWI or spectroscopy, are used—provides functional information. This article reviews the published data on the role of breast MRI in assessing tumor response in women receiving neoadjuvant chemotherapy.
5.3 Magnetic Resonance Imaging Compared to Other Modalities
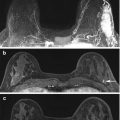
Breast MRI traditionally has a high reported sensitivity of up to 97% for the detection of invasive breast cancer, with a wide range between 50 and 100% for the assessment of response to NAC. This high sensitivity is dependent on the ability of MRI to differentiate untreated hypervascular tumor from the background enhancing glandular breast tissue (Fig. 5.1). In patients undergoing NAC, the anti-angiogenic effect of cytotoxic chemotherapy agents reduces tumor vascularity. This decrease in tumor vascularity would be expected to be associated with a decrease in enhancement of that lesion on MRI. This dampening effect of chemotherapy on enhancement of the lesion may compromise the ability to visualize residual viable tumor (Fig. 5.2). However, the alteration of tumor vascularity or other MR characteristics can help identify predictive features to differentiate patients whose cancer is likely to respond to the chemotherapy from those whose cancer would not respond. The dampening effect is not only observed with the tumor but also with the background parenchyma. The average decrease in background enhancement after NAC in cases with complete response was more than in cases with partial response, stable disease, or progressive disease [24].
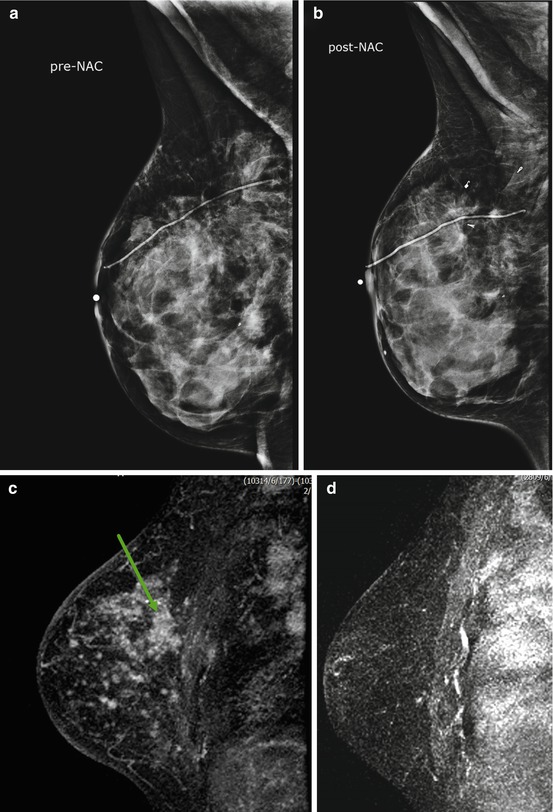

Fig. 5.2
49 year old female with outside excisional biopsy for a palpable finding revealing invasive lobular carcinoma, who received NAC followed by mastectomy. Mammogram prior to NAC (a) and after NAC (b) show no significant change. Sagittal post-contrast fat-saturated MRI prior to (c) and after chemotherapy (d) shows complete response by imaging, with no residual suspicious enhancement. Final pathology reveal 10 cm tumor bed with 15% cellularity
In the last decade, over 40 studies have been published on the use of MRI in identifying assessing treatment response [3, 10–49]. Many of these studies are single-center trials with small sample sizes, or are meta-analysis of the small sample size studies. The studies vary in many parameters such as the criteria used for distinguishing complete responders from partial responders and non-responders. The MRI examinations performed in each trial are not standardized with regards to the Tesla strength of the scanners, number and type of MRI sequences performed for each examination, number of post-contrast sequences performed, timing of post-contrast sequences, or addition of advanced imaging techniques such as DWI or spectroscopy. Despite these differences, many of the observations from these studies are similar. MRI tends to perform better than clinical exam, mammography, or US and is a more reliable method in assessing tumor size. US was suggested to be more likely underestimate tumor size [24]. A small percentage of investigators noted no difference between the performance of MRI and US [25–29]. Conflicting observations remain with regards to the best modalities for assessing response, even though MRI is favored, with PET/CT emerging as possible better modality. The ability of MRI in assessing specific features is discussed in further details below.
5.4 MRI Assessment of Tumor Size
Accurate measurement of tumor size, before NAC, is important for staging, treatment monitoring and determining prognosis. Tumor size has been known to predict patient survival and is the basis of most disease-staging systems [21]. Studies have shown that imaging-based measurements are superior to clinical palpation in determining tumor size [31–35]. Specifically MRI better reflects true pathological tumor size than does physical examination, mammography, or US and is also superior in predicting the amount of residual disease after NAC [31–35]. Several studies have shown that MRI prediction of tumor response to NAC correlates well with pathology, with the correlation coefficient (r) ranging between 0.6 and 0.9 [31, 37–42]. MRI is not a perfect test and can over estimate or under estimate final pathological tumor size, with a tendency to over-estimate in as many as 6–33% of the cases [35–37, 41]. US, on the other hand, tends to underestimate tumor size [30]. The amount of MRI overestimation is small or within 1 cm of the final tumor size, and may not be statistically significant [36, 37]. The residual tumor that MRI may miss post-NAC is also small, ranging between 0.1 – 1.0 cm with median of 0.6 cm [43, 44]. MRI may also underestimate residual disease in 2–10% of cases, especially if the tumor shrinkage pattern is patchy with areas of necrosis between nests of viable tumor or residual single tumor cell or tiny foci scattered over a large area [37, 39, 42–44]. Underestimation by MRI may be more frequently seen with some chemotherapy agents than others. For example, underestimation was seen more frequently in locally advanced breast cancer patients treated with docetaxel-based chemotherapy, than in those treated with 5-fluoro-uraci-epirubicin regimens [44]. These contradicting observations of underestimation and overestimation by MRI are derived from single institutional trials with small sample sizes. Therefore, validation studies are needed with larger sample sizes and standardization chemotherapy regimens.
Tumor volume calculations, in combination with largest tumor diameter, have been proposed as a better parameter to assess response to NAC. Partridge et al. [40] reports that a change in the final tumor volume measurements by MRI had a stronger association with RFS compared to other prognostic indicators such as largest tumor diameter [40]. This volume change can be observed after only one cycle chemotherapy, and is suggested to be associated with RFS. Martincich and colleagues also compared largest tumor size with tumor volume as possible predictors for response to therapy; the authors noted that a tumor volume reduction of more than 65% after two cycles of chemotherapy was the most predictive value for predicting histological response [41]. The findings from these single center trials are confirmed in the multicenter I-Spy trials, discussed in further detail later in this chapter. Regardless whether maximum size or volume calculation is performed, defining the margins of the residual tumor burden can be challenging during and after NAC due to the dampening effect of chemotherapy on the contrast enhancement [15, 40, 41]. Still, MRI is more accurate for estimating size and extent of residual disease than conventional imaging when there are multifocal cancers but less sensitive when there is minimal residual disease. This suggests that when assessing for response, the different tumor biology, the genomic information of breast cancer, and the type of chemotherapy need to be taken into account and not just the size of tumor or stage [45–48]. MRI does provide additional information on tumor vascularity and enhancing pattern of tumor may be relevant to evaluation of response when combined with morphologic assessment and size or volume change from NAC.
5.5 MRI Assessment of Tumor Enhancement
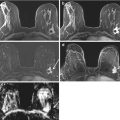
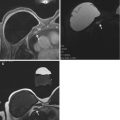
Even though the widely used RECISTS criteria is based on the largest diameter of the cancer, alteration of enhancement pattern and change in the internal enhancement may also provide prognostic information to aid in predicting response to therapy. Tumor enhancement is subjectively characterized as early phase (0–60 s), initial enhancement (60–120 s) of the dynamic series, or delayed phase (more than 120 s) after injection of a gadolinium-based intravenous contrast. Balu-Maestro and colleagues reported the disappearance of early or initial abnormal enhancement in five cases of complete histological response [32]. Rieber et al. found that flattening of the time-intensity curve or disappearance of the washout segment of the kinetic curve after one course of chemotherapy and absence of contrast uptake after four courses of NAC predicts complete pathological response [48]. Other investigators observed decreases in both the rate and magnitude of contrast enhancement within the tumor mass in patients whose disease responded to chemotherapy (Fig. 5.3), and an increase or no change in patients whose disease responded poorly to therapy (Fig. 5.4) [45, 49]. Loo et al. reported the change in the largest diameter of late enhancement after 2 cycles of chemotherapy was the most predictive MRI characteristic for tumor response: a decrease less than 25% in largest diameter of late enhancement was indicative of residual tumor at final pathological examination [50]. A feasibility study in 19 women of tumor washout volume during the late enhancement phase demonstrated a significant reduction of the washout volume, after two cycles of chemotherapy [51]. The tumor volume reduction by more than 65% after two cycles of chemotherapy was reported as a stronger predictor of histopathological response than early enhancement ratio [41]. The change in the internal enhancement from heterogeneous to homogenous was also observed in responders compared to non-responders [52]. Indirectly, the changes in contrast enhancement time curves and internal tumoral heterogeneous enhancement may produce biological information such permeability and vascularity in combination with genomic information to predict resistance to therapy.
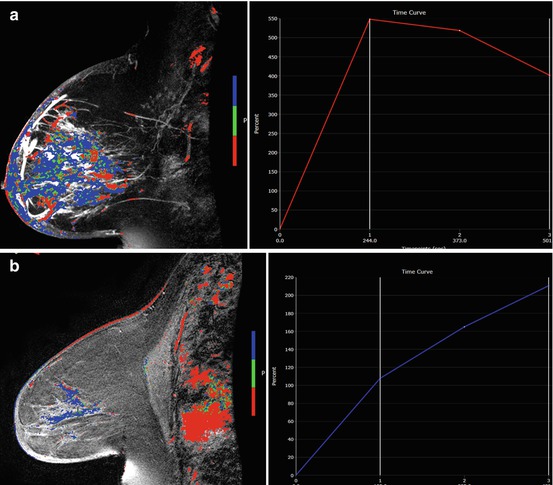
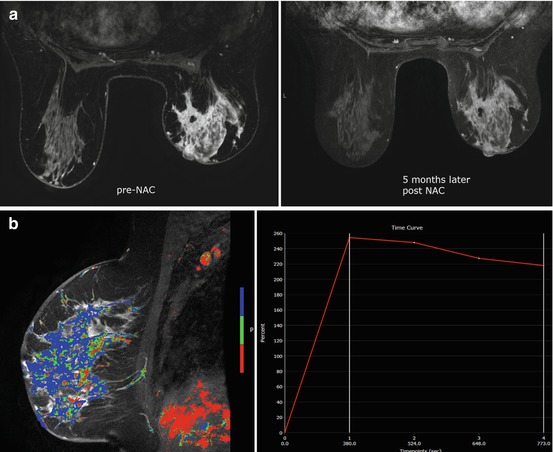

Fig. 5.3
60 year old female with diagnosis of inflammatory breast carcinoma who received NAC. (a) Pretreatment sagittal post-contrast fat-saturated MRI with color-overlayed angiogenic map revealed multicentric breast carcinoma with diffuse skin thickening and kinetic curve demonstrates rapid initial enhancement with delayed washout curve. (b) After NAC, MRI revealed near normalization of the left breast size with residual skin thickening. The enhancement is markedly decreased and the kinetic curve demonstrates more benign enhancement similar to normal breast tissue. MRI finding suggest response to therapy and reflects final pathology with only residual isolated tumor cells measuring 0.5mm and post-therapy effect

Fig. 5.4
58 year old female with hormonal positive right breast invasive lobular carcinoma treated with 8 cycles of weekly Taxol and Fluorouracil, Epirubicin and Cyclophosphamide (FEC) for 5 cycles. Physical exam suggested clinical response. (a) Axial post-contrast fat-saturated MRI revealed diffuse non-mass enhancement with delayed washout curve, compatible with multicentric disease. (b) Axial post-contrast fat-saturated MRI after NAC showed little change with persistent diffuse enhancement. Patient had mastectomy revealing residual 13 cm tumor with 10% viable tumor cellularity
5.6 Functional MRI Assessment: Diffusion-Weighted MRI
DWI can provide additional information to contrast enhanced MRI since DWI uses motion-sensitizing gradient techniques to assess the movement of water molecules and can characterize cell density, membrane integrity, viscosity, and microscopic cellular environment. DWI technique requires little time for image acquisition and evaluation, between 2 and 5 min. The concept behind DWI is that diffusion of water molecules is restricted or decreased in tissues with high cellularity such as malignant tumors, compared to benign lesions or normal breast tissue. Breast tumor, with restricted diffusion, appears bright on DWI and dark on parametric apparent diffusion coefficient map (ADC). The ADC map is created to compensate for the T2 shine-through artifact that occurs with diffusion weighted images. ADC values correlate inversely with the tissue cellularity i.e. tumor has lower ADC than benign breast lesions, and benign breast lesions have lower ADC than normal breast tissue. Quantitative analyses are employed to distinguish between zones of viable cells, edema, and necrosis for treatment planning. Serial changes in tissue cellularity in response to therapy are measurable by diffusion using various quantitative methods that include whole-tumor ADC average, histogram analysis, and pre-treatment versus post-treatment voxel-based differences.
NAC is cytotoxic and damage or kill cells, altering the cell membrane and integrity. This change is hypothesized to cause an increase in water mobility and is demonstrated on imaging as an increase in ADC on DWI. The increase in ADC may allow detection of earlier therapy changes or response to therapy, with the hope of predicting treatment outcome. However, the practice and techniques for DWI are not standardized and its role in response assessment remains an active area of research. Small sample-size single center studies have reported that an increase in tumor ADC or a change in tumor ADC after the first cycle of therapy or early treatment time point is predictive of response to therapy, and is observed even before a change in tumor size or vascularity is detected [53–55]. The ADC measurements from pretreatment DWI did not predict response to therapy in breast cancer [56–59]. The combination of contrast enhanced breast MRI with DWI had the best diagnostic performance than the individual techniques [59]. When compared to tumor size prediction on MRI, ADC performed better in predicting responders from non-responders with reported sensitivity of 100% compared to 50% for volume and 70% for diameter measurements [60]. The preliminary results on DWI from these single centers are promising for ADC as a prognostic indicator of treatment response. Multicenter trials are needed to standardize this technique as well as verify the findings of single center studies.
5.7 Multicenter Clinical Trials: I-SPY Trials
The I-SPY TRIAL (Investigation of Serial studies to Predict Your Therapeutic Response with Imaging And moLecular analysis) is a clinical trials platform integrating molecular and imaging biomarkers to evaluate treatment response for women receiving NAC for breast cancer [60–62]. As part of the first phase of I-SPY (I-SPY “1”), American College of Radiology Imaging Network (ACRIN) trial 6657 was performed to test dynamic contrast-enhanced (DCE) MRI for ability to predict response to treatment and risk of recurrence in patients with stage 2 or 3 breast cancer. Women with T3 tumors measuring at least 3 cm in diameter by clinical exam or imaging and receiving NAC with an anthracycline-cyclophosphamide (AC) regimen alone or followed by a taxane were eligible to enroll. MRI were performed within 4 weeks prior to starting AC chemotherapy (MRI1), at least 2 weeks after the first cycle of AC and prior to the second cycle of AC (MRI2), between AC treatment and taxane therapy if taxane was administered (MRI3), and after the final chemotherapy treatment and prior to surgery (MRI4). The study schema is shown in Fig. 5.5. 237 patients were enrolled between May 2002 and March 2006, of which 230 met eligibility criteria. In an initial analysis MRI was found to be strongly associated with both pCR and residual cancer burden (RCB), with the greatest advantage over clinical assessment found early in treatment using a volumetric measurement of tumor response [63]. In further analysis of the volumetric approach, functional tumor volume (FTV), a metric measured by applying contrast-enhancement thresholds to MR images, was evaluated for prediction of RFS. FTV was found to be highly associated with RFS and a stronger predictor than pCR. Predictive performance was highest when FTV was combined with histopathologic variables (pCR and RCB) and tumor subtype (HR/HER2) [64]. FTV predicted RFS as early as after one cycle of AC chemotherapy and exploratory Kaplan-Meier analyses suggested that both the optimal timing and predictive performance were different among subtypes defined by HR/HER2 status.


Fig. 5.5
I-SPY 1 TRIAL/ACRIN 6657 trial schema. MRI exams were performed prior to starting AC chemotherapy (MRI1), prior to the second cycle of AC (MRI2), between AC treatment and taxane therapy (MRI3), and after the final chemotherapy treatment (MRI4)
The second phase of I-SPY (I-SPY “2”), is an adaptive, phase II clinical trial designed to identify promising new agents for breast cancer with a high probability of success in a subsequent phase III trial. In I-SPY 2, patients are screened to identify those with high risk of recurrence according to the Mammaprint 70-gene signature, ER and PR hormone receptor status (HR) and HER2 receptor status. The MammaPrint test is a genomic test that analyzes the activity of certain genes in early-stage breast cancer. Low risk patients, defined as Mammaprint low, HR+ and HER2-, do not continue to the experimental treatment phase of the trial. Included patients are randomized to one of several sub-arms testing either paclitaxel alone or paclitaxel in combination with an investigational new drug, selected on the basis of phase I safety data and preliminary evidence of efficacy in the HER2+ and/or HER2- population. Following the taxol-based regimen, all patients continue to standard chemotherapy with doxorubicin and cyclophosphamide. As part of the adaptive design of I-SPY 2, change in MRI FTV measured at serial time-points during chemotherapy is used to adjust the randomization schema as the trial proceeds. Drugs “graduate” from I-SPY 2 when they reach a Bayesian predictive probability of achieving 80% success in a subsequent phase III study, but can be dropped for futility if statistical significance is not reached after a predetermined number of patients have been assigned to that drug arm. Drugs graduate within subtypes defined by hormone receptor (HR) status, HER2 status and Mammaprint score. I-SPY 2 opened in March 2010 at 20 clinical sites. As of January 2016, 3 agents have graduated from I-SPY 2. In addition to incorporating MRI for FTV measurement in I-SPY 2, an imaging science component was added to test DWI. Similarly to the earlier ACRIN 6657 trial, ACRIN 6698 was designed to prospectively test ADC measurements from DWI for ability to predict response to treatment. ACRIN 6698 opened as an imaging sub-study of I-SPY 2 in 2012 and reached its accrual target in January 2015. The results from ACRIN 6698 are currently being analyzed.
Stay updated, free articles. Join our Telegram channel

Full access? Get Clinical Tree


