AJCC/UICC lymph node classification by Mountain and Dresler
Laterality
Localisation (for detailed description, see Chapet et al. 2005)
Accessible by
EBUS-FNA
Mediastinoscopy
Superior mediastinal nodes
Highest mediastinal
1
R/L
Upper limit sternal notch, above brachiocephalic (left innominate) vein
Yes
Yes
Upper paratracheal
2
R/L
Below lymph node station 1, above top of aortic arch. Located posteriorly the great vessels and anteriorly the trachea
Yes
Yes
Prevascular/retrosternal
3A
Bilateral
Upper limit sternal notch, lower limit carina. Located posteriorly the sternum and anteriorly the great arteries
No
No
Retrotracheal
3P
Bilateral
Upper and lower limit as for 3A. Located posteriorly of the trachea and until 1 cm ventral of vertebral bodies
No
No
Lower paratracheal
4
R/L
Upper limit top of aortic arch, lower limit top of upper lobe bronchus
Yes
Yes
Aortic nodes
Subaortic (aortopulmonary window)
5
L
Lateral to aorta/ligamentum arteriosum/left pulmonary artery and proximal to first branch of pulmonary artery
No
No
Para-aortic (ascending aorta or phrenic nerve)
6
Bilateral
Anterior and lateral to ascending aorta and aortic arch or the innominate artery
No
No
Inferior mediastinal nodes
Subcarinal
7
Bilateral
Caudal the tracheal carina, not associated with lower lobe bronchi or arteries
Yes (anterior)
Yes (anterior/posterior)
Paraoesophageal
8
Bilateral
Adjoining the oesophageal wall and bilateral the midline, excluding subcarinal nodes
No
No
Pulmonary ligament
9
Within the pulmonary ligament
No
No
N1 nodes
Hilar
10
R, peribronchial; L, trachea-bronchial
Proximal lobar, distal to mediastinal pleural reflection and nodes adjacent to bronchus intermedius right
Yes
No
Interlobular
11
R/L
Intrapulmonary, between the lobar bronchi
Yes
No
Lobular
12
R/L
Adjacent to distal lobar bronchi
Yes
No
Segmental
13
R/L
Adjacent to segmental bronchi
Yes
No
Subsegmental
14
R/L
Adjacent to subsegmental bronchi
Yes
No
Concerning the communication of biopsy findings, in comparison to imaging, postoperative staging and transfer into target volumes, the anatomical classification of nodal stations originally proposed by Mountain and Dresler (1997) is of great help. Its standardised use in a lung cancer treatment facility will improve patients’ outcome, as it will help to avoid geographical miss. An overview of the Mountain-Dresler stations is displayed in Table 5.1 and Fig. 5.1. For radiotherapy treatment planning purposes, a very helpful interdisciplinary atlas has been provided by the University of Michigan (Chapet et al. 2005), describing detailed anatomical borders for all relevant nodal stations.
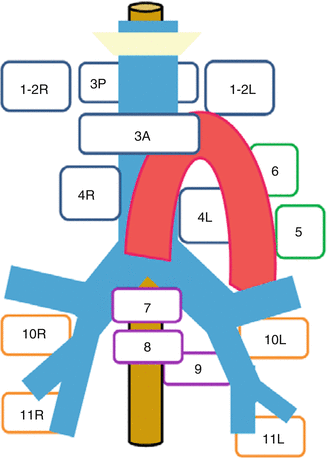

Fig. 5.1
Schematic illustration of the main Mountain-Dresler lymph node stations
5.2.2 Normal Tissues
Normal tissues in the chest, including the healthy lungs, oesophagus, heart, brachial plexus and spinal cord, are often limiting the dose of radiotherapy. These dosimetric limits globally guide daily practice, but delineation itself is often not standardised between institutions. Some research groups like the EORTC and RTOG have therefore initiated standardisation of OAR delineation within their protocols. Evaluation of planning data has shown that the effect of varying OAR delineations on treatment planning can be significant and will influence treatment decisions and outcome both in clinical trials and daily routine practice (Collier et al. 2003). In this context, delineation atlases have been published, which provide guidelines for normal tissue contouring (Kong et al. 2011; Feng et al. 2011).
Standardised delineation is clearly linked to the use of guideline dose/volume restrictions for treatment plan optimisation and evaluation. Most reliable data hereon can be derived from the QUANTEC reviews (see below) and actual treatment protocols, as shown in Table 5.2 for conventional fractionated radiotherapy and in Table 5.3 for SBRT.
Table 5.2
Dose constraints for normal tissues in the chest as used for conventional radiotherapy (fraction dose 1.8–2.0 Gy) according to study protocols and literature reports
Lung | Sources | |
V20 Gy (for lungs minus GTV) | ≤30–35 % | QUANTEC (Marks et al. 2010) |
≤35 % | PET-Plana | |
V20 Gy (for lungs minus CTV) | ≤37 % | RTOG 0617a |
V20 Gy (for lungs minus PTV) | ≤30 % | RTOG 0117a |
≤35 % | Converta | |
≤31 % after lobectomy | LungARTa | |
≤22 % after pneumectomy | ||
V20 Gy (combined lung volume) | <35 % | RTOG 0972/CALGB 36050a |
Mean lung dose (MLD) (for lungs minus GTV) | ≤20–23 Gy | QUANTEC (Marks et al. 2010) |
<20 Gy | PET-Plan,a PET-Boosta | |
Mean lung dose (MLD) (for lungs minus CTV) | ≤20 Gy | RTOG 0617a |
V5 Gy | ≤65 % | Jo et al. (2014) |
Oesophagus | Sources | |
Mean oesophageal dose (MED) | ≤34 Gy | RTOG 0117a |
RTOG 0617a | ||
PET-Plana | ||
V35 Gy | <80 % | PET-Boosta |
V55 Gy | ≤30 % | RTOG 0117a |
PET-Plana | ||
Volume dose | >40–50 Gy: risk of acute oesophagitis | QUANTEC (Werner-Wasik et al. 2010) |
Maximum dose (segment) | 74 Gy | QUANTEC (Werner-Wasik et al. 2010) |
Heart | Sources | |
Whole organ | ≤40 Gy | RTOG 0117a, RTOG 0617a |
V25 Gy | <10 % (<1 % risk of cardiac mortality) | QUANTEC (Gagliardi et al. 2010) |
V35 Gy | ≤30 % | LungARTa |
V40 Gy | ≤50 % | PET-Plana |
V45 Gy | <2/3 of heart | RTOG 0617a |
V60 Gy | <1/3 of heart | |
V50% | <33 Gy | Converta |
≤50 % of total (PTV) dose | ||
Maximum dose | 0.5 cc ≤76 Gy | PET-Boosta |
Spinal cord | Sources | |
Maximum point dose (0.5 cc) | ≤45 Gy | RTOG 0117a |
LungARTa | ||
≤48 Gy | Converta | |
PET-Plana | ||
≤50 Gy | RTOG 0972/CALGB 36050a | |
≤50.5 Gy | RTOG 0617a | |
≤51 Gy | PET-Boosta | |
Risk of myelopathy by dose (full-thickness cord including cord cross section) | 50 Gy: 0.2 % | QUANTEC (Kirkpatrick et al. 2010) |
54 Gy <1 % | ||
60 Gy: 6 % | ||
61 Gy <10 % | ||
69 Gy: 50 % | ||
Brachial plexus | Sources | |
Maximum point dose | ≤60 Gy | Forquer et al. (2009) |
≤66 Gy | PET-Boosta | |
Table 5.3
Dose constraints for normal tissues in the chest as used for stereotactic body radiotherapy (SBRT; fraction dose >5 Gy) according to study protocols and literature reports
Lung | Sources | ||
Volume constraints (for lungs minus GTV) | <1,500 cc V12.5 Gy | 5 fx | RTOG 0813 |
<1,000 cc V13.5 Gy | 5 fx | ||
V20 Gy | ≤10 % | 3 fx | RTOG 0618 |
Oesophagus | Sources | ||
Maximum dose/volume constraints | ≤27 Gy | 3 fx | RTOG 0618a |
1 cc ≤24 Gy (3 fx) | 3 fx | ROSELa | |
1 cc ≤27 Gy | 5 fx | ||
<5 cc ≤ V27.5 Gy (nonadjacent wall) | 5 fx | RTOG 0813a | |
0.5 cc ≤40 Gy | 8 fx | EORTC 22113-08113 LungTecha | |
Heart (or pericardium) | Sources | ||
Maximum dose/volume constraints | ≤30 Gy | 3 fx | RTOG 0618a |
1 cc ≤24 Gy | 3 fx | ROSELa | |
1 cc ≤27 Gy | 5 fx | ||
<15 cc ≤ V32 Gy | 5 fx | RTOG 0813a | |
0.5 cc 63 Gy | 8 fx | EORTC 22113-08113 LungTecha | |
Spinal cord | Sources | ||
≤18 Gy | 3 fx | RTOG 0618a | |
Any point ≤18 Gy | 3 fx | ROSELa | |
Any point ≤25 Gy | 5 fx | ||
30 Gy | 5 fx | RTOG 0813a | |
<0.25 cc ≤ V22.5 Gy | |||
<0.5 cc ≤ V13.5 Gy | |||
0.5 cc 32 Gy | 8 fx | EORTC 22113-08113 LungTecha | |
Brachial plexus (ipsilateral) | Sources | ||
Maximum dose/volume constraints | ≤24 Gy | 3 fx | RTOG 0618a |
1 cc ≤24 Gy | 3 fx | ROSELa | |
1 cc ≤27 Gy | 5 fx | ||
<3 cc ≤ V30 Gy | 5 fx | RTOG 0813a | |
≤32 Gy | |||
0.5 cc 38 Gy | 8 fx | EORTC 22113-08113 LungTecha | |
≤1 cc 15 Gy | 1 fx | Forquer et al. (2009) | |
≤1 cc 19 Gy | 2 fx | ||
≤1 cc 22.95 Gy | 3 fx | ||
≤1 cc 27 Gy | 4 fx | ||
≤1 cc 31 Gy | 5 fx | ||
≤1 cc 33.3 Gy | 6 fx | ||
Chest wall | Sources | ||
Maximum dose | <30 cc V30 Gy | 3–5 fx | Dunlap et al. (2010) |
Skin | Sources | ||
Maximum dose any point | ≤24 Gy | 3 fx | RTOG 0618a |
Great vessels | Sources | ||
Volume dose maximum | >10 cc ≤ V47 Gy | 5 fx | RTOG 0813a |
Trachea and main stem bronchus | Sources | ||
Maximum dose | ≤30 Gy | 3 fx | RTOG 0618a |
1 cc ≤30 Gy | 3 fx | ROSELa | |
1 cc ≤32 Gy | 5 fx | ||
<4 cc (nonadjacent wall) ≤ V18 Gy | 5 fx | RTOG 0813a | |
0.5 cc 44 Gy | 8 fx | EORTC 22113-08113 LungTecha | |
5.2.2.1 Lung
The lung is the largest and the most radiosensitive organ in the chest and thus it is frequently the dose-limiting organ. Numerous publications have addressed the importance of dosimetric and clinical parameters in the context of radiation-induced lung toxicity (RILD) (Marks et al. 2010). This disease appears in two phases with an acute phase within several weeks after treatment initiation, followed by an irreversible fibrosis which usually appears weeks to months after radiotherapy. Both may be life threatening and only symptomatic treatment is available. For the prediction of toxicity, clear dose-response and volume and fractionation effects have been shown, and multiple clinical factors like age, smoking habits and chemotherapy are known to influence the risk. However, the clinical factors do not adequately characterise patients at high risk for RILD (Dehing-Oberije et al. 2009), and therefore most groups use radiotherapy-derived parameters as surrogates, in order to adjust the radiotherapy plans. Among these, most commonly used are V20 (representing the relative lung volume receiving more than 20 Gy) and the mean lung dose (MLD). It should be noted that although certain levels (e.g. V20 <35 % or MLD <20 Gy; see Tables 5.2 and 5.3) have been considered “safe”, a relevant proportion of patients may still develop severe RILD after lower doses (De Ruysscher et al. 2010).
Furthermore, most toxicity data are derived from conventional 3D conformal radiotherapy, and solid data are lacking relating dosimetric parameters from modern IMRT techniques to toxicity. In this context, it has been suspected that large lung volumes receiving low doses of irradiation may be at risk for RILD (Kristensen et al. 2009). Some groups have therefore recommended a restriction of the V5 (lung volume receiving more than 5 Gy) to, for example, 65 % (Jo et al. 2014).
For a reasonable use of dosimetric parameters, delineation of the lungs should be institutionally standardised. The volumes delineated should include both lungs (separately and jointly) minus the GTV and should exclude air spaces that do not contain lung tissue (like the trachea and main bronchi) and also the free air outside the lung. When automatic contouring algorithms are used, their results must be carefully checked before radiation plan optimisation to assure lower recessus inclusion, to correct erroneous exclusion of lung volumes with increased density or to identify incorrect addition of right and left lungs.
5.2.2.2 Oesophagus
When treating mediastinal pathology with escalating doses, the importance of the oesophagus as a critical structure may even outpace the lungs. This is because in a serial normal tissue (as the oesophagus), small volume of late sequelae like ulcers and fistulae may completely compromise otherwise beneficial treatment effects.
According to a large body of literature, e.g. the QUANTEC data (Werner-Wasik et al. 2010), transient grade 3–4 oesophagitis is rare (<5 %) with conventionally fractionated radiotherapy alone but may rise up to 30 % in the context of concurrent radiochemotherapy for locally advanced NSCLC (Werner-Wasik et al. 2010; De Ruysscher et al. 2007). Multiple parameters, e.g. the mean oesophageal dose (MED), V20, V35, V50, etc., have been shown to correlate with the incidence of oesophagitis (Werner-Wasik et al. 2010; De Ruysscher et al. 2007), of which the most robust parameter may be the MED (Table 5.2). Fortunately, grade 3–4 oesophagitis generally heals within weeks after radio(chemo)therapy, and severe late effects will only occur in less than 1 % of cases. Therefore, the possibility to deliver curative radiochemotherapy should be generally prioritised over the avoidance of acute oesophagitis. In this context, current recommendations allow a rather high risk of acute oesophageal reactions.
In times of SBRT moving more close to the mediastinum, the risk of severe late oesophageal toxicity like strictures, fistulae and ulcers after hypofractionated high-dose radiotherapy will be an issue (Table 5.3). Until now, there are only retrospective estimates and case reports (Onimaru et al. 2003; Senthi et al. 2013) advocating caution with high hypofractionated doses applied to the oesophagus and calling for prospective clinical data collection.
For delineation, the oesophagus is a challenging organ with shifting morphological borders (related to deglutition and various filling) resulting in a large interobserver contour variability (Collier et al. 2003). The organ should be contoured using mediastinal windowing on CT including the mucosa, submucosa and all muscular layers out to the fatty adventitia. To assure accurate use of dose/volume data for planning optimisation, the oesophagus should always be delineated from the cricoid cartilage to the gastric entrance. The identification of the organ may be eased by searching for air-filled parts of the lumen and by the interpolation of contours in order to bridge areas of difficult detectability. Furthermore, side by side reviews of the diagnostic CT scans can be of help. Barium swallows with the planning CT have also been recommended, although this could affect the dose computation and change the anatomic shape of the organ. For standardisation of oesophagus contouring, again the use of an atlas like that of the University of Michigan (Kong et al. 2011) is recommended.
5.2.2.3 Heart
The heart, whose radiosensitivity has been neglected for decades, is a complex organ with several anatomical subvolumes resulting in various and mainly late radiation-induced changes. Presently, there is only limited data relating dosimetric parameters with cardiac toxicity in patients with lung cancer (Gagliardi et al. 2010). Clinical factors like age, cardiovascular risk factors and comorbidities appear to increase the risk of injury.
Radiotherapy involving the heart has been shown to lead to a measurable increase in the risk of coronary artery disease (CAD) in breast cancer patients. In a prognostically favourable cohort of 2,168 patients with a mean heart dose of 4.9 Gy, this risk starts already at very low doses with an increase of the risk of 7.4 % per Gy mean heart dose (Darby et al. 2013). Beyond CAD, other late effects like pericarditis, myocardial failure and valve dysfunction have been described (Gagliardi et al. 2010). Early effects may show up as arrhythmias. According to the QUANTEC review (Gagliardi et al. 2010), in the context of partial irradiation, conservative (NTCP) model-based estimates predict that a V25 Gy <10 % (in 2 Gy per fraction) will be associated with a <1 % probability of cardiac mortality until 15 years after RT. However, the data supporting these figures have lots of weaknesses, among others the fact that they are all derived from the 2D or 3D planning era and that no subvolume informations are available. Therefore, the generation of prospective dose volume data with subvolume reporting in the situation of modern IMRT techniques will lead to a more solid estimation of risks and more robust dosimetric parameters for plan optimisation and evaluation. Present recommendations for planning restrictions concerning the heart in lung cancer patients are given in Tables 5.2 and 5.3 for conventional fractionation and SBRT, respectively.
For the delineation of the heart, various strategies have been followed. Currently, contouring of the whole organ including the pericardium and the base of the organ is widely recommended, while isolated contouring of the left ventricle as the “only relevant structure” should be regarded obsolete. Contouring should start just below the level in which the pulmonary trunk branches into the left and right pulmonary artery and end inferiorly where the heart blends with the diaphragm (the heart apex). Even if there is no heart muscle visible within the pericardium, this should be included in the contours, as cardiac vessels run in the fatty tissue (Feng et al. 2011). In order to generate data for subvolume effects, the additional contouring of certain subvolumes like the coronary arteries or the valves followed by toxicity evaluation will be of great help.
For contouring the whole organ in clinical routine, again an atlas published by the University of Michigan is a useful tool (Feng et al. 2011).
5.2.2.4 Spinal Cord
The spinal cord tolerance, like in other organs, is a sliding scale, complicated by the fact that due to extremely careful prescriptions, reports on radiotherapy-induced spinal toxicity are very rare. The estimated risk of myelopathy to the full-thickness cord is <1 % after 54 Gy and <10 % after 61 Gy of conventionally fractionated radiotherapy (Kirkpatrick et al. 2010). Among the factors that are most commonly described to influence the incidence of myelopathy are dose, fractionation and treated volume (Tables 5.2 and 5.3). Unfortunately, the symptomatic treatment currently available for spinal cord radiation-induced toxicity is nonspecific and of limited efficacy. Due to the very severe impairment of quality of life by radiation-induced myelitis, tight restrictions of the maximum dose are standard for treatment planning and evaluation (Tables 5.2 and 5.3).
In lung cancer patients, the challenge of re-irradiation may arise. Concerning the spinal cord, solid literature-based recommendations by Nieder et al. are available (Nieder et al. 2006). In their analysis, no case of radiation myelopathy was observed, when the BED of each RT series was below 98 Gy2, with cumulative BED below 120 Gy2 (i.e. 60 Gy/2 Gy), and a minimum interval of 6 months had been respected between RT series.
For a safe contouring of the spinal cord, which may not be clearly depicted by the planning CT and whose position within the spinal canal may vary, the bony limits of the spinal canal are considered suitable landmarks. They should be used for routine contouring as most of the published clinical data refer to this kind of reference. With IMRT, the spinal canal should be contoured through the entire planning CT, in order to avoid spinal cord radiation from a direction which may not be accounted for by the radiation oncologist.
5.2.2.5 Brachial Plexus
Neurotoxicity of the brachial plexus has been more often described among patients with breast cancer (Delanian et al. 2012) who received radiotherapy, but some reports are also available for lung cancer patients leading to the current recommendation to restrict the maximum dose to 66 Gy in conventional fractionation (Table 5.2). Forquer et al. (2009) reported stereotactic body radiotherapy for apical lesions carrying a risk of brachial plexopathy. In their analysis, different grades of brachial plexopathies were noticed in 7/37 patients who received SBRT for apical lung malignancy. Based on these data, the authors suggested to restrict the maximal brachial plexus dose to less than 27 Gy, delivered in 3–4 fractions (Table 5.3). However, there may be cases where even a relatively high risk of a brachial plexus toxicity may be acceptable in order to achieve tumour control.
Contouring of the brachial plexus remains a challenge, due to poor visualisation on planning CTs and significant changes in regional morphology related to arm positioning. Contouring techniques and landmarks have been previously described in the University of Michigan atlas (Kong et al. 2011). Generally, the brachial plexus is situated within the fatty tissue between scalene musculature and subclavian vessels extending in craniocaudal direction from C4/C5 to T1/T2 nerve roots.
5.2.2.6 Chest Wall
Unlike the situation in conventional radiotherapy of lung cancer where chest wall toxicity is negligible, in SBRT the chest wall and ribs are considered organs at risk. In an analysis of 46 consecutive patients, Taremi et al. identified dose, age and female gender as risk factors for the development of chest wall toxicity after SBRT (Taremi et al. 2012). Approximately 5 % of patients will suffer from rib fractures after 3 × 9 Gy given to a 2 cm3 chest wall volume (Pettersson et al. 2009). Therefore a dose of less than 30 Gy, delivered in 3–5 fractions on less than 30 cm3, has been recommended, to limit chest wall toxicity (Dunlap et al. 2010).
The chest wall should be delineated including the ribs and intercostal muscles but excluding the other muscles and skin. If possible it may be auto-segmented starting from the corrected lung edges with a 2 cm expansion in anterior, posterior and lateral directions (Kong et al. 2011).
5.2.2.7 Central Mediastinal Structures in SBRT
Beyond the oesophagus and heart, in times of high-dose hypofractionated radiotherapy moving closer to the midline structures, organs will be at risk, whose toxicity has not played a major role in times of conventional fractionation. The observation of severe bronchial stenosis and fistula as late as >2 years after >80 Gy (Miller et al. 2005) and a high rate of fatal toxicities after SBRT to central tumours (Timmerman et al. 2006) have led to a “no-fly zone” of 2 cm around the bronchial tree. However, the beneficial results of SBRT to peripheral lung tumours call for the propagation of these concepts also for central tumours. The VU Amsterdam group has published a thorough review of reported toxicities after SBRT of central tumours showing a rate of 8.6 % grade III/IV toxicity and a 2.7 % rate of treatment-related mortality (Senthi et al. 2013). However, due to the retrospective character of this study and multiple confounding comorbidities in patient cohorts, the risk of severe toxicity may be underestimated (Nestle et al. 2013). At present, no clear constraints for central mediastinal structures can therefore be given except historical estimates and those which are presently included in several ongoing international multicentre trials on this question (e.g. EORTC 22113-08113 LungTech or RTOG 0813; Table 5.3). The final results of these large studies are expected to provide a better insight into the outcome and toxicity of such treatment concepts.
5.3 Pathology of Tumour Spread
The most recent 7th edition of TNM and ISS classification for lung cancer (Goldstraw et al. 2007) is proposing a complex description of the primary tumour according to its size, location and multicentricity. For regional nodal involvement, ipsi- or contralaterality of metastatic nodes with respect to the primary tumour remains pre-eminent, while M staging has also been revised to better reflect treatment options (Tables 5.4 and 5.5). An additional classification to account for nodal size and diagnostic pathways has been proposed by Robinson and Ruckdeschel, refining N2 lymph node staging (Robinson et al. 2007). This subclassification of locally advanced disease has proved relevant for the therapy decision-making: surgical resection and neoadjuvant or definitive radiochemotherapy (Table 5.6).
Table 5.4
TNM classification for lung cancer (7th edition; 2009)
Primary tumour (T) | |
T1 | Tumour 3 cm or smaller and surrounded by lung or visceral pleura or endobronchial tumour distal to the lobar bronchus, without bronchoscopic evidence of invasion more proximal than the lobar bronchus (i.e. not in the main bronchus) |
T1a: tumour ≤2 cm | |
T1b: tumour >2 cm and ≤3 cm | |
T2 | Tumour greater than 3 and up to 7 cm |
T2a: tumour >3 cm and ≤5 cm | |
T2b: tumour >5 cm and ≤7 cm | |
or | |
Invasion of the visceral pleura | |
Atelectasis or obstructive pneumonitis that extends to the hilar region but involves less than the entire lung | |
Involvement of the main bronchus ≥2 cm or more distal to the carina | |
T3 | Tumour greater than 7 cm |
or | |
Tumour with atelectasis or obstructive pneumonitis of the entire lung
Stay updated, free articles. Join our Telegram channel
Full access? Get Clinical Tree
 Get Clinical Tree app for offline access

| |
