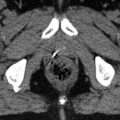
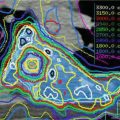
Fig. 6.1
Illustration of the eight liver segments in selected slices of the liver from in a transversal CT scan. Numbers indicate the respective segments of the liver
The grouping of the liver segments is independent from the macroscopic architecture of the lobes that are essentially caused by the peritoneal sulcus and by the liver fissures. The left sagittal fissure is caused by the venous ligament (Lig. arantii, a relic of an embryonal anastomosis between the portal vein and the inferior vena cava) and by the falciform ligament containing the obliterated umbilical vein (Lig. teres) in its caudal edge. The peritoneal duplications of the left hepatic fissure embrace the porta hepatis, and they represent the anatomic demarcation between the lobes subdividing the caudal surface into two regions: the hepatorenal space is to the right and the hepatogastric space is to the left. The caudal surface is completely covered by the peritoneum, and therefore it is mobile with respect to the neighbouring organs. The liver slides across the stomach on the left side and across the duodenum, the colonic flexure and the right kidney on the right side. The contact surfaces to these organs are recognised by corresponding impressions of the caudal liver surface.
At the cranial surface of the liver (facies diaphragmatica), the falciform ligament divides into two sheets (Lig. coronarium or triangular hepatis dext. and sin.) enclosing a rhomboidal extraperitoneal field (area nuda or pars affixa). In this area the inferior vena cava intercalates deeply the liver tissue. Additionally the right adrenal and the cranial poles of the kidney are located in this area without peritoneal coverage. The pars affixa almost entirely is in the centrum tendineum of the diaphragm, and it locks the liver in its position. The thoracic pull and the inferior vena cava that receives several liver veins in this area as well as the appendix fibrosa support this effective fixation.
The demarcation of the area nuda is given by the two coronal ligaments (Lig. coronaria) running out into the ligament triangularia and then into the diaphragmal fascia. The peritoneal sulcus behind the liver is often tougher and is called Lig. hepatorenal or Lig. hepatocavoduodenale due to its location.
The pathways have a characteristic layout in the porta hepatis. The portal vein is posterior most, followed ventrally by the hepatic artery and its adventitial and vegetative neural plexus and by the extrahepatic bile ducts as well as the portal lymphatics. The liver veins do not open out into the porta hepatis but directly into the inferior vena cava in the area nuda. The arteries of the liver derive from the branches of the proper hepatic artery that takes its origin from the common hepatic artery and hence from the celiac trunk.
The lymphatic vessels of the liver mainly collect in the porta hepatis, and they reach the celiac lymph nodes and the paraaortic nodes, the cisterna chyli and the thoracic duct. Additionally there is a subserous, superficial lymphatic system on one hand towards the retrosternal and to the anterior mediastinal lymphatics and on the other hand dorsally to the juxtacaval and the posterior mediastinal lymphatics.
6.2 Pathology
Currently, the seventh edition of the UICC classification is in use (Sobin et al. 2009). There is a classification for hepatocellular carcinoma and one for intrahepatic bile ducts. Of relevance for radiotherapy in this context is also the classification of the perihilar extrahepatic bile ducts. The T categories are:
6.2.1 Hepatocellular Carcinoma
T1: solitary tumour without vascular invasion
T2: solitary tumour with vascular invasion or multiple tumours, none more than 5 cm in greatest dimension
T3: multiple tumours any more than 5 cm or tumour involving a major branch of the portal or hepatic vein(s)
T3a: multiple tumours any more than 5 cm
T3b: tumour involving a major branch of the portal or hepatic vein(s)
T4: tumour(s) with direct invasion of adjacent organs other than the gallbladder or with infiltration of visceral peritoneum
Together with the lymph node status discriminating N0 (no regional lymph node metastasis) and N1 (regional lymph node metastasis), this leads to the following stage grouping:
Stage | T category | N category | M category |
|---|---|---|---|
Stage I | T1 | N0 | M0 |
Stage II | T2 | N0 | M0 |
Stage IIIA | T3a | N0 | M0 |
Stage IIIB | T3b | N0 | M0 |
Stage IIIC | T4 | N0 | M0 |
Stage IVA | Any T | N1 | M0 |
Stage IVB | Any T | Any N | M1 |
6.2.2 Intrahepatic Bile Ducts
T1: solitary tumour without vascular invasion.
T2a: solitary tumour with vascular invasion.
T2b: multiple tumours, with or without vascular invasion.
T3: tumour perforates the visceral peritoneum or directly invoked adjacent extrahepatic structures.
T4: tumour(s) with periductal invasion.
Together with the lymph node status discriminating N0 (no regional lymph node metastasis) and N1 (regional lymph node metastasis), this leads to the following stage grouping:
Stage | T category | N category | M category |
|---|---|---|---|
Stage I | T1 | N0 | M0 |
Stage II | T2 | N0 | M0 |
Stage III | T3 | N0 | M0 |
Stage IVA | T4 | N0 | M0 |
Any T | N1 | M0 | |
Stage IVB | Any T | Any N | M1 |
6.2.3 Extrahepatic Bile Ducts: Perihilar
T1: tumour confined to the bile duct, with extension up to the muscle layer of fibrous tissue.
T2a: tumour invades beyond the wall of the bile duct surrounding adipose tissue.
T2b: tumour invades adjacent hepatic parenchyma.
T3: tumour invades unilateral branches of the portal vein or hepatic artery.
T4: tumour invades the main portal vein or its branches bilaterally, of the common hepatic artery, of the second-order biliary radicals bilaterally or unilateral second-ordered biliary radicals with contractual portal vein or hepatic artery involvement.
Together with the lymph node status discriminating N0 (no regional lymph node metastasis) and N1 (regional lymph node metastasis), this leads to the following stage grouping:
Stage | T category | N category | M category |
|---|---|---|---|
Stage I | T1 | N0 | M0 |
Stage II | T2a, T2b | N0 | M0 |
Stage IIIA | T3 | N0 | M0 |
Stage IIIB | T1, T2, T3 | N1 | M0 |
Stage IVA | T4 | N0, N1 | M0 |
Stage IVB | Any T | Any N | M1 |
6.3 Visualisation
6.3.1 Computed Tomography
Computed tomography (CT) is the most widely used imaging technique because it is commonly available, fast and affordable. It is strongly recommended to acquire a CT with diagnostic quality, using breath holding to yield an anatomically correct image of the tumour without breathing distortion. This image set should then be completed with 4D imaging to incorporate the tumour motion. Unfortunately, liver CT is limited by its inherently low tissue/tumour contrast. Because of this, it is necessary to apply IV contrast in all obtained CT scans. The contrast dye will significantly improve the tissue/tumour contrast and subsequently the ability to delineate the tumour. A recommended image resolution is 1 × 1 mm in a plane with a 2-mm slice thickness.
When using IV contrast, it is important to acquire the images during the right contrast phase according to the type of examined tumour.
Depending on histology, liver tumours may show a stronger enhancement during the arterial phase (~30 s after injection) and a lower enhancement during the venous phase (~50–60 s after injection) and the late delayed phase (~180 s after injection) compared to the surrounding liver tissue. This so-called washout phenomenon occurs faster in primary hepatocellular carcinoma (HCC) than in metastases, making it necessary to acquire multiple-phase scans and choose the optimal image set for treatment planning afterwards.
There is also a significant inter-patient variability of contrast dye enhancement that can be accounted for by using a small test bolus of IV contrast preliminary to the actual scan to determine the best time for imaging after IV contrast injection (Bruix and Sherman 2011).
It is also recommended to use oral contrast to facilitate the correct delineation of organs at risk, e.g. the stomach and the intestines.
Due to the differences in CT scanners, contrast dyes and workflows, injection protocols should be optimised for each institution before being used in clinical routine.
Another disadvantage of CT holds up especially for intrahepatic cholangiocarcinoma (CCC). While there is a high sensitivity for detection on IV contrast-enhanced CT, the infiltrative growth pattern of CCC hampers tumour delineation on the acquired images, thereby making alternative imaging (e.g. MRI) obligatory for target volume definition (Charbel and Al-Kawas 2011).
6.3.2 MRI
Compared to CT, magnetic resonance imaging (MRI) offers a higher contrast in soft tissues, especially on non-enhanced scans (Bolog et al. 2011). The variety of available MRI sequences (e.g. T1, T2, diffusion and spectroscopy) allows for detailed conclusions about the size of the investigated lesion, its surrounding edema and infiltration into surrounding tissue which improves target volume delineation and protection of normal tissues. The development of multi-detector CT has recently caught up to MRI concerning sensitivity, but its flexibility in the use of the different sequences and the considerably higher ability to distinguish benign from malignant lesions are still an unrivalled advantage of MRI (Glockner 2007; Ariff et al. 2009).
As in CT, the application of IV contrast after native image acquisition further increases the significance and validity of the MRI scan. Most contrast dyes are based on gadolinium compounds that depict the vascularisation of the investigated tissues. But more advanced agents like gadolinium ethoxybenzyl diethylenetriaminepentaacetic acid (Gd-EOB-DTPA), which are taken up specifically by liver cells, result in a tissue-specific contrast and make it possible to distinguish primary from secondary liver lesions. There are however some limitations to this method, because the cellular uptake of Gd-EOB-DTPA depends on functionally unimpaired liver tissue. This is especially relevant in the diagnosis of HCC due to the cirrhosis that can be appreciated frequently in these patients (Murakami et al. 2012). Another tissue-specific contrast agent is superparamagnetic iron oxide (SPIO), a substance that is taken up by the liver-immanent macrophages of the reticuloendothelial system, thereby leading to a negative contrast, particularly against non-liver tissues.
Disadvantages of MRI include the longer image acquisition time, making 4D imaging more difficult and increasing the dependence on patient compliance. Furthermore it bears higher costs, and the narrow gantry can limit the use of other technical equipment (e.g. stereotactic body frame, abdominal compression, etc.).
6.3.3 FDG-PET/CT
For reliable results, positron emission tomography (PET) should be combined with a co-registered CT scan to offer a better anatomical correlation of tracer enhancement. However, the most commonly used tracer (Hallman et al. 2012) fluorodeoxyglucose (FDG) shows a relatively poor sensitivity of 40–78 % for primary liver lesions and thus is not a useful tool for the improvement of target volume delineation (Goh et al. 2012; Corvera et al. 2008). But this does not hold up to the diagnosis of hepatic metastases, where FDG-PET/CT seems to be among the most reliable imaging techniques with a sensitivity of up to 95 %, though it will usually not add significant information to the target volume, if CT and MRI are already available (see also 6.5) (Sacks et al. 2011). The main use of FDG-PET/CT is therefore the search for nodal disease and distant metastases of the tumour in question – a very important role, especially in stereotactic, locally curative treatments. In newer studies PET was also deemed useful in treatment follow-up, especially metabolic response evaluation (Solanki et al. 2012).
6.4 4D Imaging
The method uses 4D imaging (CT, MRI, PET) to compensate for tumour motion. The images should be acquired in different breathing phases of the patient to track the complete tumour movement. Many liver tumours are only visible in CT with IV contrast, so identification of the tumour on 4D scans can prove particularly difficult. Prior implantation of fiducial markers can help to overcome this restriction (Fig. 6.2). Alternatively, contrast phases. native cine MRI or 4D-FDG-PET imaging are good solutions to the problem, the latter mostly for liver metastases. Also, the motion of surrogate landmarks, either anatomical (liver incisions/veins/boundary) or artificial ones (fiducials, surgical clips) is useful for contouring of ITV and for IGRT. These surrogates should not be seated too far from the tumour because of the changing anatomical shape of the liver itself during the breathing cycle. Thus, markers directly adjacent or within the lesion lead to the most accurate results (Seppenwoolde et al. 2011). A well-suited marker will reflect not only the translational movements of the target but also the rotational component of the liver motion and is radiopaque to allow for image-guided radiotherapy with cone-beam CT (CBCT) or fluoroscopy. Furthermore it is recommended to use three or more markers in an appropriate distance to one another to enable three-dimensional motion assessment. To achieve optimal results, the obtained 4D scans should be co-registered to the planning CT during target volume delineation.
Fig 6.2 Example of a gold fiducial marker in (a) transveral, (b) sagittal, and (c) coronal plane of the planning CT. (d) Cone beam CT on treatment of the same patient with positioning of the patient to gold markers
6.5 Target Volume Delineation
6.5.1 Gross Target Volume Delineation
Prior to delineation, all image sets (CT, MRI, PET, 4D sequences) should be co-registered, if technically possible with deformable registration. The tumour can then be demarcated according to its morphological properties. The basis should be an IV contrast-enhanced CT scan in the appropriate contrast phase, as mentioned earlier. The additional information of a contrast-enhanced MRI can prove to be useful in case of isodense tumours or malignancies with an infiltrative growth pattern. If an MRI with the required quality is not clinically available, PET can facilitate delineation but also bears its own technical difficulties like the correlation of the metabolic PET information to the anatomic position in the planning CT or the relatively high liver-background signal of some tracers (e.g. FDG).
Related posts:

Stay updated, free articles. Join our Telegram channel

Full access? Get Clinical Tree


