A standard concentration of bacteria in a broth or saline solution is spread confluently and uniformly over a blood or Mueller-Hinton agar.
Antibiotic-impregnated disks are placed on the plate and then incubated.
The antibiotic diffuses out, establishing a concentration gradient.
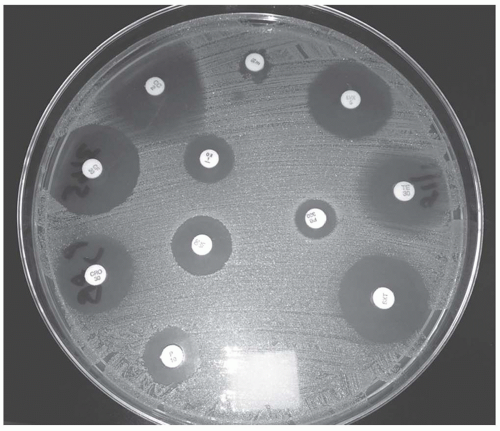
Figure 52-1. Kirby-Bauer disk diffusion allows antibiotic-impregnated disks to create a zone of inhibition. The zones are measured in millimeters and are compared to standard references to determine susceptible (S), intermediate (I), or resistant (R).
At a certain point, the antibiotic concentration is insufficient to inhibit the growth of the bacteria forming a ring or zone of inhibition.
See Figure 52-1
The zone of inhibition is measured and recorded.
Based on predefined set points, the antimicrobial is classified as S, I, or R.
Advantages include simplicity, inexpensiveness, and customizability of antimicrobials tested.
Disadvantages include the lack of an MIC, being time consuming to the microbiologist, and a possibility of interpretation error by the microbiologist manually measuring the zone.
Macrobroth uses test tubes with serial dilutions of antibiotic concentrations.
Microbroth uses serial concentration in a well plate.
Agar dilution uses plates of serial concentrations.
All are inoculated with a standard concentration and incubated.
The MIC is determined by the highest concentration that contains no visible growth.
The advantage is reliability as it is the gold standard for MIC testing.
The disadvantage is that these methods are time consuming and too labor-intensive for clinical practice.
Uses an antibiotic-containing strip with a numeric concentration gradient.
Bacteria are plated in a uniform manner with strips placed in a radial manner and allowed to incubate.
Bacteria will grow in an elliptical pattern based on the concentration gradient.
The MIC is determined by the point at which the ellipse crosses the strip.
See Figure 52-2
Since the strips can be placed on a wide range of media, fastidious organisms and other organisms requiring special growth media can be tested.
Strips may be supplemented with additional agents to detect certain resistance mechanisms.
Other advantages include simplicity and flexibility, useful with rarely tested antibiotics.
The disadvantage is that it is relatively expensive.
Uses an agar with increasing antibiotic concentrations spiraling out from the center of the plate.
An organism is streaked from the center of the plate outward.
The distance of growth determines susceptibility.
Although the method is expensive, inefficient, and rarely used, it may be valuable in detecting heteroresistance to vancomycin.
Breakpoints are established by a number of different organizations.
Food and Drug Administration (FDA)
Establishes the baseline breakpoints at the time of drug approval
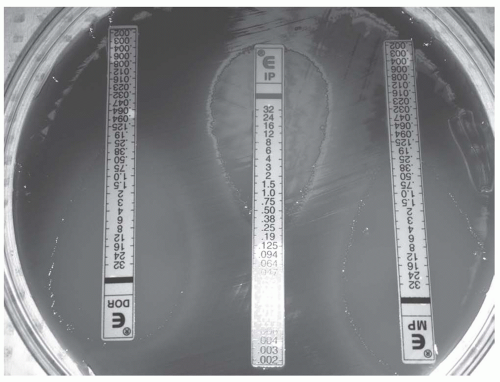
Figure 52-2. The E-strip contains a gradient of concentrations. The MIC is determined by visualizing where the ellipse crosses the strip.
Pharmaceutical companies play a major role in the contribution of data.
Rarely reevaluates
The Clinical and Laboratory Standards Institute (CLSI)
Formerly the National Committee for Clinical Laboratory Standards (NCCLS)
Nonprofit organization that develops consensus standards for the healthcare community.
Information regarding resistance mechanisms is also taken into consideration, often not available at the time of FDA approval.
The European Committee on Antimicrobial Susceptibility Testing (EUCAST)
Component of the European Society of Clinical Microbiology and Infectious Diseases
Publishes clinical breakpoints and available for download at www.eucast.org.
Both CLSI and EUCAST continuously update breakpoints on a yearly basis and as needed throughout the year.
The tables provide the MIC susceptibility breakpoint for Enterobacteriaceae (Table 52-1), Pseudomonas aeruginosa (Table 52-2), Acinetobacter spp. (Table 52-3), Staphylococcus aureus (Table 52-4), and Streptococcus pneumoniae (Table 52-5).
The establishment of clinical breakpoints is traditionally based on three key components: the distribution of the MIC’s, the pharmacokinetic/pharmacodynamic data, and the clinical outcomes
The distribution of MICs
Wild-type population without acquired resistance
Non-wild-type that may be harboring resistance patterns
Pharmacokinetic data of the antimicrobial agent
In vitro drug characteristics
Such as stability, MIC, and zone diameters
Site of action—ribosome, cell wall, cell membrane, DNA
Model for killing—time > MIC, AUC:MIC ratio, or concentration dependent
Post-antibiotic effect—present if the drug continues to kill despite undetectable levels
Bacteriostatic versus bacteriocidal
In vivo data such as pharmacokinetic properties and blood and tissue penetration bioavailability (if oral)
Serum peak concentration (Cmax)
Serum trough concentrations (Cmin)
Volume of distribution (Vd)
Tissue penetration
Cerebrospinal fluid penetration
Alveolar fluid penetration for pneumonia
Body fluids pertaining to the type of infection
Protein binding
Metabolism
Clearance
Elimination half-life
Special populations: renal and hepatic failure, obesity
The clinical outcomes
Must have at least 500 isolates
Clinical and microbiologic cure rates
Clinical correlation is useful; however, extremely difficult to evaluate due to the multitude of confounders.
Table 52-1 Breakpoints for Enterobacteriaceae
Antibiotic
EUCAST
CLSI
Comments
Ampicillin
8
8
Used for amoxicillin
Ampicillin-sulbactam
8/4
8/4
Piperacillin-tazobactam
8/4
16/4
Ticarcillin-clavulanate
8
16/2
Cefazolin
R
2
Based on 2 g q8
Ceftriaxone
1
1
Based on 1 g q24
Ceftazidime
1
4
Based on 1 g q8
Cefepime
1
8
Based on 1 g q8 or 2 q12
Doripenem
1
1
Based on 500 mg q8
Ertapenem
0.5
2
Based on 1 q24
Imipenem-cilastatin
2
4
Low-level resistance common in Morganella, Proteus, and Providencia
Meropenem
2
4
Aztreonam
1
4
Based on 1 g q8
Levofloxacin
1
2
Gentamicin
2
4
Based on high-dose extended interval dosing
Tobramycin
2
4
Based on high-dose extended interval dosing
Amikacin
8
16
Based on high-dose extended interval dosing
Tigecycline
1
ND
Limited activity against Proteus, Providencia, and Morganella
Colistin
2
ND
Trimethoprim-sulfa-methoxazole
2/38
2/38
Fosfomycin
32
64
E. coli urinary tract isolates only
Nitrofurantoin
64
32
Urinary isolates only
R, should be reported as resistant without testing; ND, not defined.
Deterministic approach versus probabilistic approach to establishing breakpoints.
Deterministic approach
Breakpoints established by adjusting the mean population pharmacokinetic parameters to the susceptibility of different pathogens
Many of the pharmacokinetic/pharmacodynamic properties are not taken into consideration.
Tends to yield potentially higher breakpoints than what is feasible in clinical practice
Probabilistic
A newer approach to breakpoint establishment that takes into account pharmacokinetic modeling
Attempts to what is likely to happen, not simply what could possibly happen
Tends to result in lower than previously established breakpoints
Table 52-2 Breakpoints for Pseudomonas aeruginosa
Antibiotic
EUCAST
CLSI
Comments
Piperacillin-tazobactam
16
16/4
Based on 4.5 g q6
Ticarcillin-clavulanate
16
16/2
Based on 3.1 g q6h
Cefepime
8
8
Based on 2 g q12 (CLSI) and q8 (EUCAST)
Ceftazidime
8
8
Based on 2 g q8
Doripenem
1
2
500 mg q8
Imipenem
4
2
Based on 1g q6 (EUCAST) and q8 (CLSI)
Meropenem
2
2
1 g q8
Aztreonam
1
8
Levofloxacin
1
2
Gentamicin
4
4
Based on high doses (5-7 mg/kg)
Tobramycin
4
4
Based on high doses (5-7 mg/kg)
Amikacin
8
16
Based on high doses (15-21 mg/kg)
Colistin
4
2
Table 52-3 Breakpoints for Acinetobacter spp.
Antibiotic
EUCAST
CLSI
Comments
Piperacillin-tazobactam
IE
16/4
Ticarcillin-clavulanate
IE
16/2
Ceftriaxone
R
8
Cefepime
R
8
Ceftazidime
R
8
Doripenem
1
NR
Imipenem
2
4
Based on 1 g q6
Meropenem
2
4
Levofloxacin
1
2
Gentamicin
4
4
Based on high doses (5-7 mg/kg)
Tobramycin
4
4
Based on high doses (5-7 mg/kg)
Amikacin
8
16
Based on high doses (15-21 mg/kg)
Colistin
2
2
Trimethoprim-sulfamethoxazole
2
2/38
Tigecycline
IE
NR
IE, insufficient evidence to define a breakpoint; R, should be reported as resistant without testing; NR, not reported.
Table 52-4 Breakpoints for Staphylococcus aureus
Antibiotic
EUCAST
CLSI
Comments
Penicillin
0.12
0.12
MIC <0.12 should be confirmed with disk diffusion.
Oxacillin
2
2
Ceftaroline
NR
NR
Resistant isolates not discovered
Vancomycin
2
2
MIC of 2 may have reduced response
Daptomycin
1
1
Tetracycline
1
4
If isolate susceptible, assume susceptible to doxycycline and minocycline
Minocycline
0.5
4
May be still be active even if resistant to tetracycline
Doxycycline
1
4
May be still be active even if resistant to tetracycline
Levofloxacin
1
1
Clindamycin
0.25
0.5
If D-test negative
Trimethoprim-sulfamethoxazole
2
2/38
Linezolid
4
4
Nitrofurantoin
NR
32
Telavancin
1
NR
Tigecycline
0.5
NR
NR, not reported.
The Monte Carlo simulation, for example, uses computer-generated model to create multiple scenarios.
The probability from low to high of achieving the desired outcome is reported.
Continuously updated as knowledge of pharmacokinetics and pharmacodynamics continues to increase and as new resistance mechanisms are introduced into the environment
Normalized MIC distributions
MIC reported in terms of standard deviations away from the wild-type mode of distributions
Takes into consideration that breakpoints are drug-species dependent and would allow for direct comparison between agents
Would allow direct comparison between agents
This may one day play an important role in objectifying antimicrobial susceptibility results.
Host immune response
Single most important factor
Many disease states and medications contribute to suppression of the immune system.
May also be inhibited by virulence factors of certain microorganismsRelated posts:

Stay updated, free articles. Join our Telegram channel

Full access? Get Clinical Tree


