Fig. 1
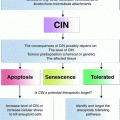
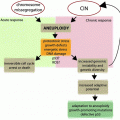
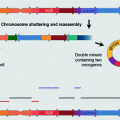
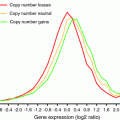
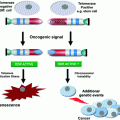
a HDAC2 and TXNL1 immunohistochemical detection in colorectal cancer specimens based on a tissue microarray. Image examples are given at 800-fold magnification. b Tissue-microarray-based immunohistochemical evaluation of HDAC2 and TXNL1 comparing diploid versus aneuploid colorectal carcinoma specimens. Immunoreactivity was scored with ‘‘0’’ showing no positivity, ‘‘1’’ presenting up to 20 % immunopositive cells, ‘‘2’’ up to 50 %, and ‘‘3’’ above 50 % stained cells. Bar plots of the TMA analysis confirmed HDAC2 and TXNL1 as significantly (asterisk) differentially expressed proteins between diploid and aneuploid tumors. Figure adapted from Gemoll et al. (2011)
2 Genomic Instability and Disease Prognostication in Breast Cancer
Breast cancer is one of the major causes of morbidity and mortality in females all over the world (Jemal et al. 2011). Despite the fact that tremendous progress has been achieved in chemotherapy and radiation therapy, breast cancer is still one of the most frequent malignancies with poor prognosis. The effects of independent prognostic factors for survival of breast cancer patients, including estrogen receptor/progesterone receptor (ER/PR) status, HER2 gene amplification and/or overexpression, tumor size, lymph node status, histological grade, and age have been thoroughly recognized (Ferguson et al. 2013). Especially the tumor, node, and metastasis (TNM) system has been extensively used. However, breast cancer is a malignant disease with multiple driving factors involved, and it has been reported that molecular mechanisms may affect tumor growth and progression, thereby potentially limiting the prognostic value of the TNM system (Coradini and Daidone 2004; Song et al. 2013).
Aneuploidy is, in general, correlated to cell proliferation and poor differentiation but not disease stage (Silvestrini 2000). However, Fallenius et al. (1988) demonstrated that node positive non-aneuploid tumors exhibited a better survival than node negative but aneuploid tumors, indicating that ploidy in this study cohort was a stronger prognostic marker than node assessment.
In 2006, Kronenwett et al. (2006) introduced a new concept to measure a tumor cell population with high levels of clonal heterogeneity. The stemline-scatter-index (SSI) is computed with the sum of the proliferation index, the variance of the diploid G0/G1 peak, and the 5c exceeding rate (5cER). Primarily based on the ploidy classification by Auer et al. (1980), the SSI is able to divide cytometrically assessed diploid, tetraploid and aneuploid samples into genomically stable and unstable subtypes. A total of 890 invasive breast cancer patients with a mean follow-up of 8.9 years were evaluated by using this algorithm and showed a significantly better survival of genomically stable subtypes compared with the unstable subtype within each ploidy category (0.04 < p < 0.004).
To evaluate potential differences in gene expression patterns between genomically stable and unstable breast tumors, Habermann et al. (2009) examined 17 diploid genomic stable, 15 aneuploid genomic stable, and 16 aneuploid genomic unstable breast carcinomas. A 12-gene expression signature associated with genomic instability in breast cancer was defined and demonstrated a biological and prognostic value across multiple different cancer entities (Habermann et al. 2009; Mettu et al. 2010). For breast cancer, genomic unstable carcinomas in patient cohorts from Sorlie et al. (2003), van de Vijver et al. (2002), Sotiriou et al. (2003) were associated with distinct shorter relapse-free survival and metastasis-free survival (p < 0.04; Fig. 2). All three studies were not analyzed regarding genomic stability/instability of the samples, initially. However, it was shown that the 12-gene signature is independent of clinicopathological factors such as lymph node status, the NIH criteria, the St. Gallen criteria, and grading used for breast cancer prognostication. In addition, gene sets of the MammaPrint® (van de Vijver et al. 2002; van’t Veer et al. 2002) and Oncotype DX® (Paik et al. 2004) tests—two clinically used breast cancer prognostic gene expression signatures—were used to predict genomic instability: 84 % (MammaPrint®) and 91 % (Oncotype DX®) of all cases were correctly classified. Along this line, Swanton et al. (2009) corroborated the importance of genomic instability by showing a link between aneuploidy-associated gene expression and poor response to taxane, a microtubule-stabilizing (MTS) agent. A pre-therapeutic assessment of genomic instability could therefore even optimize treatment stratification.
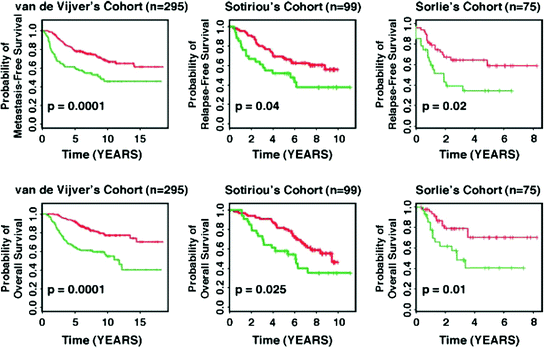

Fig. 2
Applying the 12-gene genomic instability signature for prediction of disease-free and overall survival in independent datasets using Kaplan-Meier analyses. The curves in red reflect carcinoma patients harboring the genomically stable signature, the curves in green represent patients with the one implying genomic instability. For all three examples, statistically significant association of genomic instability with shorter disease-free and overall survival was observed. Figure adapted from Habermann et al. (2011a, b)
In 2007, Yildrim-Assaf et al. (2007) published another example for histogram reclassification: Based on thresholds in the categories of 5cER (>10 aneuploid cells) and 9cER (>1 aneuploid cell), patients with node negative and positive breast cancers can be stratified into a high-risk subgroup with unfavorable prognosis. In total, 370 breast cancer patients showed histology grade, lymph node status, and the above-mentioned binary DNA histogram classification to be the three strongest relapse predictors in a Cox multivariate analysis. The significance of rare-event nuclei (5cER and 9cER) was emphasized by the work of Sidoni et al. (2001) who examined fresh scrape smears from 599 breast carcinomas. According to their results, single cell aneuploidy is a marker for genetic instability with an increased risk of tumor recurrences despite otherwise favorable prognostic parameters. The data seem in accordance with the concept of progressive genetic evolutionary changes in solid tumors (Bartek et al. 1990) and with the unfavorable prognostic significance of DNA hypertetraploidy component as demonstrated in both image (Siitonen et al. 1993) and flow cytometry studies (Pinto et al. 1997).
3 Genomic Instability and Disease Prognostication in Other Cancers
The relationship between genomic instability and cancer prognosis has been explored across a range of cancer types. Next to breast and colorectal cancer (see above), several retrospective studies, summarized in Table 1, consistently associated genomic instability with poor prognosis and demonstrated that it provided additional prognostic information beyond conventional clinical parameters (McGranahan et al. 2012).
Table 1
Summary of flow and image cytometry studies relating to genomic instability in various cancer types
Cancer type | Method of measuring genomic instability | Number of patients | Outcome Shorter survival/poor prognosis of aneuploid/genomic instable tumors | Reference |
|---|---|---|---|---|
Colorectal cancer | Flow cytometry | 694 | Higher survival rate of diploid tumors | Witzig et al. (1991) |
Flow cytometry | 528 | Higher survival rate of diploid tumors | Sinicrope et al. (2006) | |
Image cytometry | 213 | Higher survival rate of diploid tumors without metastasis (Dukes’stage A & B) | Bosari et al. (1992) | |
Image cytometry | 288 | Higher survival rate of diploid tumors; Aneuploidy strongest prognostic marker for CRC | Gerling et al. (2010) | |
Flow and image cytometry | 10,126 | Higher survival rate of diploid tumors | Walther et al. (2008) | |
Image cytometry | 217 | Higher survival rate of diploid tumors | Laubert et al. (2013) | |
Genotyping of MSI markers | 12,782 | Higher survival rate of MSI tumors | Guastadisegni et al. (2010) | |
Flow cytometry | 163 | Higher survival rate of diploid tumors | Flyger et al. (1999) | |
Image cytometry | 219 | Higher survival rate of euploid tumors | Bondi et al. (2009) | |
Image cytometry | 47 | Diploid signal count of NCOA3 is associated with a longer adenoma recurrence-free surveillance | ||
Image cytometry | 78 | Higher survival rate of diploid tumors; HDAC2 & TXNL1 marker for genomic stability | Gemoll et al. (2011) | |
Breast cancer | Image cytometry | 227 | Higher survival rate of diploid tumors | Fallenius et al. (1988) |
Image cytometry | 890 | Higher survival rate of genomically stable subtypes | Kronenwett et al. (2006) | |
Image cytometry | 112 | Higher survival rate of diploid tumors | Auer et al. (1980) | |
Image cytometry | 48 | 12-gene signature predict degree of genomic instability and disease prognostification | ||
Image cytometry | 370 | Lower survival rate of highly aneuploid tumors | Yildrim-Assaf et al. (2007) | |
Image cytometry | 599 | Single cell aneuploidy as marker for genomic instability and biologic aggressiveness | Sidoni et al. (2001) | |
Image cytometry | 134 | Lower survival rate of tumors with cancer cells with >5c DNA content | Siitonen et al. (1993) | |
Flow cytometry | 860 | Hypertetraploidy as marker for biologic aggressiveness | Pinto et al. (1997) | |
Endometrial cancer | Flow cytometry | 256 and 203 | Higher survival rate of diploid tumors | |
Flow cytometry | 76 | Higher survival rate of diploid tumors | Ikeda et al. (1993) | |
Image cytometry | 358 | Higher survival rate of diploid tumors | Lundgren et al. (2002) | |
Flow cytometry | 174 | Higher survival rate of diploid tumors | Susini et al. (2007) | |
Flow cytometry | 363 | Higher survival rate of diploid tumors | Wik et al. (2009) | |
Ovarian cancer | Flow cytometry | 682 | Higher survival rate of diploid tumors | Akeson et al. (2009) |
Image cytometry | 284 | Higher survival rate of diploid tumors | Kristensen et al. (2003) | |
Image cytometry | 47 | Higher survival rate of diploid tumors | Kildal et al. (2004) | |
Large B-cell lymphoma | H&E staining | 54 | Lower survival rate of patients with chromosomal instability | Bakhoum et al. (2011) |
Oral squamous cancer | FISH | 77 | Lower survival rate of patients with chromosomal instability | Sato et al. (2010) |
Synovial sarcoma | CGH | 22 | Lower survival rate of patients with specific chromosomal instability | Nakagawa et al. (2006) |
In endometrial cancer, genomic instability has been quantified by either image cytometry or flow cytometry (Evans and Podratz 1996). Next to traditional phenotypic variables, including stage, histologic grade and subtype, Britton et al. (1989, 1990) showed prognostic significance in univariate analysis of 256 and 203 endometrial carcinomas. A more detailed assessment revealed DNA ploidy as an independent prognostic factor by Ikeda et al. (1993). In 2002, Lundgren et al. (2002) published a study of relapse free survival following surgical treatment in 358 consecutive patients and found that DNA diploidy predicted disease free-survival. Likewise, prospective and multivariate studies successfully indicated the status of genomic instability as an independent prognostic variable (Susini et al. 2007; Wik et al. 2009). In this context, it seems that the grade of genomic instability correlates with a recurrent pattern of chromosomal imbalances and dominates specific gene and protein expression changes, irrespective of the histopathological subtypes in endometrial cancers. In order to identify the impact of chromosomal aberrations on protein expression, Gemoll et al. mapped genomic imbalances with associated gene and protein expression changes of endometrial cancer patients (Gemoll et al. 2012; Habermann et al. 2011b): Next to recurrent genomic imbalances of the chromosome arms 1q, 3q, 8q, 4q, and 15q, two proteins, AKR7A2 (aflatoxin B1 aldehyde reductase member 2) and ANXA2 (Annexin A2), showed translational alterations in consistence with transcriptional changes. While AKR7A2 is involved in the detoxification of aldehydes and ketones, there is evidence that ANXA2 facilitates the reorganization of the extracellular matrix in physiological and pathological processes such as tumor invasion (Mai et al. 2000).
Stay updated, free articles. Join our Telegram channel

Full access? Get Clinical Tree


