Author
Year
IO
Dose
No. of patients
Response (%)
Advani A
2010
Single
1.8 mg/m2
FL: 22
FL: 68
DLBCL:26
DLBCL: 15
Ogura M
2010
Single
1.8 mg/m2
FL: 10
FL: 80
Ogura M
2012
W RIT
1.8 mg/m2
FL: 6
FL: 100
MCL:2
MCL: 50
MALT: 1
MALT: 100
DLBCL:1
DLBCL: 0
Fayad L
2013
W RIT
1.8 mg/m2
FL: 39
FL: 87
DLBCL: 67
DLBCL: 74
Pharmacokinetic samples in this phase I study were available for INO, anti-CD22 antibody, and free and total calicheamicin derivatives. The data indicated that disposition was nonlinear with the number of dose or increasing dose. Nonlinearity is seen commonly with other antibodies as well [18]. It is due to target-mediated drug disposition, in which elimination and distribution are affected by the antibody and target cell interaction [19]. Mean end of infusion peak concentrations for 2.4 mg/m2 once every 3 weeks and 1.8 mg/m2 once every 3 weeks could not be distinguished from each other. For the INO and total calicheamicin, increases in area under the curve extrapolated over dosing interval (AUCT) with period and increases in AUCT with dose were observed. Anti-CD22 mAb and total calicheamicin exhibited similar trends of elimination but with a longer half-life than that of INO, suggesting that the acetyl butyrate linker is noticeably stable in plasma [14].
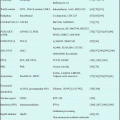
Phase I study of INO in Japan was conducted for patients with follicular lymphoma pretreated with rituximab-based therapy [15]. Based upon this study, safety and efficacy of INO 1.8 mg/m2 q-4weeks for 13 Japanese patients were similar to phase I study in the USA/EU, but efficacy was better (Table 7.1).
Adverse events of INO 1.8 mg/m2 q-4 weeks for patients with relapsed/refractory B-cell NHL observed in phase I studies of both the EU/USA and Japan are listed in Table 7.2 [14, 15]. The most common adverse events were thrombocytopenia, neutropenia, asthenia, and increase of aspartate transaminase (AST)/alanine aminotransferase (ALT). Thrombocytopenia and neutropenia were the most common reason for dose modification.
Table 7.2
Adverse events of inotuzumab ozogamicin monotherapy (1.8 mg/m2 once every 4 weeks)
Events | EU/US pts (N = 49) | JPN pts (N = 10) | ||
|---|---|---|---|---|
All grades (%) | Grade 3/4 (%) | All grades (%) | Grade 3/4 (%) | |
Thrombocytopenia | 89.8 | 63.3 | 100 | 50 |
Asthenia | 67.3 | 8.2 | 40 | 0 |
Nausea | 51 | 2 | 70 | 0 |
Neutropenia | 51 | 34.7 | 80 | 40 |
AST increased | 40.8 | 0 | 80 | 0 |
Abdominal pain | 30.6 | 0 | N/A | N/A |
Anorexia | 30.6 | 2 | 80 | 0 |
ALP increased | 26.5 | 4.1 | 60 | 0 |
Anemia | 26.5 | 6.1 | 60 | 0 |
Leukopenia | 26.5 | 18.4 | 90 | 20 |
Lymphopenia | N/A | N/A | 80 | 40 |
Vomiting | 26.5 | 4.1 | N/A | N/A |
Constipation | 24.5 | 4.1 | 40 | 0 |
Hyperbilirubinemia | 22.4 | 2 | 40 | 0 |
Headache | 20.4 | 0 | 40 | 0 |
ALT increased | 18.4 | 4.1 | 60 | 0 |
Epistaxis | 18.4 | 0 | 40 | 0 |
7.2.2 Combination of INO with Rituximab
Based upon the phase I results and data demonstrating synergy between INO and rituximab in animal models [1, 20], phase I/II study was conducted to evaluate the safety and efficacy of the combination of rituximab and INO (R-INO) in patients with relapsed/refractory NHL [17].
R-INO was administered once every 4 weeks: rituximab on day 1 and INO on day 2 of each cycle. The study was performed in two parts: dose escalation (DE) to define the MTD (part 1) and an expanded cohort to further evaluate efficacy and safety of the MTD (part 2). Rituximab was administered at a fixed dose of 375 mg/m2 on day 1, and INO was administered as DE from 0.8 to 1.3 to 1.8 mg/m2 on day 2. For part 1, 15 patients received R-INO during DE, and no DLTs were observed at the 0.8 or 1.3 mg/m2 dose levels, while only one of seven patients had a DLT (delayed dosing was the result of low neutrophils and platelets) at the highest planned INO dose (1.8 mg/m2). MTD for the regimen was declared to be 375 mg/m2 of rituximab on day 1 and 1.8 mg/m2 of INO on day 2 once every 4 weeks.
For part 2, 104 patients were enrolled with 103 dosed in the expanded MTD cohort, and ORR was 87% and 74%, for patients with relapsed FL and relapsed/refractory DLBCL (Table 7.1).
The safety and efficacy of INO combined with rituximab were also investigated in the phase I study for Japanese patients with relapsed/refractory B-cell NHL [16].
A total of ten patients (FL 6, DLBCL 1, mantle cell lymphoma (MCL) 2, mucosa-associated lymphoid tissue lymphoma (MALT) 1) were treated by R-INO regimen that was 375 mg/m2 of rituximab on day 1 and 1.8 mg/m2 of INO on day 2 once every 4 weeks and repeated up to eight cycles, or until occurrence of disease progression or intolerable toxicity. Drug exposure increased with successive doses, similar to the pharmacokinetic profiles observed in the phase I study of INO monotherapy [15]. Although the number of patients is small, the efficacy of combination treatment indicates to be promising (Table 7.1).
7.3 Therapeutic Results of INO
7.3.1 Clinical Efficacy for B-Cell Acute Lymphoblastic Leukemia
7.3.1.1 Single-Agent Treatment
Single-Dose Schedule
The first phase II study of single-agent INO 1.3–1.8 mg/m2 once every 3–4 weeks was conducted for 49 patients with relapsed/refractory ALL [21]. Patients received a median of two (range 1–5) INO courses. A total of 82% of the patients received more than two cycles, and 47% received more than three cycles of INO. In all patients, CD22 was expressed in more than 50% of blasts and for 28 patients (57%) with more than 90% of blasts.
The overall response rate (ORR) was 57% (28 of 49 patients) including nine patients (18%) who had complete remission (CR) and 19 patients (39%) who had CR with incomplete recovery of peripheral blood cells (CRi) (Table 7.3). The treatment was well tolerated, with only two patients (4%) dying within 4 weeks of start of therapy from nondrug-related complications.
Table 7.3
Inotuzumab ozogamicin for patients with relapsed/refractory acute lymphoblastic leukemia
Patient characteristics | Single dose (N = 49) | Weekly dose (N = 41) |
|---|---|---|
Prior therapy (regimen) | ||
One, two, three, or more (%) | 27, 49, 24 | 39, 24, 37 |
Prior allo-SCT (%) | 14 | 7 |
Karyotype | ||
Diploid t(9;22), t(4;11), others (%) | 24, 14, 10, 51 | 22, 20, 7, 51 |
Response (%) | 57 | 59 |
CR, CRp, CRi (%) | 18, 29, 10 | 20, 30, 9 |
Early death (%) | 4 | 5 |
MRD negativity in CR (%) | 63 | 70 |
Allo-SCT as post-therapy (%) | 45 | 34 |
Overall survival (median) (months) | 5.1 | 7.3 |
Toxicity | ||
Hyperbilirubinemia (%) | 29 | 5 |
Elevated transaminase (%) | 57 | 27 |
Veno-occlusive disease (%) | 10 | 2 |
Among the 28 patients obtaining CR, 18 had chromosomal abnormalities at the start of therapy, and 16 (89%; 43% of all patients) achieved a complete cytogenetic response (CCyR). Multiparameter flow cytometry for MRD was performed in 27 patients achieving CR, and reversal to MRD-negative status was observed in 17 patients (63% in CR). Most responses occurred early in the course of treatment, and among nine patients who achieved CR, eight of these did so after one cycle and one patient after two cycles.
The median overall survival (OS) time was 5.1 and 7.9 months in all patients and 28 responders, respectively [22, 23]. Twenty-two patients (45%) received allo-SCT after treatment of INO, and five patients (23%) had clinical evidence for veno-occlusive disease (VOD). Drug-related fever and hypotension were commonly observed during the first 1–2 days of infusion. Fever was reported in 29 (59%) patients and was grade 3/4 in nine (31%) of these patients. Grade 1/2 hypotension was reported in 12 (24%) patients, and grade 3/4 hypotension was observed in only one (2%) patient. Another commonly seen adverse event was elevated liver transaminase (grade 1/2 elevations were observed in 27 of 49 (55%) patients, one grade 3/4) (Table 7.4).
Table 7.4
Non-hematologic adverse events during the first cycle of inotuzumab ozogamicin therapy for relapsed/refractory acute lymphoblastic leukemia
Single dose (N = 49) | Weekly (N = 41) | |||
|---|---|---|---|---|
Events | Grade 1–2 | Grade 3–4 | Grade 1–2 | Grade 3–4 |
Fever on day 1–2 | 20 (41%) | 9 (18%) | 3 (7%) | 6 (15%) |
Hypotension | 12 (24%) | 1 (2%) | 6 (15%) | 0 |
Hyperbilirubinemia | 12 (24%) | 2 (4%) | 2 (5%) | 0 |
Increase transaminase | 27 (55%) | 1 (2%) | 9 (22%) | 2 (5%) |
Increase amylase | 0 | 1 (2%) | 1 (2%) | 0 |
Nausea | 6 (12%) | 0 | 5 (12%) | 0 |
Vomiting | 3 (6%) | 0 | 0 | 0 |
Diarrhea | 3 (6%) | 0 | 1 (2%) | 0 |
Mucositis | 0 | 1 (2%) | 0 | 0 |
Anorexia | 1 (2%) | 0 | 0 | 0 |
Headache | 1 (2%) | 0 | 1 (2%)
Stay updated, free articles. Join our Telegram channel
Full access? Get Clinical Tree
 Get Clinical Tree app for offline access

| |


