Infants, Children, and Adolescents
1 Boston Medical Center, Boston, MA
2 Merck & Co., Inc., North Wales, PA
Assessment of Nutritional Status and Dietary Intake in Children
The assessment of nutritional status is critical in the care of sick and well children since nutritional status affects the child’s response to and recovery from illness, and supports healthy growth and development. Dietary intake during infancy, childhood, and adolescence influences normal growth and development and provides a foundation for adult health. Many changes in growth and body composition happen during infancy, childhood, and adolescence. Therefore, healthcare professionals need to understand normal growth to recognize abnormal patterns of growth and development. Historically, childhood malnutrition was equated with low weight for height (length), weight loss, stunted growth, and impaired development. Currently, childhood malnutrition also encompasses “over-nutrition” and obesity. All forms of malnutrition have been associated with micronutrient deficiencies or excesses, co-morbidities, and mortality. Children, who suffer acutely from malnutrition from either inadequate intake or an underlying condition that changes nutrient needs or absorption/utilization, may develop nutritional deficiencies that require attention and proactive management. There are currently new efforts aimed at better defining pediatric nutritional status to improve its recognition and thus treatment outcomes. More recently, authors proposed that the definition of malnutrition be not only based on anthropometric factors, but also chronicity, etiology, mechanisms of nutrient imbalance, severity of malnutrition, and its impact on outcomes. Healthcare professionals care of infants, children, and adolescents can profoundly influence their immediate and long-term health and longevity by helping support good nutrition. Therefore, clinicians must become adept at assessing the nutritional status of children, developing an appropriate nutritional management plan, and counseling caregivers and children to foster healthy eating habits and to support optimal nutrition and health.
Assessing Growth and Development
Evaluation of growth and development is the cornerstone of pediatric nutrition assessment. Updated growth charts were released in 2006 by the World Health Organization (WHO) and in 2000 by the Centers for Disease Control and Prevention (CDC), based on National Health and Nutrition Examination Survey (NHANES) data collected from 1971 to 1994. Weight, height, head circumference are available in both surveys. The CDC charts represent the combined growth patterns of breastfed and formula-fed infants in diverse United States racial and ethnic groups. The WHO growth charts were created with longitudinal length and weight data measured at frequent intervals among breastfed children up to 2 years of age and cross-sectional data up to 5 years of age (60 months old), using data from six countries (Brazil, Ghana, India, Norway, Oman, and the United States). A variety of growth charts for infants born from pre-term deliveries are also available. The most commonly used neonatal charts in the United States are from Fenton and Olsen. The Olsen neonatal growth charts (23 to 42 weeks gestation) are gender specific and based on infants from a racial and ethnic mix born in the United States (1998–2006). The Olsen growth charts are available on the American Academy of Pediatrics website (www2.aap.org/sections/perinatal/PDF/GrowthCurves.pdf). The Fenton neonatal growth curves (22 to 43 weeks gestation) are not gender specific and based mainly on Caucasian infants born in Canada, Australia, and Sweden (1977–1995) and were smoothed at 40 weeks of gestation to the recent WHO growth charts at birth. The Fenton charts are available on the website (http://members.shaw.ca/growthchart/Fenton%20WHO%20growth%20chart%2008.pdf )
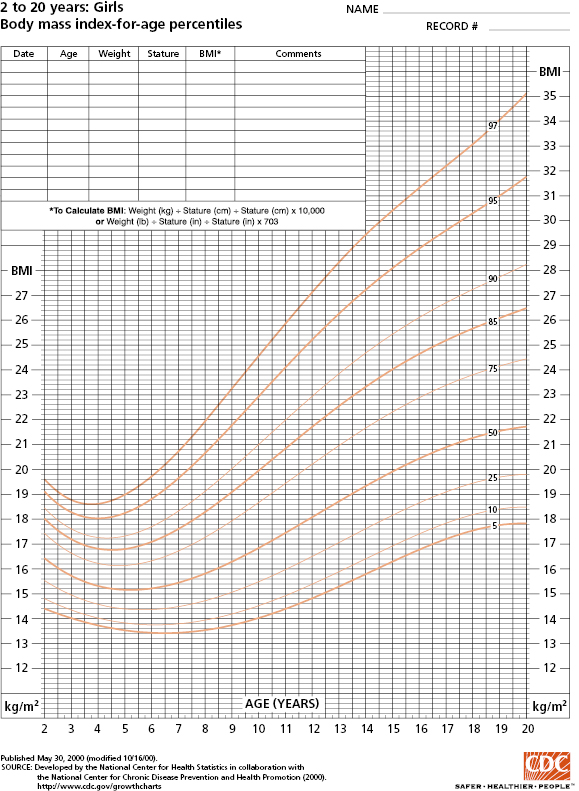
Children’s and adolescents’ height should be measured without shoes using a wall-mounted stadiometer and weight taken wearing light clothing. A length board should be used for infants. Body mass index (BMI) for children aged 2 to 18 years old is calculated based on weight divided by height squared (kg/m2). Standard BMI definitions for overweight and obesity are available for adults. However, as BMI for children varies by age, BMI percentiles (Figure 4-1; www.cdc.gov/growthcharts) should be utilized to define relative weight for children. For infants and children less than 2 years of age, weight-for-length (WL) rather than BMI should be assessed because of the persistent correlation between BMI and length in this age group. Once the child can stand, weight-for-height can be substituted (typically between 2 and 3 years old). Although WL, weight-for-height (WH), and BMI provide data on relative weight, WL and WH are typically used to classify and monitor malnutrition in hospital settings while BMI is more commonly used in outpatient settings. For children and adolescents 2 to 18 years, BMI (kg/m2) can be calculated as a measure of relative weight (Table 4.1 and Figure 4-1).
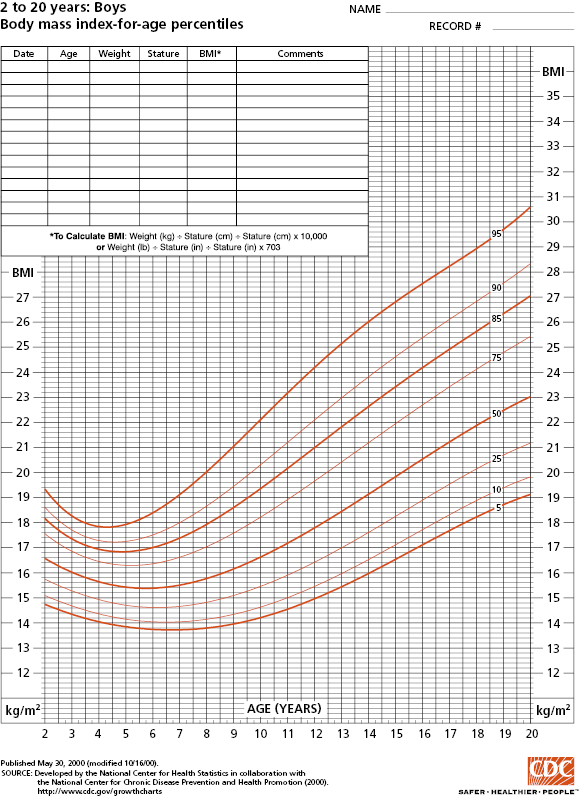
Source: Data from Centers for Disease Control and Prevention. http://www.cdc.gov/nchs/data/nhanes/growthcharts/set1clinical/cj41l023.pdf
http://www.cdc.gov/nchs/data/nhanes/growthcharts/set1clinical/cj41l024.pdf
Table 4-1 BMI Classification for Children and Adolescents (CDC)
Source: Centers for Disease Control and Prevention. 2014. Used with permission.
| BMI Category | Recommended Terminology |
|---|---|
| <5th percentile | Underweight |
| 5th–84th percentile | Healthy weight |
| 85th –94th percentile | Overweight |
| 95th –97th percentile | Obesity |
| 98th –99th percentile | Moderately obese |
| >99th percentile | Severely obese |
Height (stature) or length (recumbent), weight, and WL or BMI should be plotted on a sex-specific growth chart kept with the child’s medical records (paper or electronic) so that the individual values and a longitudinal record of the child’s growth can be examined and evaluated. Plotted values of all three of these growth parameters should be assessed to determine:
- whether they are following consistently along a particular percentile or z-score line,
- the degree to which particular plotted values deviate from the child’s prior pattern of growth,
- whether these values are outliers relative to the growth charts norms,
- whether the growth pattern for height/length, weight, and head circumference are similar.
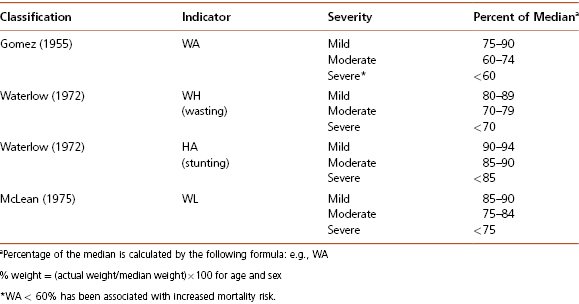
For children under 2 years of age, the CDC and American Academy of Pediatrics (AAP) recommend using the WHO growth charts. For these young children, growth assessment should also include measuring head circumference. Note also that measurements of length and height differ so standard growth curves for evaluating length and height should not be used interchangeably. WHO recommends the use of a formula to transform length to height or height to length to plot children on the appropriate growth chart, when necessary. Infants corrected age (chronological age in weeks − [40 weeks − gestational age in weeks]) may be calculated between birth and 24 months of age for infants born from pre-term deliveries. Premature infants can be plotted on the neonatal charts until the infant reaches 40 weeks expected gestational age. After 40 weeks expected gestational age, infant growth charts can be used. Children who are underweight (BMI <5th percentile), losing weight, or whose linear growth has slowed or ceased, should be assessed for medical conditions that could impair growth or nutritional status and cause nutritional deficiencies. Similarly, children observed to be gaining weight rapidly or to have an increasing BMI percentile (typically crossing two major percentile curves, WL greater than the 95th percentile [children younger than 2 years old]), or BMI more than the 95th percentile (children at or greater than 2 years old) warrant further evaluation. Classification of BMI for children and adolescents according to the CDC is shown in Table 4-1 while classification of malnutrition according to the WHO is shown in Table 4-2. Although the CDC growth charts are recommended for the growth and nutritional assessment of all children, a number of condition/syndrome-specific growth charts have been published (e.g., achondroplasia, Brachmann-de Lange syndrome, cerebral palsy, Down syndrome, Marfan syndrome, myelomeningocele, Noonan’s syndrome, Prader-Willi syndrome, sickle cell disease, Silver-Russell syndrome, Turner’s syndrome, Williams syndrome). Of note, classification of malnutrition has changed over time but some of the older classifications are still in use at this time, especially in hospital settings (Table 4-3).
Table 4-2 Nutrition Status: WHO Classification
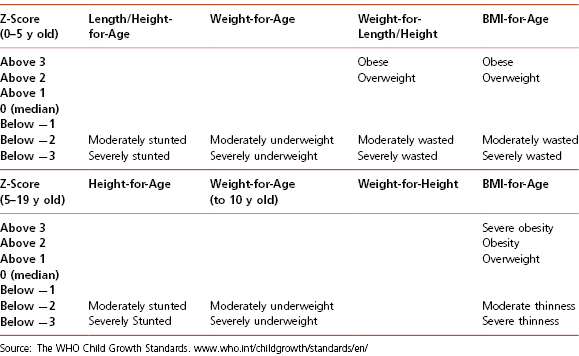
Table 4-3 Common Classification of Malnutrition in the Hospital and Outpatient Settings
Evaluating Dietary Adequacy in Children
Dietary intake is difficult to assess accurately in an outpatient setting, as it is based on recall and requires that both the healthcare provider and the patient or caregiver understand portion sizes and content of a variety of foods. Infants, children, and adolescents being evaluated for abnormal growth or development should generally be assessed by a pediatric nutrition professional such as a registered dietitian. Nevertheless, with the high prevalence of overweight and obesity in the pediatric population, primary care providers must be able to make a general assessment of eating behavior and estimate calorie and nutrient intake in order to provide basic counseling, or appropriate referral to a pediatric nutrition professional, for all patients and caregivers.
The most common method for making such assessments in the clinical setting is the 24-hour recall. The 24-hour recall includes asking the child and caregiver about all foods consumed by the child in the last day. Once a list of foods has been compiled, the provider can probe for more details about each, including portion size, preparation, and brand names. The provider should also probe for foods and drinks that may have been missed with questions like “Did you eat anything between lunch and dinner?” or “Did you have anything to drink with your breakfast?” Although asking about only 1 day has its limitations, the 24 hour recall provides a basic overview of the child’s eating habits, can highlight problem areas, and stimulate further discussion about the child’s diet. It should be noted that studies show that children and adults commonly underreport their dietary intake.
Pediatric Calorie and Nutrient Requirements
Nutrient requirements are largely determined by lean body mass, activity level, and basal metabolic rate. Therefore, body composition, which changes during the course of growth and development, must be considered when estimating nutrient needs of children and adolescents. Percent body fat, or fat mass, is high in infants and toddlers and decreases as children enter their elementary school years. During puberty, percent body fat increases in both boys and girls. Lean body mass (LBM) also increases, approximately tripling in boys and doubling in girls. As adolescents reach adulthood, females retain a higher percentage body fat and lower lean body mass than males. Pubertal changes in body composition drive changes in nutrient requirements and the difference in lean body mass between men and women accounts for differences in calorie and nutrient requirements.
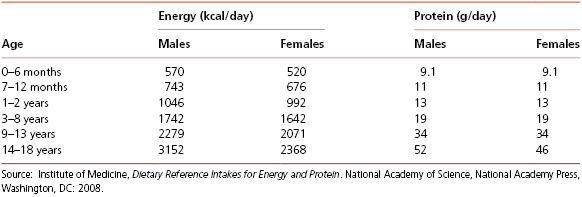
Various recommended energy and nutrient allowances have been formulated for growing children based on the changing nutritional needs associated with growth and development. For the general population, the USDA has developed My Plate based on the Dietary Guidelines for Americans (www.choosemyplate.gov). Nutritional guidelines were originally aimed at preventing undernutrition; recent guidelines have evolved to support overall good nutrition, and to prevent over- and under-nutrition. The MyPlate guidance system is intended to provide a framework for adults and children for determining what and how much to eat each day using the familiar image of a place setting for a meal. The MyPlate image replaced the MyPyramid system in 2011. The ChooseMyPlate.gov website provides of well-organized information to help Americans make the best food choices. It also allows for the development of individualized dietary and physical activity plans. Dietary Reference Intake (DRI) values developed by the Food and Nutrition Board, Institute of Medicine, National Academy of Sciences provide another useful tool for determining specific energy and protein requirements as shown in Table 4-4. DRIs can be used by dietitians and health professionals to help patients with specific dietary planning needs, but MyPlate is more practical and easy-to-understand tool for initial dietary changed.
Table 4-4 Energy and Protein Requirements in Children and Adolescents
Adjustments for Activity and Illness
In pediatric acute care settings, specific adjustments are made for special circumstances such as differing activity levels and illness. Nutrient requirements are estimated based on specific equations using resting energy expenditure and a stress factor to account for the underlying condition. For example, fever increases energy needs by 7 percent for each degree above 98.6 °F of body temperature (or 12 percent for each degree above 37 °C). Illness, trauma, major surgery, extensive burns, recovery from undernutrition, and intensive exercise or manual labor cans double energy requirements. Chronic under-nutrition with loss of lean body mass can decrease energy needs by 20 to 30 percent. However, energy needs may increase rapidly in the malnourished child who is being nutritionally repleted. For example, with significant malnutrition, a child may be dehydrated and in a state of slowed metabolism, an adaptation that decreases calorie and nutrient requirements. Nutrionally related laboratory assessments may seem relatively normal. However, refeeding causes anabolism and a rapid increase in metabolic processes, greatly increasing caloric and nutrient needs. These changes, along with rehydration, can unveil significant electrolyte and micronutrient deficiencies (e.g., phosphorus, potassium, magnesium). Overly aggressive refeeding without adequate nutrient supplementation can be associated with serious morbidity, including cardiac dysfunction, arrhythmias, congestive heart failure, and even death. Therefore, a significantly malnourished child must be repleted slowly, under close monitoring and supervision (see Chapter 4: Case 2).
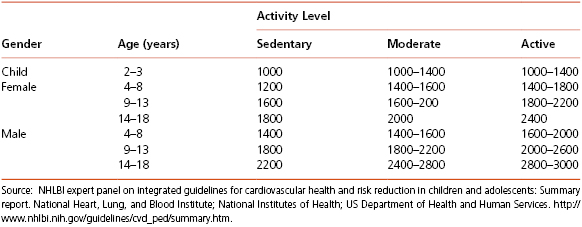
For healthy children, level of physical activity should be considered when determining their dietary needs. Table 4-5 illustrates estimated energy requirements for children based on age, gender, and activity level.
Table 4-5 Estimated Energy Requirements (EER) (in kcals) for Gender and Age Groups Based on Activity Level
Laboratory Assessment
As part of a regular nutritional evaluation, broad screening using laboratory tests is generally not recommended. General assessments can include a complete blood count (CBC), serum electrolytes, creatinine, and albumin. Serum albumin is commonly used as an assessment of general long-term nutritional and protein status; however, it is an insensitive marker of nutrition status but a good predictor for mortality. Pre-albumin has a half-life a few days (as opposed to a few weeks for albumin) and may have utility as a short-term marker of protein-related nutritional status in the absence of inflammation (C-reactive protein (CRP) values are within normal range). Evaluation of the CBC, including white blood cell morphology and red blood cell size, can provide evidence of deficiencies in iron, folate, and vitamin B12. Blood chemistries can indicate electrolyte and mineral imbalances, though blood levels are not always good indicators of whole body nutritional balance.
Fasting Glucose
It is estimated that about 150,000 to 200,000 individuals under the age of 20 have diabetes. As opposed to the epidemiology in adults, most children with diabetes have type 1 diabetes. However, over the past 20 years, the rate of type 2 diabetes in children and adolescents has increased significantly, especially in some at-risk groups. Children with type 2 diabetes are frequently more than 10 years old, obese, and have a family history of type 2 diabetes. Rates are higher in some racial/ethnic groups, such as Asian/Pacific Islander, Native American, Black, and Hispanic descent children. Rates of undiagnosed type 2 diabetes and “prediabetes” (impaired fasting glucose (>100 mg/dL; 5.6 mmol/L) in young persons are not well defined, though it is assumed the official statistics only identify a portion of the affected persons. Using fasting glucose levels and primary care provider diagnosis of diabetes from NHANES 1999–2000 to 2007–2008, May and colleagues (2012) reported that the prevalence of prediabetes/diabetes among adolescents aged 12 to 19 years old has increased from 9 percent to 23 percent. A study using NHANES 1999–2000 to 2007–2008 data predicted that the number of youth with type 1 diabetes and type 2 diabetes may increase by 23 percent and 49 percent, respectively. Overweight and obese children less than 18 years with two or more other risk factors (Table 4-6) should be screened for type 2 diabetes every 2 to 3 years. A fasting plasma glucose assessment (>125 mg/dL is consistent with diabetes; 101 to 125 mg/dL defines impaired fasting glucose or prediabetes) is most commonly used as a screening test for children, adolescents, and adults. In the evolution of type 2 diabetes, post-prandial glucose increases earlier than fasting glucose; some experts therefore recommend determining plasma glucose two hours after a standard glucose load or two hours after a meal. Thus, significant elevations in non-fasting glucose tests, especially those >200 mg/dL should be further evaluated. Diabetes screening recommendations for children and adolescents are shown in Table 4-6. Though in adults, screening tests for diabetes and prediabetes include hemoglobin A1C, or a 2-hour plasma glucose level as part of an oral glucose tolerance test, such recommendations have not been broadly applied to children. Similarly, though HbA1C is now considered as a good tool for screening and monitoring for T2DM in adults, there are concerns about the use of A1C to evaluate children and adolescents for T2DM. Given that cardiovascular disease risk factors tend to cluster together, screening for other such risk factors (e.g. hypertension, dyslipidemia) should be considered for children and adolescents at risk for developing type 2 diabetes.
Table 4-6 Guidelines for Diabetes Screening for Children
Overweight plus two other risk factors:
|
Elevated glucose levels, especially in the hospital setting, may occur at times of significant stress and acute illness, such as infection or sepsis, or as a side effect of some medications, such as steroids. Such secondary causes should be considered when assessing a child with hyperglycemia. Low glucose levels related to malnutrition are relatively rare, and usually occur in late stage, severe malnutrition. Neonates and premature infants are among higher risk groups for low and high glucose levels at times of stress.
Lipids
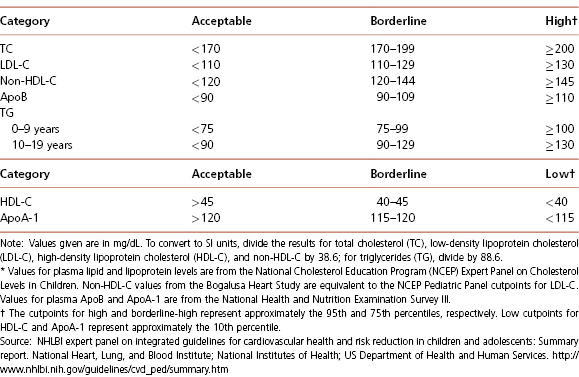
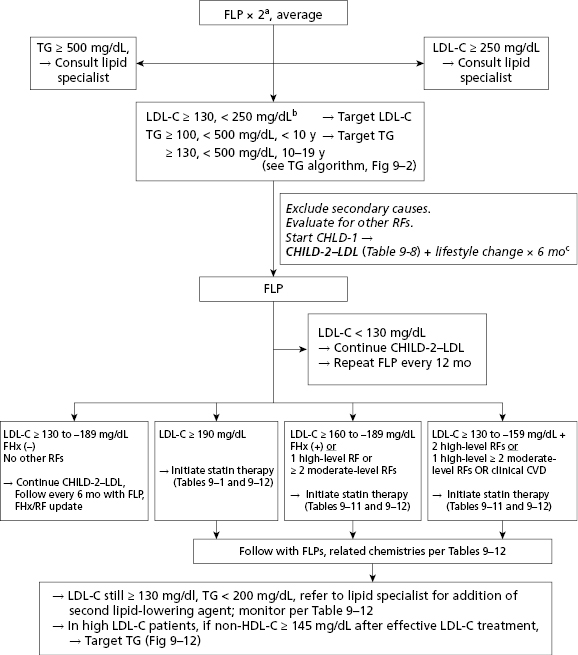
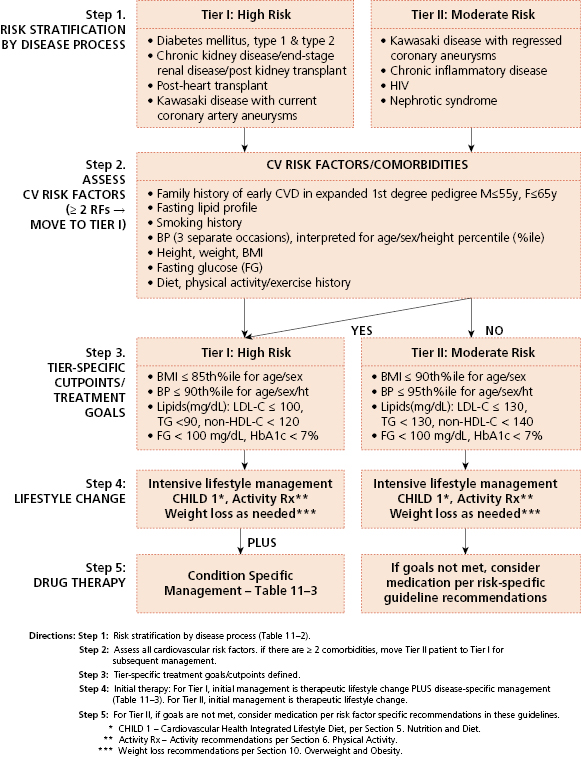
Encouraging a healthy lifestyle and consideration of cardiovascular disease risk factors should start relatively early in life. Screening for hypercholesterolemia should start around 3 years of age, and target children with a positive family history of early atherosclerotic vascular disease (AVD) or parental dyslipidemia. (Table 4-7 and Figures 4-2 and 4-3). A positive family history of early AVD is defined as a parent, grandparent, aunt/uncle, or sibling with a heart attack, sudden death thought to be related to AVD, angina, angioplasty, peripheral vascular disease, or cerebrovascular disease before age 55 in males or before 65 in females. Screening should also be considered in children at higher risk for developing adult heart disease, such as those with diabetes, hypertension, and obesity. Children with high cholesterol levels tend to become adults with high cholesterol levels. However, as tracking of lipid levels over time is not perfect, not all the hypercholesterolemic children will become hypercholesterolemic adults. Screening in high-risk children should consist of the average of two fasting lipid profiles obtained on two separate occasions. Low-density lipoprotein cholesterol (LDL-C) > 130 mg/dL or triglycerides >110 mg/dL are generally considered elevated and should be evaluated further for secondary causes and potential intervention (see Table 4-7 and Figures 4-2 and 4-3). The initial intervention in children with primary hypercholesterolemia is dietary and lifestyle assessment and intervention.
Table 4-7 Acceptable, Borderline-High and High Plasma Lipid, Lipoprotein and Apolipoprotein Concentrations (mg/dL) for Children And Adolescents*
Source: NHLBI expert panel on integrated guidelines for cardiovascular health and risk reduction in children and adolescents: Summary report. National Heart, Lung, and Blood Institute; National Institutes of Health; US Department of Health and Human Services. http://www.nhlbi.nih.gov/guidelines/cvd_ped/summary.htm
FLP = fasting lipid profile
Source: NHLBI expert panel on integrated guidelines for cardiovascular health and risk reduction in children and adolescents: Summary report. National Heart, Lung, and Blood Institute; National Institutes of Health; US Department of Health and Human Services. http://www.nhlbi.nih.gov/guidelines/cvd_ped/summary.htm
Universal screening is recommended for children 9 to 11 years old, and can consist of a non-fasting non-high-density lipoprotein cholesterol (non-HDL-C) assessment. Children with non-HDL-C greater than 145 mg/dL and/or HDL-C less than 40 mg/dL should be considered for further assessment, including fasting lipid profiles. A general summary of the National Heart, Lung, and Blood Institute expert panel’s recommendations regarding lipid screening is shown in Table 4-7 and Figures 4-2 and 4-3, and further details are available at http://www.nhlbi.nih.gov/guidelines/cvd_ped/summary.htm. Guidelines are also available for the management of patients with obesity and dyslipidemia.
Iron Status
Though significant progress has been made in decreasing rates of iron deficiency in children in the United States over the past several decades, iron deficiency is likely the most common micronutrient deficiency in the United States. Iron deficiency is usually due to inadequate dietary intake of iron, especially during times of rapid growth or increased blood loss, such as infancy and early childhood, and during adolescence (especially for girls). Pre-term infants and infants with intrauterine growth retardation are also born with decreased iron stores and thus should receive iron supplements. Adolescent athletes, for reasons that are not totally clear, are another at-risk group. A higher prevalence of iron deficiency has also been observed in obese children across a broad age range. Even in the absence of anemia, iron deficiency is associated with poor growth and neuro-cognitive development in infants and behavioral and learning problems in older children and adolescents. Iron deficiency and iron-deficiency anemia are also associated with decreased exercise capacity and physical endurance. Thus it is very important to identify and treat iron deficient children.
As specific measures of iron stores (e.g., serum ferritin, transferrin, iron binding capacity, free erythrocyte protoporphyrin) are costly and not widely available, hemoglobin and red blood cell indices (derived from a simple CBC) are the laboratory parameters most commonly used to evaluate children for iron deficiency. However, these are relatively insensitive measures of true iron status. It should be noted that transient decreases in hemoglobin levels are relatively common with infections, thus a single low hemoglobin level should be confirmed or assessed further before initiating therapy. An alternative to more specialized testing is providing a therapeutic iron supplement challenge. An iron deficient child should respond to such a challenge with a reticulocytosis and increase in hemoglobin within a few weeks. Screening for iron deficiency should thus focus on at-risk children, as noted above, and especially those at-risk children who have not been receiving iron-sufficient diets, or iron supplements, as appropriate.
Vitamin D
Vitamin D deficiency, defined based on the serum or plasma measurement of 25-hydroxyvitamin D [25(OH)D], is a common and poorly recognized condition that occurs in infants, children, adolescents, and adults. Many affected children are dark skinned and have limited exposure to UV light, are fed unfortified “health food” milk alternatives, or are breastfed without vitamin D supplementation by mothers with vitamin D insufficiency or deficiency.
As reviewed by the Institute of Medicine (IOM) taskforce in 2011, vitamin D is essential for skeletal health but there is currently a lack of convincing evidence to link vitamin D supplements with benefits for other nonskeletal outcomes such as cardiovascular disease, death, cancer, and quality of life. There is no additional benefit currently identified for levels of 25(OH)D above 20 ng/mL (50 nmol/L), therefore the IOM considered the 20-ng/ml level as the upper range of human requirements, meeting the needs of most individuals in the general populations (regardless of other factors such as skin color). However, these guidelines are not specific for individuals with underlying conditions or diseases. The United States Institute of Medicine Recommended Dietary Allowance of vitamin D is 400 IU per day for children younger than 1 year of age, 600 IU per day for children at least 1 year of age and adults up to 70 years, and 800 IU per day for older adults. The AAP recommendations for children is similar to the IOM but that of the pediatric endocrine society is not. Premature infants, dark-skinned infants and children, and children who reside at higher latitudes (particularly above 40°) may require larger amounts of vitamin D supplementation, especially in the winter months. The principal source of vitamin D is solar UV-B (wavelengths of 290–315 nm) irradiation. Dietary sources of vitamin D other than vitamin supplements are limited and include oily fish, some fish oils, and egg yolks. Although some foods in the United States are vitamin D fortified, including milk, some cereals, orange juice, some yogurts, and margarine, most United States children do not eat sufficient quantities of vitamin D-containing foods to provide adequate vitamin D intake.
Although 25(OH)D serum/plasma levels are considered the gold standard to identify vitamin D deficiency, this may be a poor marker in chronic conditions such as obesity and conditions with inflammation. Youth who are obese tend to have 25(OH)D levels in the deficient range but studies of bone density in this population are similar to reference populations, thus there is currently no evidence that these lower vitamin D levels in obese children have a demonstrable effect on bone health . New screening and treatment guidelines for obese children with low vitamin D levels have not been developed.
Infant Feeding
Many nutritional recommendations for children and infants are based upon expert consensus and opinion, and thus should be considered in this context. This is not to say these recommendations should be discounted – but concrete data to support these recommendations may not be available.
Breast or Bottle
Lactation is discussed in Chapter 3.
The AAP states that breastfeeding and human milk are the normative standard and recommends exclusive breastfeeding up to approximately 6 months for almost all infants (see iron and vitamin D section above for recommendations regarding supplements for breastfed infants). Breastfeeding is associated with numerous medical and neurocognitive advantages. Though true contraindications to breastfeeding are rare, there are significant obstacles to breastfeeding in the United States, including lack of knowledge, limited experience with breastfeeding, lack of support for breastfeeding mothers at home or in the workplace, and misguided social “norms”. All healthcare providers, including hospitals, obstetricians, and pediatricians, and all pediatric care providers should encourage breastfeeding whenever possible, and work to encourage community-based supports for breastfeeding mothers. Certified breastfeeding counselors and breastfeeding support groups should be used when appropriate to help establish and support effective breastfeeding. Interventions to overcome problems with breastfeeding must be considered as relatively urgent, to avoid interruptions in the mother’s milk supply or other problems which may interfere with longer term success with breastfeeding. The WHO/Unicef Baby Friendly Initiative launched in 1991 and revised in 2006 has contributed to increased rates of exclusive breastfeeding and improved infant health and survival.
Except for special formulas, manufacturers of infant formulas try to approximate the composition of human breast milk. For example, formula manufacturers add omega-3 and omega-6 fatty acids, docosahexaenoic acid (DHA), and arachidonic acid (ARA) to infant formulas, as these fatty acids are found in breast milk and support normal brain and eye development.
Iron and Vitamin D Supplementation
Even though breast milk is lower in iron than cow’s milk, the iron in breast milk is more readily absorbed. Pre-term infants and infants with intrauterine growth retardation are born with decreased iron stores and thus should receive iron supplements (for breastfed infants 2 mg/kg per day elemental iron is recommended as a supplement; formula-fed infants should receive iron fortified formula and 1 mg/kg per day elemental iron as a supplement is appropriate). Recommendations for breastfed infants, beginning around 4 to 6 months, include 1 mg/kg per day of iron. For older infants, iron supplements may be required if adequate intake from complementary foods is not assured.
Supplementation with 400 IU of vitamin D should be initiated within days of birth for all breastfed infants, and for non-breastfed infants and children who do not ingest at least 1 litre of vitamin D-fortified formula or milk daily, and consideration should be given to supplementing with up to 800 IU of vitamin D per day.
Weaning Babies from Breast Milk or Formulas
Infants should remain on breast milk or formula until the age of 1 year, as the AAP recommends that cow’s milk not be given to children under 1 year of age. Most healthcare providers feel that cow’s milk is an important source of calories, protein, and calcium for children over 1 year of age. Earlier introduction of cow’s milk is associated with gastrointestinal blood loss due to a milk protein-induced inflammatory reaction in the small bowel. This blood loss may be sufficient to deplete iron stores and to produce anemia. In addition, cow’s milk has a higher protein and phosphorus content than breast milk or infant formula. These components present a solute load that exceeds the capacity of the immature kidney and may precipitate dehydration and electrolyte imbalance in infants.
Introducing Solid Food
Recommendations concerning the introduction of solid food have changed considerably over the years. In the past, many children ate a wide variety of foods as early as the first month of life. The consensus among healthcare providers is to delay the introduction of solid foods until the child is at least 4 months old. The AAP and WHO both recommend breast milk as the sole nutrient source until 6 months of age.
Infants are not physiologically ready to accept solid foods from a spoon until they are at least 4 months of age. It is around this time that the oral extrusion reflex becomes extinguished and infants develop sufficient head and neck control and coordination of the oral musculature to begin taking solid foods. Recent data also suggests that early introduction of solid foods (defined as before 4 months of age in this study) may predispose the child to excess weight gain and obesity.
The introduction of solid foods marks the beginning of a critical period during which the infant learns to master eating from a spoon and to accept different tastes and textures. Not coincidentally, an infant’s readiness for these experiences generally corresponds to a physiologic need to supplement the amounts of calories and nutrients available from breast milk or formula. However, breast milk, formula, or a combination should still continue to be the major source of calories and nutrients during the remainder of the infant’s first year.
Preventing and Managing Food Allergies
Introducing solid foods earlier in an infant’s life may stimulate the development of food allergies. Infants from families with known food allergies are most at risk. Food allergies – actually, food hypersensitivity reactions – occur in 2 to 8 percent of children less than 3 years of age. Approximately 90 percent of food allergies are associated with the following group of eight foods: peanuts, tree nuts (such as walnuts or cashews), eggs, milk, fish, shellfish, soy, and wheat. Approximately 2.5 percent of infants will experience allergic reactions to cow’s milk in the first 3 years of life, 1.5 percent to egg, and 0.6 percent to peanuts. Many children outgrow food allergies during the first few years of life. Approximately 85 percent of children with reactions to milk and eggs become tolerant to them by 5 years of age. Even a peanut allergy may remit in up to 20 percent of children. It should be noted that celiac disease is related to a reaction to gluten, may cause symptoms similar to food allergies (diarrhea, abdominal pain), but is not an allergy, and does not remit with time.
General Guidelines for Introducing New Foods
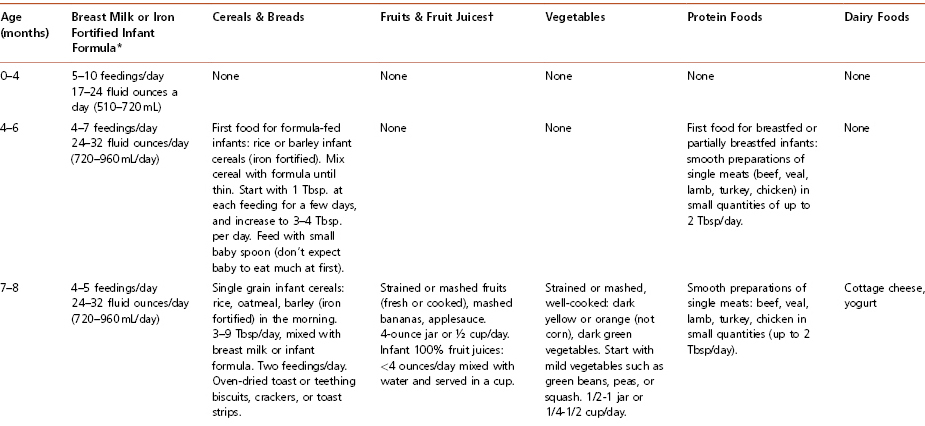
Most experts agree that new foods should be introduced gradually, with an interval of at least 3 days between successive new food introductions. Following this procedure makes it easier to detect a child’s inability to tolerate a newly introduced food. Table 4-8 summarizes how to feed an infant during the first year of life and is often very helpful to hand out to parents of infants.
Table 4-8 How to Feed Your Infant During the First Year of Life
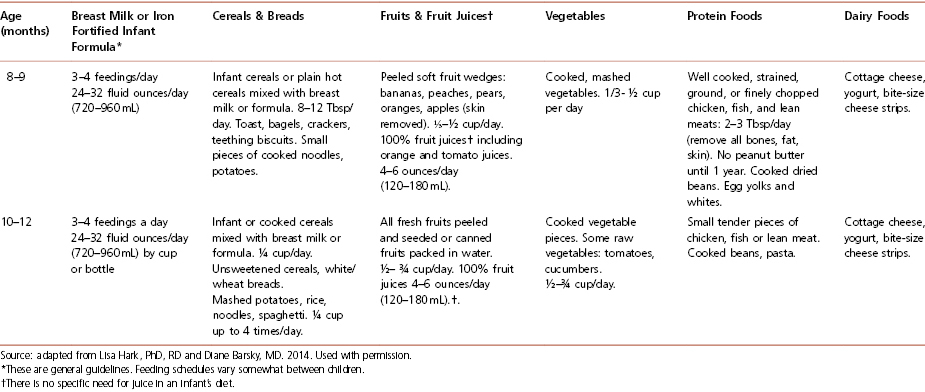
Cereals For formula-fed infants, iron-fortified cereals are the first recommended solid food. Generally offered first at 6 months of age, rice cereal is fortified with iron, is generally non-allergenic, and is usually well tolerated. Begin with 1 to 2 tablespoons in the morning, mixed with formula or breast milk. The cereal should be mixed to a consistency similar to that of applesauce. Cereal can be thickened as the child grows older. Feeding cereal from a spoon helps the baby learn this new skill, which takes a few weeks. Parents should be advised to avoid putting cereal in a bottle, as it does not, as commonly believed, help children to sleep through the night. Furthermore, the need to make a larger hole in the nipple to prevent clogging may cause a rapid intake of this viscous mixture and lead to choking.
Vegetables Cooked, strained vegetables, without added salt, either homemade or as commercially prepared baby food, are appropriate to start at 6 to 8 months of age. The importance of avoiding salt should be stressed. Infants do not require extra sodium, and adding salt may encourage a greater salt intake later in life. Raw vegetables that are soft or cooked (steamed) may be introduced at 1 year of age. Hard vegetables such as raw carrots should not be introduced until the child’s top and bottom molars have erupted and she can adequately chew and swallow these items without choking. It is advised that vegetables be introduced prior to fruits, because infants are likely to prefer the sweet taste of fruits to vegetables. Introducing vegetables first gives them a better chance of being accepted by the child.
Fruits and Fruit Juice Cooked and strained or pureed fruits, either homemade or purchased baby food without added sugar, may be started after rice cereal and vegetables. Fresh, mashed bananas also may be introduced at this time. Peeled, soft fruits such as peaches and pears may be cut into small pieces and started at 8 to 10 months of age. It is recommended that foods that are harder to chew, such as apples, should be deferred until the child has a greater capacity to chew. Juices made from 100 percent fruit, such as apple juice, may also be offered at this time. According to the AAP, no juice should be given to babies younger than 6 months of age. Juice intake should be limited to less than 4 ounces per day for children over 6 months to ensure adequate intake of other foods. Encourage parents to dilute juice with water and to only offer 100 percent juice without added sugars.
Parents who do not themselves eat a wide range of fruits and vegetables may hesitate to offer such foods to their infants. Research suggests that taste preferences are inherited, so if a parent does not like broccoli, there is an increased chance that the child will also not like it. However, as noted below, repeated offering of a new food may overcome a child’s initial resistance or rejection of an unfamiliar taste or texture.
Eggs In the past, experts recommended that cooked egg yolks be introduced to infants over the age of 6 months, but that the introduction of egg whites should be delayed until the child reaches 1 year of age because of the potential risk of inducing an allergy to eggs in younger infants. However, recent recommendations from the AAP state that there is no convincing evidence that delaying the introduction of highly allergenic foods, such as eggs, has a significant protective effect on the development of atopic disease.
Meat Red meat can be an important source of iron. For breastfed and partially breastfed infants, smooth preparations of single meat (beef, veal, lamb, turkey, chicken) are suggested as the first solid food. Recent research indicates that the early consumption of meats improves the iron and zinc status of the older infant. Meats should be well puréed to avoid the risk of choking. Iron supplementation of vegetarian breastfed babies who will not be given meat should be considered (elemental iron 1 mg/kg per day) if dietary sources of iron are not adequate.
Starch/Carbohydrates Children tend to like pasta, spaghetti, noodles, and dry cereal. However, other essential foods with higher nutrient density should be introduced first during the meal to ensure that the child’s diet is complete and balanced. Whole grains are recommended over their white counterparts for added nutrients and fiber and introducing whole grains early may help children to acquire a life-long taste for them.
Fats High saturated fat intake is associated with a greater risk of AVD and other conditions in adults. However, the high caloric density of fat makes it an important source of calories for the rapidly growing infant. Unfortunately, cases have been reported of failure to thrive, in which young children were fed an inappropriate, very low-fat, calorically inadequate diet, so it is important to provide guidance to ensure that children are receiving a nutritionally adequate diet if modification of fat intake is implemented. A longitudinal study has reported normal growth and development over more than 10 years in a group of children whose parents were counseled to follow a lower fat, nutritionally adequate diet starting in infancy.
To be prudent, the AAP recommends that dietary fat should not be limited before age 2. However, in order to support the development of healthy eating habits, children should not have the opportunity to eat popular high-fat foods such as french fries, chicken nuggets, pizza, macaroni, and cheese, every day.
Beverages Soft drinks such as soda (regular and diet) are acidic and contribute to dental caries in children by demineralizing and eroding tooth enamel. In addition, the sugar content of these beverages sustains bacterial growth around the teeth, which also produces acidic by-products that demineralize teeth and cause cavities. Soda and other sweetened beverages, such as juice drinks, iced teas, and sports drinks, can contribute to excess calorie intake. It is recommended that children and adults alike avoid consumption of such beverages. These beverages as well as 100 percent fruit juices may contribute to obesity. They should not be given to young children and only provided in limited amounts to older children. Juices provide nutrients, but commonly contain as many calories as soda.
Choking Hazards Parents and caregivers should be warned not to feed infants foods that pose a hazard for choking or aspiration. These include nuts, popcorn, grapes, raisins, raw carrots or celery, and hot dogs.
Psychosocial and Behavioral Implications and Recommendations
Eating habits formed in the first 2 years of life are thought to persist for several years, if not for a lifetime. Therefore, healthy eating patterns should be established as early as possible. New foods may need to be introduced 5 to 10 times before a child will accept them. Children imitate the eating behaviors that they observe, so parental role-modeling exerts a strong influence on a child’s development of healthy eating patterns. Children’s appetites vary with their growth rate and may fluctuate from day to day. Studies have shown that when children are allowed to determine on their own how much they eat, their intake may vary considerably from meal to meal, but over a period of several days, it will, in almost all cases, be appropriate to their needs.
Potential Feeding Problems
Children begin expressing personal preferences at an early age and simultaneously develop mechanisms for self-control. Parents must therefore take care to strike a balance between helping guide a child’s food choices to develop healthy eating habits and providing sufficient opportunities for experimentation and control. Over-controlling parental behaviors have been associated with a child’s decreased ability to appropriately control his/her own caloric intake. Children of authoritarian parents (those who set limits, but respect their child’s likes and dislikes) do best with regulating their own intake. Parents should provide children with a healthy selection of food and children should be allowed to determine how much food they need to eat. Children who consume a variety of foods over time and demonstrate appropriate growth are likely to be consuming an adequately balanced diet. Allowing children to dictate what and when they will eat likely promotes poor eating habits. Parents who worry that their child is not eating enough and allow the child to eat anything and at any time of the day simply to ensure that he or she eats something may be promoting poor eating habits.
Problems also surface when parents engage in power struggles with their children over eating issues. Toddlers and young children may experience “food jags” where they want to eat the same food for days at a time. Meeting the child’s request, while offering other healthy foods alongside the desired food, may be a better response than turning mealtime into a battle. Left on their own, children eventually will tire of the same food, but if winning each mealtime struggle is in the balance, these episodes may worsen.
Confusion and rushing at mealtimes, as well as distractions such as television, may also disrupt the formation of appropriate eating habits. The following are recommended best practices for caregivers feeding young children:
- Offer meals and snacks around the same time each day. Eating opportunities should be 2 to 4 hours apart. This allows the child to regulate his/her own hunger.
- Allow children to have only water between scheduled meals and snacks. Do not allow “grazing”.
- Sit with children at the table and eat together as often as possible. Engage in pleasant mealtime conversation as a family. Be a role model by eating healthful foods in front of young children
- Do not allow the child to dictate what will be served at meals and snacks. Caregivers are responsible for making this decision and should not short-order cook to cater to the likes of each child. However, ensuring that at least one food item offered is accepted by the child can make mealtimes easier.
- Do not force children to eat. Similarly, do not restrict them to only set portions. Healthy children are able to regulate their own hunger.
- Do not use food for bribing, rewarding, or punishing children.
Nutrition During Adolescence
Adolescents undergo major physical and psychological changes that affect their behavior and nutritional status. Issues of autonomy and rebellion, testing and searching behaviors, and the development of formal operational thought (logical reasoning) are all normal characteristics of adolescents that must be considered when addressing their nutritional needs and behavior.
Requirements for Growth
Adolescents’ energy and nutrient needs increase as they enter their pubertal growth spurt, but on a per kilogram basis, are generally lower than those of infants and children. Infants typically double their body weight over a few months, whereas older children and adolescents may double their weight over a period of 6 to 9 years. However, the energy needs of adolescents may vary considerably – between those whose activity level decreases considerably as they transition from a younger child who plays a lot to inactive “couch potatoes” and internet surfers, or those who are active multiple sport participants. The iron requirements of adolescent girls also increase as they begin to menstruate.
Lifestyle Issues
Adolescence marks a time of psychological, physical, and social changes that may influence eating habits. In particular, adolescents commonly have (1) a tendency to skip meals (especially breakfast and lunch); (2) sufficient money and opportunities to purchase foods (including fast foods) on their own outside the home or school environment; (3) increased consumption of “junk food” and sweetened beverages (adolescent males in particular); (4) a tendency to diet, particularly adolescent girls; (5) changes in physical activity including increased activity among adolescents participating in competitive sports or, conversely, decreased physical activity such as with non-athletic adolescents.
Some adolescents also explore restrictive dietary practices, fad diets, or vegetarianism that may put them at risk for vitamin, mineral, and trace element deficiencies. Eating disorders such as anorexia nervosa and bulimia nervosa also become a concern in adolescence. They occur across all major ethnic groups and all socioeconomic levels, and teen athletes may be at higher risk of developing an eating disorder, especially those participating in sports where low weight, a weight target or limiting weight gain is encouraged. Common features of eating disorders include dysfunctional eating habits, body image misperception, and rapid weight loss. Eating disorders are generally classified as mental health problems, therefore a team approach to treatment that includes medical management, psychological interventions, and nutritional counseling is recommended (see Chapter 4: Case 3).
Malnutrition in Childhood and Adolescence
For millennia, custom, ancestral teaching, seasonal availability and climate, and the luck of the hunter governed what was put on the table to nurture and sustain families, tribes, and societies. Travel, trade, agriculture industrialization, and now a global marketplace have altered the forces that govern available foods and diet. Choices of when, where, and how much to eat may still follow culture and custom, but they are also influenced by education, marketing, and socioeconomic status. Biological mechanisms that control eating and metabolism evolved in this historic context but now interact with a modern environment in which Western-style, calorie-dense foods are widely available and intensely promoted. High-energy-density foods such as fats and sweets are generally less expensive than low-energy-density foods such as fruits and vegetables. Furthermore, the cost of foods high in fat and simple carbohydrates rises little even during economic inflation while the cost of fruits, vegetables, dairy products, meat, and fish increases substantially. Despite our relative affluence, many United States children and adolescents are poorly nourished.
Undernutrition in Children
Undernutrition may be the result of a poor or suboptimal diet; total calorie intake may be inadequate or excessive, and specific nutrient intake may be inadequate or unbalanced. Adequate and appropriate nutrition during childhood and adolescence promotes normal growth and development. Furthermore, nutrition and physical activity during childhood and adolescence may influence disease risk, productivity, and quality of life during childhood and during adulthood. Inadequate calorie and nutrient intake may impair linear growth, neuro-cognitive development, and specific organ system development, and may increase mortality.
Malnutrition in pediatrics is poorly defined. The prevalence of underweight (defined as <5th percentile for age and sex-specific norms) in United States children and adolescents is below the expected rate of 5 percent. Among low-income children from birth to age 5 years, the overall prevalence of underweight decreased from 6 percent in 1995 to 4.7 percent in 2004. Although it is important to identify, evaluate, and treat underweight children, acute undernutrition is not currently considered a major public health concern in the United States. Much of the underweight and undernutrition observed in children occurs in those with medical conditions associated with altered metabolism, intestinal malabsorption, or decreased caloric intake (e.g., congenital heart disease, cystic fibrosis, inflammatory bowel disease, poorly controlled type 1 diabetes, and significant food allergy and intolerance). Athletes in certain sports (e.g., gymnastics, wrestling, distance running) who sometimes use extreme methods to lose or maintain weight should also be considered an at-risk group.
For the past two centuries, pediatricians in western societies have described malnourished children using the term “failure to thrive” (FTT). FTT is considered to be due to physical or psychological problems in early childhood that result in growth delay and cognitive deficiencies. However, there is no consensus on a FTT definition. Unlike undernutrition, the diagnosis of FTT is solely based on anthropometric parameters. Currently used anthropometric criterion for FTT include any of the following: (1) weight, 75 percent of median weight-for-age (Gomez criterion); (2) weight, 80 percent of median weight-for-length (Waterlow criterion); (3) BMI, <5th percentile; (4) weight-for-age, <5th percentile; (5) length-for-age, <5th percentile; (6) weight deceleration crossing more than two major percentile lines; percentile lines used: 5, 10, 25, 50, 75, 90, 95, from birth until weight within the given age group; and (7) conditional weight gain = lowest 5 percent, adjusted for regression towards the mean from birth until weight within the given age group. Unfortunately, the sensitivity and positive predictive value of single criteria are poor at detecting children with growth patterns likely to reflect significant undernutrition. It is therefore recommended to use several criteria to diagnose FTT.
Gross micronutrient deficiencies are rare in the United States, but the risk of deficiencies may be increased in certain situations. For example, laboratory anomalies may be observed during the refeeding syndrome (typically phosphorus, but also potassium, calcium, magnesium and thiamine) when rapidly feeding patients who are chronically or severely undernourished. Another example – deficiencies of fat-soluble vitamins – may occur with intestinal malabsorption and result in xerophthalmia (vitamin A) and peripheral neuropathy (vitamin E). Deficiencies following gastric bypass surgery (completed most commonly as a treatment for obesity) may be associated with vitamin B and D deficiencies. Signs and symptoms associated with vitamin deficiencies are described in Chapters 1 and 2.
Treatment of Deficiencies
Stay updated, free articles. Join our Telegram channel

Full access? Get Clinical Tree


