Fig. 5.1
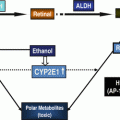
The reaction of acetaldehyde with deoxyguanosine results in the formation of N2-ethylidendene-dG; this unstable Schiff base can be converted through a reduction step to the more stable form: N 2-ethyl-dG (dR = 2′-deoxyribose)
The instability of N 2-ethylidene-dG prevents direct investigation of its biological properties. In contrast, N 2-ethyl-dG is stable in aqueous solution, as well as under the conditions used for automated oligonucleotide synthesis. Therefore, most of the experimental data available for the biological effects of N 2-ethylidene-dG are inferred from experiments using N 2-ethyl-dG as a stable analog. This is a common approach in the field of DNA damage and mutagenesis. For example, abasic sites in DNA, which result from depurination, are one of the most common forms of endogenous DNA damage [14]. Because authentic abasic sites are unstable, much of the information we have about their biological effects is derived from studies of tetrahydrofuran as a structural analog [15].
Studies in vitro indicate that N 2-ethyl-dG does not significantly inhibit the replicative DNA polymerase delta [16]. The effects of the lesion on the other major replicative DNA polymerase, epsilon, have not been directly assessed. However, in vivo studies in mammalian cells indicate that the lesion does block replication but is weakly mutagenic, causing primarily −1 frameshift deletion mutations [17–19]. In light of the discussion above, however, it is important to carefully evaluate the limitations of N 2-ethyl-dG as a structural analog.
Figure 5.2 shows energy-minimized models of an N 2-ethylidene-dG paired with dC, an N 2-ethyl-dG paired with dC, and an unmodified dG paired with dC. At first glance, all three models appear similar. The ethyl/ethylidene moiety can be accommodated in the minor groove, with no structural impediment to the guanosine base forming Watson–Crick type H bonds with the appropriate atoms on dC. However, one notable difference is that while dG and N 2-ethyl-dG each form three H bonds with dC, N 2-ethylidene-dG can only form two H bonds. The missing H atom is due to the presence of a double bond between the nitrogen atom and the carbon from acetaldehyde. Viewed from this perspective, the formation of N 2-ethylidene-dG essentially results in G:C base pair with the stability of an A:T base pair.
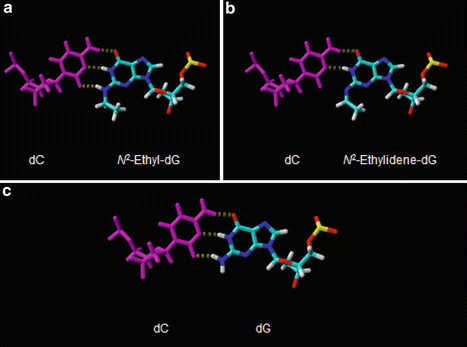

Fig. 5.2
Energy-minimized models showing the difference in base pairing of N 2-ethylidene-dG and N 2-ethyl-dG compared to deoxyguanosine. Panel A: the model shows N 2 -ethylidene-dG paired with deoxycytosine (dC). Panel B: the model shows N 2 -ethyl-dG paired with dC. Panel C: the model shows an unmodified dG paired with dC
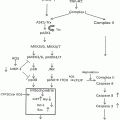
Studies of frameshift mutagenesis in experimental systems have documented that runs of A:T base pairs are prone to frameshift mutations resulting from a template dislocation mechanism [20]. This observation has generally been explained by the reduced stability of A:T base pairs, which increases the probability of primer-template misalignment resulting in frameshift mutations. Adapting this model to N 2-ethylidene-dG in a run of G:C base pairs, an analogous mechanism for frameshift mutagenesis can be hypothesized (see Fig. 5.3). The important point is that it would not be possible to test this hypothesis using N 2-ethyl-dG as a model, because N 2-ethyl-dG forms three H bonds with dC (as shown in panel A of Fig. 5.2). However, this hypothesis could be tested in vivo, perhaps using a yeast strain with run of G:C base pairs in a mutational reporter gene. It should be pointed out, however, that runs of G:C base pairs are generally refractory to frameshift mutagenesis due to their inherent stability.
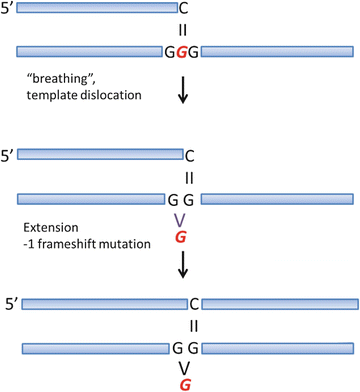

Fig. 5.3
Mechanisms of frameshift mutagenesis hypothesized for N 2 -ethylidene-dG
5.2.1 Other Acetaldehyde-DNA Adducts
In addition to N 2-ethylidene-dG, the most well-studied acetaldehyde-related DNA adducts are the crotonaldehyde-derived propano-dG (CrPdGs) adducts [21]. The condensation of two molecules of acetaldehyde can also produce a reactive electrophile, 3-hydroxybutanal (crotonaldehyde), which can also form a Schiff base on the same amino group of dG. These CrPdG adducts can have multiple biologic effects as a result of their ability to undergo a ring opening reaction. Ring opening yields another aldehyde moiety which can react with proteins to form DNA-protein cross-links or (in some sequence contexts) with deoxyguanosine on the opposite strand to form DNA-interstrand cross-links. The biological effects of these adducts have been reviewed recently [8].
It is also worth mentioning the early studies of Fraenkel-Conrat and colleagues, who showed that ethanol and acetaldehyde in combination could react with DNA bases to generate mixed acetal DNA adducts [22]. However, these adducts were very unstable, at least under the in vitro conditions investigated. As such, the biologic significance of these adducts, if any, is currently unclear.
In summary, acetaldehyde has been shown to form several DNA adducts, including N 2-ethylidene-dG and the CrPdG adducts. Under in vivo conditions, which are of the most direct relevance to human carcinogenesis, N 2-ethylidene-dG has been the most well studied, and therefore, we review these studies in the following paragraphs.
5.3 N 2-Ethylidene-dG as a Biomarker of DNA Damage Resulting from Acetaldehyde Derived from Ethanol
As mentioned above, the major reaction of acetaldehyde with DNA occurs on the exocyclic amino group of guanine forming N 2-ethylidene-dG. This adduct is stable in DNA but it easily breaks down when released as a nucleoside. Fang et al. were the first to report the detection of this adduct, as its reduced form N 2-ethyl-dG, in leukocyte DNA of alcoholics. In their work a 32P-postlabelling method was used for the adduct quantitation. Only samples from heavy drinkers showed detectable amounts of N 2-ethyl-dG likely resulting from the reduction of N 2-ethylidene-dG by endogenous reducing agents such as ascorbic acid and glutathione [23].
In order to avoid the degradation of N 2-ethylidene-dG during DNA hydrolysis and increase the sensitivity of the method, a new approach was developed by Wang et al. [24]. A reducing agent, NaBH3CN, was introduced prior to DNA hydrolysis. Additionally, a stable isotope dilution method was used for the quantitation of the DNA adduct by liquid-chromatography-electrospray ionization-tandem mass spectrometry-selected reaction monitoring (LC-ESI-MS/MS-SRM). The use of this new method allowed a selective detection of N 2-ethyl-dG and an accurate quantitation. By reducing the degradation of the adduct through its conversion into a more stable compound, N 2-ethyl-dG was detected in DNA from all samples analyzed. This resulted in an increased sensitivity which allowed for the detection of lower levels of the DNA adduct, expanding its application beyond the quantitation in samples from heavy drinkers, and set the stage for the broader use of this adduct as a marker for acetaldehyde-induced DNA damage. Since then, N 2-ethyl-dG has been measured in DNA from various samples, for the investigation of the effects on DNA of acetaldehyde from different sources [25, 26].
N 2-Ethyl-dG has been used successfully to measure ethanol-induced DNA damage in HeLa cells expressing ADH1B, which corresponded to the activation of the Fanconi anemia-breast cancer susceptibility (FA-BRCA) DNA damage response network [27]. In a different study, the same DNA adduct was quantified to investigate ethanol-induced DNA damage in the brain of ethanol-treated mice. Higher levels of N 2-ethyl-dG were observed in brain DNA from mice exposed chronically and acutely to ethanol compared to controls [28]. These examples demonstrate that N 2-ethyl-dG is an extremely valuable tool for the investigation of DNA damage associated with acetaldehyde exposure from alcohol consumption and thus for the investigation of alcohol-related mechanisms of carcinogenesis.
The measurement of levels of N 2 –ethyl-dG has indeed been crucial in studies focusing on the investigation of effects of alcohol exposure in ALDH2 deficiency. Several studies have used this adduct to detect the DNA damage induced by ethanol exposure in wild-type and Aldh2 knockout mice, used as a model for ALDH2 deficiency in humans. Increased levels of the adduct have been found in the liver, esophagus, tongue, and submandibular gland DNA of Aldh2 knockout mice exposed to ethanol [29, 30]. These findings, together with the results from a study showing increased levels of N 2 –ethyl-dG in peripheral blood of ALDH2-deficient alcoholics [31], contributed substantially to the evidence supporting an acetaldehyde-mediated mechanism in alcohol-related carcinogenesis. Together with the epidemiological data showing a dramatic increase of risk for esophageal and head and neck cancers in ALDH2-deficient drinkers, the results from the DNA damage studies contributed to the classification of acetaldehyde related to alcohol consumption as carcinogenic to humans (Group 1) by the IARC [3].
5.3.1 Experimental Studies of Acetaldehyde-DNA Adduct Formation from Alcohol Drinking in Humans
The studies described above clearly demonstrate that increased levels of acetaldehyde-DNA adducts can be observed in animals exposed to ethanol and in human alcohol abusers. However, the studies do not address the minimal amount of ethanol exposure necessary to increase DNA adduct levels or the time course or persistence of the adducts. Moreover, previous studies have not specifically investigated acetaldehyde-DNA adduct formation in humans in a known target tissue for alcohol-related carcinogenesis. Overall, little is known about the formation and lifetime of DNA adducts in the human body. Experimental studies have shown that with constant dosing a steady state concentration of DNA adducts will occur, where the number of new adducts formed equals the number of adducts lost due to repair or instability. However, repair processes vary depending on the cell type and remove different adducts with various efficiencies. Consequently, the lifetime of DNA adducts in vivo can be highly variable according to the tissue or cell type in which they are formed [32]. For instance, easily accessible surrogate tissues such as buccal cells or peripheral blood cells have very different lifetimes. In particular peripheral blood white cells include large cell subpopulations with major differences in lifespan. Lymphocytes are long-lived cells with a life span up to several years, while neutrophils are extremely short-lived cells with a life span of 2–3 days. The quantitation of N 2-ethylidene-dG in these cell types could potentially reflect very different exposure effects and provide very different information on the formation, accumulation, and elimination of the DNA adduct. Therefore, to address these important questions, Balbo et al. performed a biomonitoring study on human subjects before and after consumption of increasing amounts of ethanol [33, 34].
Ten healthy volunteers were recruited. Subjects were required to refrain from any alcohol consumption other than that administered for the study, starting from 1 week prior to the beginning of the experiment and throughout its entire duration. Three increasing alcohol doses were administered during the experiment, one dose a week, starting from the lowest. The alcohol dose administered was selected taking into account gender and weight in order to target specific blood alcohol levels, all below intoxication (defined as a blood alcohol level of 0.08 % [35]). The 3 doses selected for the study can roughly be described as corresponding to 1, 2, and 3 vodka drinks per subject. Overall, the alcohol doses had an ethanol content that ranged between 20 and 50 g which corresponded to an ethanol concentration in the drink ranging between 1.5 and 2.5 M. These concentrations ultimately resulted in a final blood alcohol concentration in the range of 0.01–0.02 M.
Levels of N 2-ethyl-dG were measured in DNA isolated from oral cells collected with a nonalcoholic mouthwash and from white blood cells. Granulocytes and lymphocytes were isolated from the blood to test potential effects of different cellular life span and repair mechanisms. A sample was collected before drinking to establish a baseline and then at several time points after exposure to each dose (2, 4, 6, 24, 48, and 120 h) to assess the kinetics of adduct formation and disappearance.
Considering the results from the oral cavity first, as shown in Fig. 5.4, increased levels of N 2-ethyl-dG were already detected at 2 h after alcohol consumption and reached a peak between 2 and 6 h. Interestingly, adduct levels had returned to baseline after 24 h, indicative of either DNA repair or cell turnover. We will return to this point in the discussion of the histology of the oral epithelia (discussed in detail below). Most importantly, peak adduct levels showed a clear dose–response relationship to the amount of alcohol consumed.
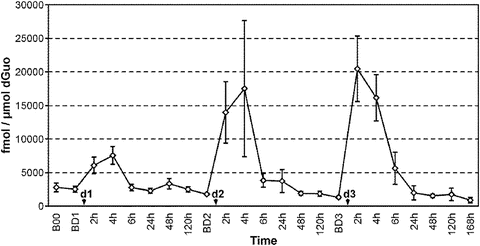

Fig. 5.4
Summary of the results obtained from a study investigating the effects on oral cell DNA of consumption of increasing doses of alcohol. The study was performed on samples collected form ten subjects who abstained from drinking any alcoholic beverage other than the doses provided over the entire duration of the study. The graph reports the mean levels of N 2 -ethyl-dG (fmol/μmol dG) measured in oral cell DNA at various intervals before and after three increasing alcohol doses. The first time point reported on the left (B00) refers to 1 week before consumption of the first alcohol dose. Starting from this time point, participants began to abstain from consuming any alcoholic beverage. The next time point (BD1) refers to the baseline level detected 1 week later, 1 h before consumption of the first dose (d1, lowest). Subsequently, the graph shows the levels of N 2 -ethyl-dG measured at the various time points considered after each dose (2–120 h). The DNA adduct levels were measured at the same time points before and after exposure to the next two doses (d2, intermediate, and d3, highest). Levels of the adduct increased 2 h after exposure even after consumption of the lowest dose and returned to baseline 24 h after exposure. A clear dose–response effect of alcohol on N 2 -ethyl-dG levels was found. The baseline time points measured 1 h before the dose (BD1–BD3) are 7 days apart. Values are means and SEs. Data from reference [33, 34]
A different pattern of adduct formation was observed in white blood cells after alcohol drinking. Quantitation of the DNA adduct in granulocytes and lymphocytes did not show a major difference between the two cell types. An increase after the alcohol doses was detected, but in contrast to the oral cavity, no clear dose response was observed. Additionally, the high baseline levels and the high intra- and interindividual variability did not allow the clear identification of an effect directly attributable to the alcohol dose.
To our knowledge, this is the first study to investigate the effects of alcohol consumption on the time course of DNA adduct formation in healthy volunteers. All previous published studies on N 2-ethyl-dG levels in humans were done on heavy drinkers or alcoholics [23, 29]. Furthermore, no information on the persistence of this specific modification was reported. These results clearly demonstrate that even a single drink of alcohol results in a significant and dose-dependent increase in acetaldehyde-DNA adducts in cells in the human oral cavity, a known target tissue for alcohol-related carcinogenesis.
While N 2-ethylidene-dG is the major adduct formed after reaction of acetaldehyde with DNA, as mentioned above, several other adducts can result from acetaldehyde reactions with DNA, although generally they are formed in lower yield. Because of its high levels, N 2-ethylidene-dG is easier to detect and measure and thus could be considered as a general indicator of exposure of DNA to acetaldehyde and a proxy for detection of other DNA modifications. Consequently, these results provide a good starting point for future studies focusing on mapping multiple acetaldehyde-derived DNA modifications and investigating their potential role in the carcinogenic process.
These findings demonstrate the utility of oral cell DNA for the investigation of the role of alcohol-related DNA adducts in head and neck carcinogenesis. These observations support the hypothesis that alcohol drinking increases the risk of oral cancer via a mechanism involving a genotoxic effect of acetaldehyde. Before exploring this question in more detail, however, it is necessary to put the results from Balbo et al. into the relevant cellular context. For this purpose, below we briefly review the anatomy and histology of the oral cavity and esophagus.
5.3.2 Anatomical Considerations
A fundamental aspect of genotoxic carcinogenicity is the formation of mutagenic DNA adducts in proliferating cells. If left unrepaired, these adducts can result in mutations during DNA replication, which are passed on to daughter cells during mitosis. DNA adducts that form in terminally differentiated cells (G0) do not directly contribute to carcinogenesis, because of the absence of DNA replication. As such, it follows that a key issue for interpreting the relationship between DNA adduct formation and carcinogenesis is the cell type in which the DNA adduct formed.
The oral cavity and esophagus are both squamous epithelial tissues, in which cells in the upper layers are continuously replaced by new cells generated in the lower layers (for review see [36]). A schematic representation of these tissues is shown in Fig. 5.5. As indicated in the figure, proliferating cells (i.e., cells that replicate their DNA) are located in the basal and suprabasal layers of the epithelium. After differentiation, cells move up toward the surface of the epithelial layer. During transit, these cells flatten out (desquamate) and are ultimately sloughed off into the saliva or lumen of the esophagus. The time for newly generated cells in the oral cavity to transit from the basal layer through the surface of the (non-cornified) epithelial layer has been estimated at roughly 4 days (in rabbits) [22, 37]. As the DNA labeling index of cells in the basal layers of humans and rabbits is similar, the 4-day transit time is likely to be a reasonable estimate for humans as well.
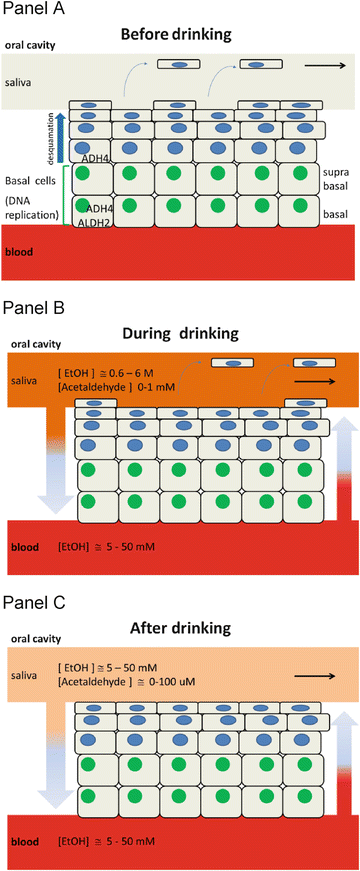

Fig. 5.5
Schematic representation of the squamous epithelial tissue of the oral cavity before, during, and after alcohol drinking. Panel A shows the various cell layers: cells in the upper layers are continuously replaced by new cells generated in the lower layers, the basal and suprabasal layers of the epithelium, where proliferating cells (i.e., cells that replicate their DNA) are located. After differentiation, cells move up toward the surface of the epithelial layer. During transit, these cells flatten out (desquamate) and are ultimately sloughed off into the saliva. Panel B shows the levels of exposure to alcohol and to acetaldehyde of the various levels of the epithelium when drinking alcohol. In addition to high concentrations of ethanol and acetaldehyde diffusing from the epithelial surface downward into the deeper cell layers (brown arrow), some alcohol reaches the blood stream from where it can diffuse into epithelial cells (red arrow), allowing metabolism to acetaldehyde in situ. Acetaldehyde levels in the blood are very low and considered negligible for this model. Panel C illustrates the levels of exposure to ethanol and acetaldehyde of the various layers of the epithelium after alcohol drinking when the ethanol concentration levels between the saliva and the blood stream reach the equilibrium
When drinking alcohol, the oral cavity and esophagus are transiently exposed to alcohol and acetaldehyde concentrations that are essentially the same as those in the beverage itself. While the time of exposure is only on the order of seconds, the alcohol and acetaldehyde concentrations can be very high. For example, the concentration of ethanol in hard liquor (100 proof) is roughly 7–8 M, in wine approximately 2 M, and in beer between 500 and 700 mM. Acetaldehyde concentrations in alcoholic beverages can vary between undetectable levels (vodka) to roughly 200 mM or more, depending on the beverage [38, 39]. By 30 min after alcohol drinking, salivary ethanol levels have largely equilibrated with blood levels [40, 41].
Stay updated, free articles. Join our Telegram channel

Full access? Get Clinical Tree


