Highlights
- •
The percentage of patients undergoing radical prostatectomy who are obese (BMI > 30) and morbidly obese (BMI > 40) are increasing, and obese patients had a higher risk of noncancer mortality.
- •
Obese men had a higher risk of early complications and positive margins at the time of surgery.
- •
Obese patients also had a higher risk of postoperative impotency compared to nonobese patients.
- •
Obese patients did not have a higher risk of postoperative incontinence.
- •
Obese patients did not have a higher risk of metastasis or cancer mortality.
Abstract
Background
In this study we aimed to explore the impact of BMI on perioperative complications, functional outcomes, and oncologic outcomes and longitudinal outcomes.
Methods
We queried our prospectively maintained radical prostatectomy (RP) registry from 1986 to 2018 for patients with cM0 prostate adenocarcinoma without prior BPH surgery or radiation therapy. Preoperative BMI was associated with the following outcomes of interest: 30-day complications, 1-year functional outcomes, and oncologic outcomes. Logistic regression analyses were used for complications and surgical outcomes and competing risk Cox proportional hazard models were used for oncologic outcomes.
Results
In a cohort of 21,604 patients, 28.9% and 1.0% had BMI > 30 (N = 6,252) and BMI > 40 (N = 222), respectively. Obese patients were more likely to have positive surgical margins (29.4% vs. 25.0%, P < 0.001) and early complications (15.0% vs. 11.1%, P < 0.001) and these were confirmed on multivariable analysis: OR 1.04 ( P < 0.001) and OR 1.04 ( P < 0.001), respectively. RP on obese patients also had increased operative times and blood loss. Increasing BMI was associated with lower odds for recovering potency (OR 0.95, P < 0.001) but was not associated with lower rates of postoperative continence (OR 1.005, P = 0.403). On multivariable competing risk analysis, patients with BMI > 30 had higher odds of nonprostate cancer mortality but no difference in biochemical failure, metastasis or cancer-specific survival.
Conclusions
RP in obese patients can be technically challenging but delivers similar oncologic outcomes to nonobese patients. This information can be useful for patient counseling to support the use of radical prostatectomy in appropriately selected obese patients.
1
Introduction
In 2020, prostate cancer was the third most frequently diagnosed cancer worldwide, with over 1.4 million reported cases [ ]. In the United States, the annual rate of radical prostatectomies exceeds 1200 per million males over 45 years of age [ ]. Concurrently, obesity represents a significant public health concern, affecting more than one-third of the adult population in the U.S. [ ]. The coexistence of these prevalent conditions among patients creates unique challenges. Obesity may not only increase technical complexity during radical prostatectomy, but also possibly influences the emergence and progression of prostate cancer through its metabolic impacts [ , ].
Prior studies have consistently demonstrated an association between obesity and unfavorable perioperative outcomes during prostate surgery, including prolonged operative times, greater blood loss, and higher risk of conversion to open surgery [ ]. There is less consensus regarding the impact of obesity, and related comorbidities like diabetes, on long-term oncologic outcomes following prostatectomy, with current studies showing mixed results [ ]. Attempts to draw conclusions from prior studies is also limited by the heterogeneity in definitions of oncologic outcomes and lack of rigorous controls for comorbidities across subjects [ , ]. Our previous institutional report examining the impact of obesity on robotic radical prostatectomy outcomes analyzed data from our first 400 cases of which only 119 were performed on obese patients [ ]. This low number of patients prevented the prior study from ruling out smaller magnitude associations between obesity and prostatectomy outcomes.
As such, this study aims to build upon prior literature by utilizing a large institutional cohort to explore associations between obesity and longitudinal oncological outcomes after prostatectomy. In addition, it aims to explore relationships between BMI and surgical pathology findings, postoperative complications, and functional outcomes. Given recent findings suggesting differential oncologic and perioperative outcomes in diabetic patients [ ], this study will also evaluate diabetes as an effect modifier. Through the use of a large cohort with robust long-term follow-up, this study intends to advance understanding of how obesity impacts prostate cancer prognosis across multiple domains. Defining these associations more precisely can ultimately help guide clinical decision-making for the large population of obese men impacted by prostate cancer.
2
Methods
2.1
Cohort selection
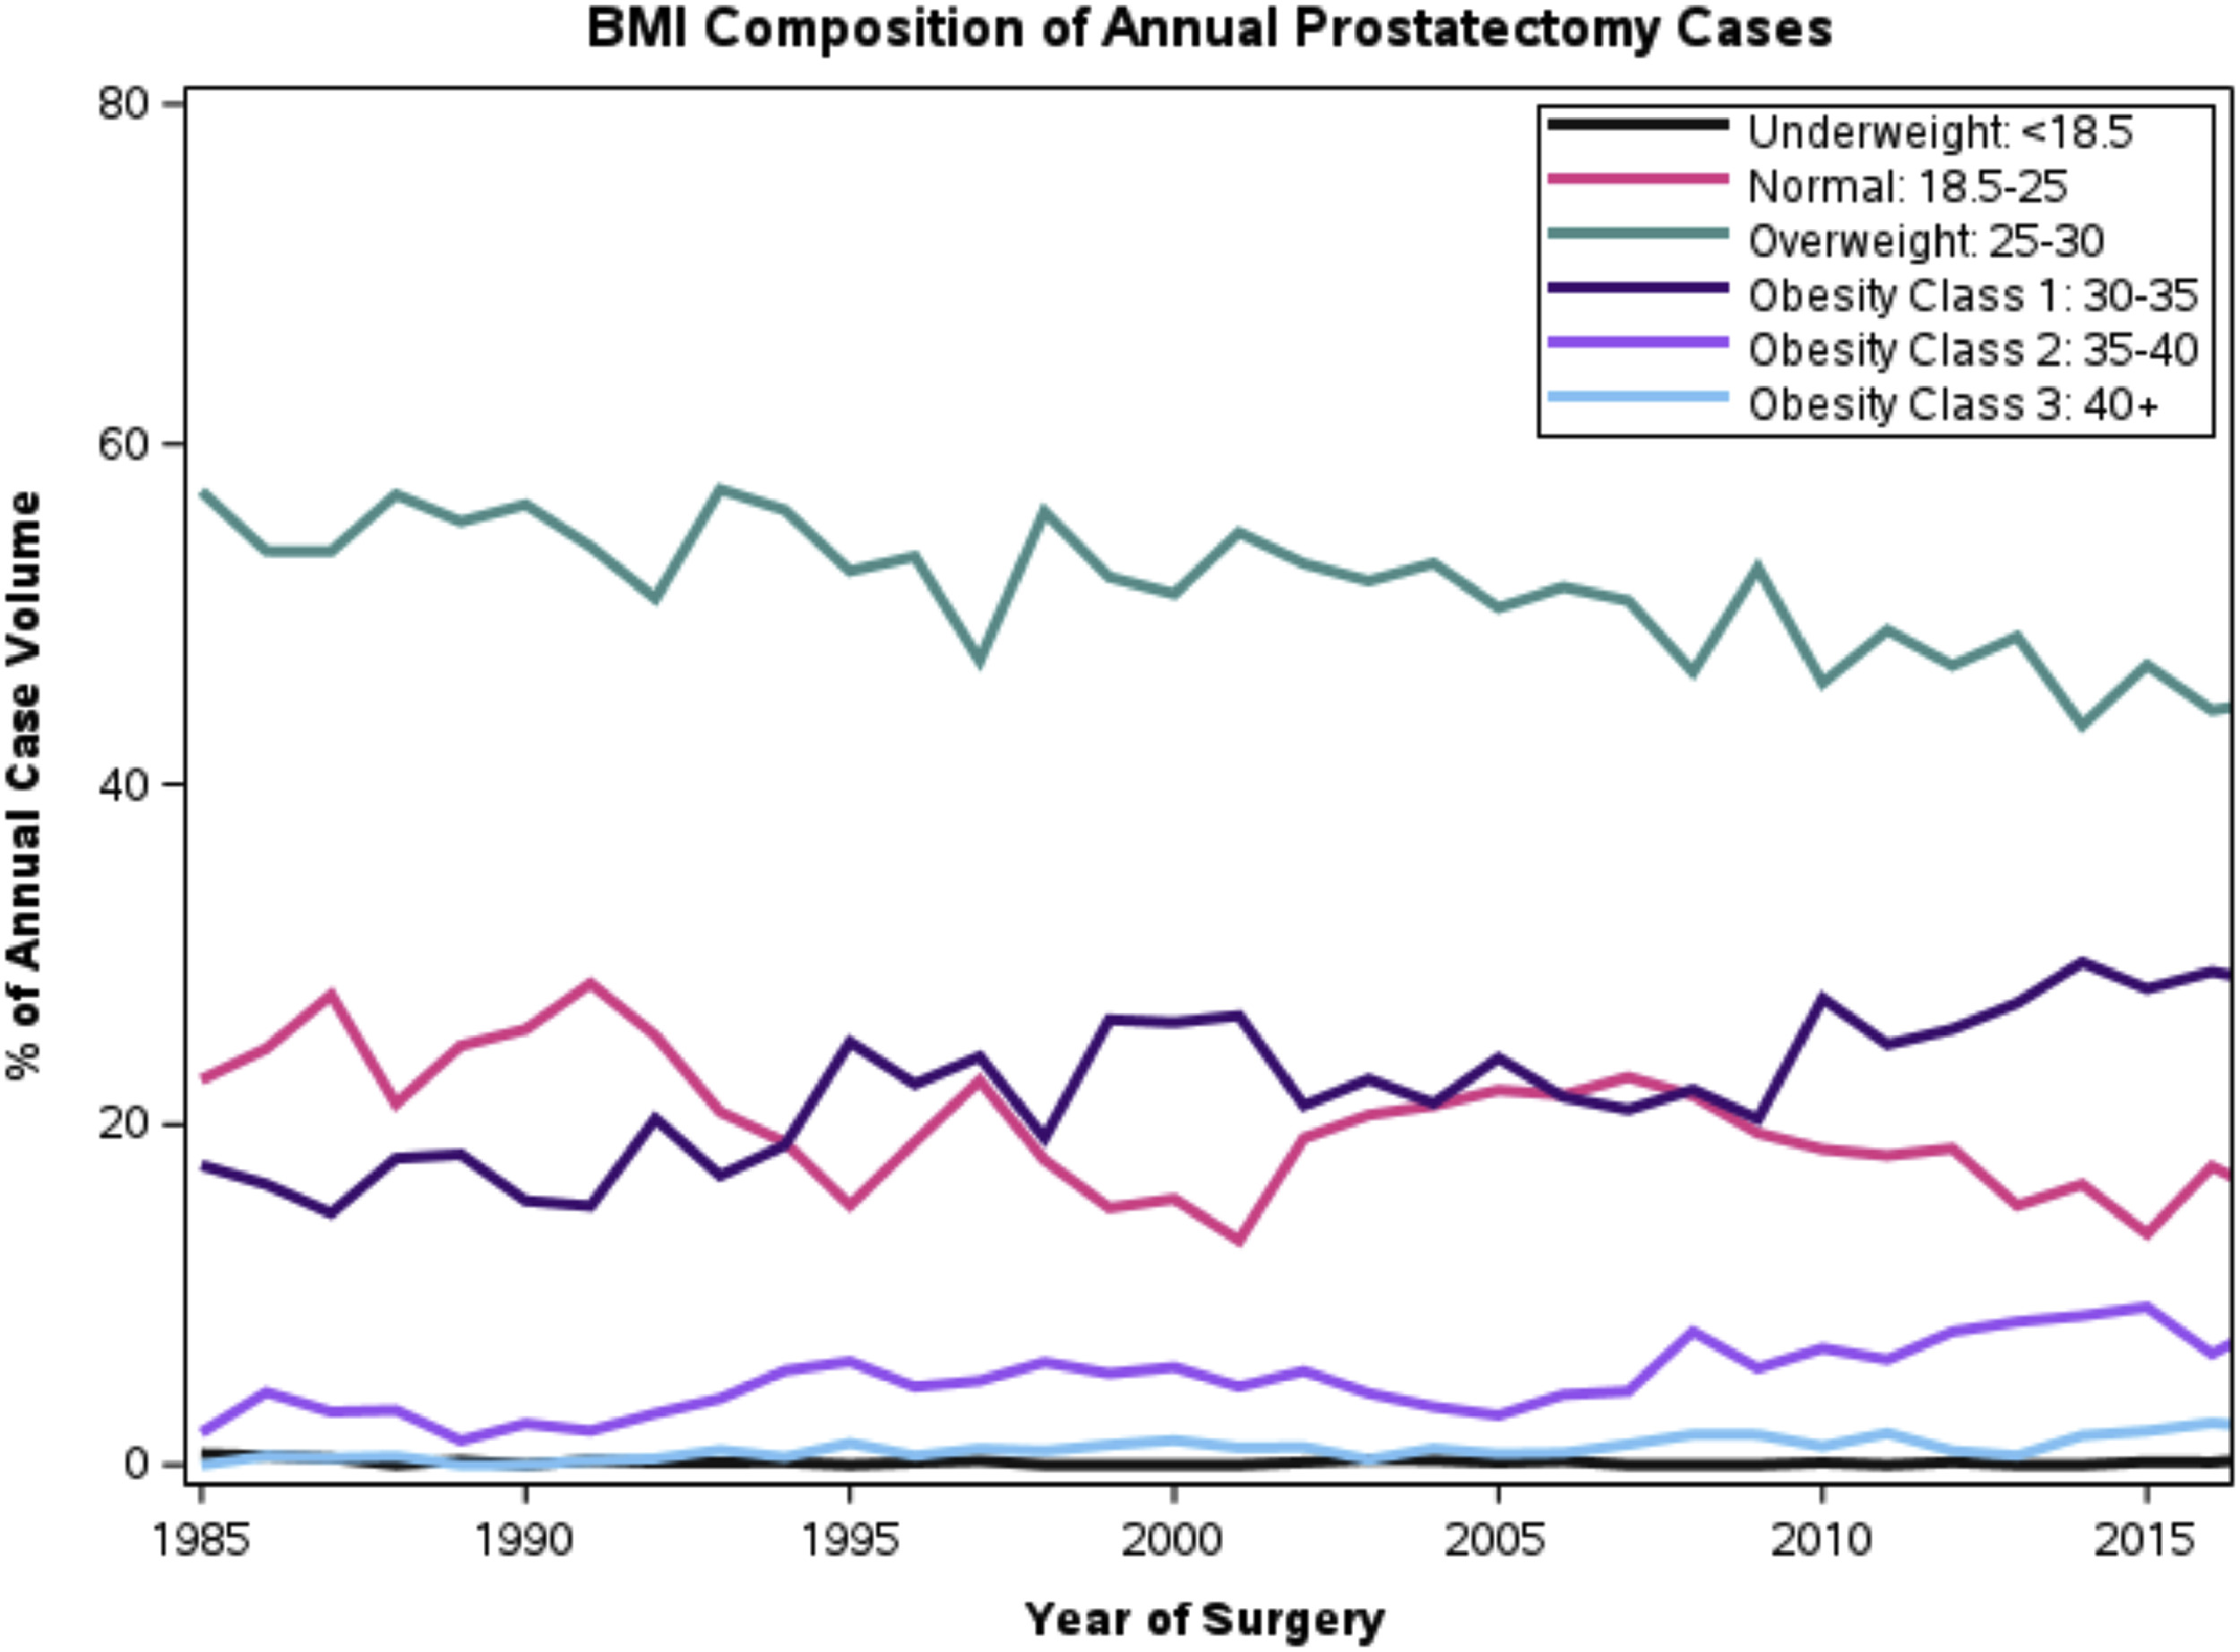
Conduct of this study was in accordance with ethical guidelines and received Institutional Review Board (IRB) approval. Prospectively collected data was utilized from an institutional registry of patients who underwent radical prostatectomy (RP) from 1985 to 2017. This study included open and robotic laparoscopic approaches. Eligibility for inclusion was pathologic confirmation of prostate adenocarcinoma with localized disease. Patients were excluded if they had any pathologic variant, had previously undergone any prostate procedure (including transurethral resection of the prostate, prostatic urethral lift, photoselective vaporization of the prostate, and simple prostatectomy), or had received any form of radiation therapy. Additionally, patients presenting with metastatic disease at the time of prostatectomy were not considered. Body mass index (BMI) was used to define obesity. BMI was binned in line with the CDC/WHO guidelines: Underweight: BMI <18.5, Normal weight: BMI 18.5 to 24.9, Overweight: BMI 25.0 to 29.9, Obesity (Class 1): BMI 30.0 to 34.9, Obesity (Class 2): BMI 35.0 to 39.9, Extreme Obesity (Class 3): BMI ≥ 40.0 [ ].
2.2
Oncologic outcomes of interest
The primary oncologic outcomes of interest were to assess the association of BMI with BCR, metastasis free survival (MFS), prostate cancer specific survival (CSS), and overall survival (OS). In addition, nonlocalized disease (defined as pT3+) was also examined. Postoperative follow-up, including physical examination and serum PSA measurement, was generally performed quarterly for the initial 2 years, semiannually for the next 2 years, and annually thereafter. BCR was defined as a single postoperative PSA of 0.4ng/mL or greater [ , ]. For men receiving follow-up elsewhere, the Prostatectomy Registry monitors outcomes annually by soliciting both provider and patient correspondence.
2.3
Nononcologic outcomes of interest
Secondary outcomes of interest were nononcologic postoperative outcomes thought to be relevant to a patient’s body habitus and the corresponding difficulty of performing surgery [ ]. These included positive surgical margins, complications and functional outcomes. Any positive surgical margin regardless of length on final pathologic section was considered as positive.
Early complications (≤ 30 days post – RP) captured in the registry: included hemorrhage, urethral stricture, extravasation, hernia, wound infection, ureteral obstruction, sepsis, renal failure, UTI, vesicourethral anastomotic contracture, urinary retention, aortic occlusion, DVT, evisceration, lymphocele, myocardial infarction, pulmonary embolism, lymphedema, allergy, respiratory, gastrointestinal tract, and central nervous system complications.
For functional outcomes: continence and potency were studied. Continence at 1 year postoperatively (evaluated only among patients with preoperative continence) was defined as 0 pads per day or seldom wet. Potency at 1 year postoperatively (evaluated only among patients with sufficient preoperative erectile function) was defined as the ability to achieve an erection sufficient for intercourse regardless of use of PDE-5 inhibitors.
2.4
Covariates for adjustment
Additional clinicopathologic features recorded included age at surgery, year of surgery (treated as a continuous variable with an effect size per 10 year intervals), preoperative PSA, history of preoperative ADT, clinical tumor stage according to the American Joint Committee on Cancer staging [ ], pathologic TNM stage, Gleason score at RP, margin status, tumor volume, and receipt of adjuvant radiotherapy or ADT.
2.5
Statistical analyses
Continuous features were summarized with means and standard deviation and compared using analysis of variance (ANOVA). Categorical features were summarized with frequency counts and percentages compared using the χ2 test for categorical variables. Long term oncologic outcomes were compared across BMI categories with multivariable Cox regression models using nonprostate cancer mortality as a competing risk. Given prior reports of diabetes modifying the effect of BMI [ ], subset analysis was conducted between obesity status (BMI 30 or greater) and diabetes status for the subset of patients with known diabetes status. Multivariable logistic regression models were used for all nontime dependent outcomes: pathologic T stage (T3+), positive margins, complications, and functional outcomes. The multivariable models incorporated the following covariates: age (continuous), surgical year (continuous), surgical approach (open vs. laparoscopic), receipt of adjuvant hormonal therapy or adjuvant radiation, log-base-2 PSA, pathologic stage (this was clinical stage for pT3 outcome), pathologic Gleason score (8–10 vs. <8). For functional outcomes, nerve-sparing status was an additional covariate. Statistical analysis was performed using SAS © (9.4). All tests were 2-sided, with P < 0.05 considered statistically significant.
3
Results
3.1
Cohort description
Among the cohort of 21,602 patients ( Table 1 ), 6,252 (28.9%) were obese (BMI > 30) and 222 (1.0%) were morbidly obese (BMI 40+). The number of obese patient undergoing surgery has increased over the 30 year study period: 19.5% obese in 1985 to 38.9% obese in 2017 ( Fig. 1 ).Obese patients were more likely to undergo conversion from laparoscopic to open surgery compared to nonobese patients (0.26% vs. 0.13%, P < 0.001). The chances of bilateral nerve sparing was highest for the BMI 18.5 – 24.9 group (65.1%) compared to the BMI <18.5 (51.9%) and BMI 40+ (61.8%) ( P < 0.001) groups. Operative time increased with higher BMI: from a mean of 234mins in BMI 0 to 25 to 280mins in BMI 40+. Similarly, median blood loss increased with higher BMI: 379.1 cc in BMI <18.5 to 547cc in BMI 40+.
| Body mass index | ||||||||
|---|---|---|---|---|---|---|---|---|
| Underweight: <18.5 | Normal: 18.5–24.9 | Overweight: BMI 25–29.9 | Obesity class 1: BMI 30–34.9 | Obesity class 2: BMI 35–39.9 | Obesity class 3: BMI 40 or above | Total | ||
| (N = 27) | (N = 4286) | (N = 11039) | (N = 4899) | (N = 1131) | (N = 222) | (N = 21604) | P value | |
| Age at surgery, y (mean (SD)) | 65.4 (6.9) | 62.7 (7.4) | 62.4 (7.1) | 61.9 (6.9) | 61.2 (6.6) | 59.5 (6.0) | 62.3 (7.1) | < 0.001 |
| Open conversion N (%) | 1 (3.7%) | 4 (0.1%) | 15 (0.1%) | 14 (0.3%) | 2 (0.2%) | 0 (0.0%) | 36 (0.2%) | < 0.001 |
| Duration of surgery, mins (mean (SD)) | 227.9 (62.5) | 251.6 (65.9) | 250.7 (64.2) | 253.6 (63.2) | 265.5 (63.8) | 279.7 (64.7) | 252.8 (64.4) | < 0.001 |
| Number of laparoscopic procedures | 4 (14.8%) | 1079 (25.2%) | 2855 (25.9%) | 1556 (31.8%) | 444 (39.3%) | 103 (46.4%) | 6041 (28.0%) | < 0.001 |
| Blood loss, cc (mean (SD)) | 379.1 (199.3) | 478.2 (419.2) | 533.8 (669.0) | 548.2 (467.3) | 562.7 (467.1) | 546.7 (401.4) | 527.5 (571.5) | < 0.001 |
| Nerve sparing procedure N (%) | 14 (51.9%) | 2778 (64.9%) | 7051 (63.9%) | 3112 (63.6%) | 710 (62.8%) | 136 (61.8%) | 13801 (63.9%) | 0.208 |
| Pos surgical margin N (%) | 6 (22.2%) | 974 (22.7%) | 2867 (26.0%) | 1417 (28.9%) | 347 (30.7%) | 72 (32.4%) | 5683 (26.3%) | <.001 |
| Pathology T-stage (T3/T4) | 5 (19.2%) | 945 (22.2%) | 2503 (22.8%) | 1167 (23.9%) | 259 (23.0%) | 59 (26.8%) | 4938 (23.0%) | 0.272 |
| Pathological gleason score(8–10) | 1 (4.2%) | 280 (6.8%) | 795 (7.5%) | 441 (9.2%) | 104 (9.4%) | 35 (16.0%) | 1656 (7.9%) | < 0.001 |
| Early urologic complications | 2 (7.4%) | 467 (10.9%) | 1213 (11.0%) | 695 (14.2%) | 187 (16.5%) | 47 (21.2%) | 2611 (12.1%) | < 0.001 |
| Radiation treatment—adjuvant (<90da) | 0 (0.0%) | 133 (3.1%) | 432 (3.9%) | 193 (3.9%) | 46 (4.1%) | 7 (3.2%) | 811 (3.8%) | 0.165 |
| Hormonal treatment—adjuvant (<90da) | 1 (3.7%) | 393 (9.2%) | 1027 (9.3%) | 439 (9.0%) | 96 (8.5%) | 21 (9.5%) | 1977 (9.2%) | 0.834 |
| Return of continence at 1 y | 22 (95.7%) | 3500 (89.5%) | 9135 (90.4%) | 3988 (90.9%) | 915 (91.9%) | 176 (90.3%) | 17736 (90.4%) | < 0.001 |
| Return to preop potency at 1 y | 4 (28.6%) | 767 (29.8%) | 1871 (28.5%) | 639 (23.6%) | 138 (23.2%) | 24 (22.0%) | 3443 (27.4%) | < 0.001 |
3.2
Oncological outcomes
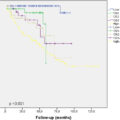
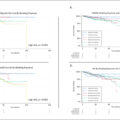
The median follow up of patients was 12.2 years (IQR: 6.4 to 18.5). BMI was significantly associated with all-cause mortality ( Table 2 ), with BMI over 30 having increased risk of death relative to BMI 18.5 to 24.9. For the obese patients, the hazard ratio of death increased for higher severities of obesity: BMI 30 to 34.9 (HR 1.30, P < 0.001), BMI 35 to 39.9 (HR 1.43, P < 0.001), and BMI > 40 (HR 2.20, P < 0.001). Given the increased risk of all-cause mortality with BMI, nonprostate cancer death was treated as a competing risk in multivariable models ( Table 2 ). BMI was not significantly associated with biochemical failure, metastasis, or cancer specific mortality. Fig. 2 demonstrates regression adjusted competing risk estimates of nonprostate cancer and prostate cancer mortality by BMI category to show that the former varies with BMI while the latter does not. Importantly, more than 84% of radical prostatectomy patients remained alive 10 years after surgery for all BMI categories.
| Biochemical failure | Metastasis | Cancer specific mortality | All-cause death | CSS competing risk | ||||||
|---|---|---|---|---|---|---|---|---|---|---|
| HR | P Value | HR | P Value | HR | P – Value | HR | P -Value | HR | P value | |
| Body mass index | 0.02 | 0.001 | 0.01 | < 0.0001 | 0.09 | |||||
| 0–18.5 vs. 18.5–25 | 1.24 (0.66, 2.30) | 0.50 | 1.05 (0.15, 7.52) | 0.96 | 1.88 (0.26, 13.43) | 0.53 | 1.60 (0.93, 2.76) | 0.09 | 1.02 (0.13, 7.73) | 0.99 |
| 25–30 vs. 18.5–25 | 1.07 (1.01, 1.13) | 0.03 | 1.00 (0.87, 1.16) | 1.00 | 0.96 (0.80, 1.15) | 0.65 | 1.05 (0.99, 1.11) | 0.14 | 0.95 (0.79, 1.14) | 0.56 |
| 30–35 vs. 18.5–25 | 1.13 (1.05, 1.21) | 0.001 | 1.20 (1.02, 1.41) | 0.03 | 1.20 (0.98, 1.47) | 0.08 | 1.30 (1.21, 1.39) | < 0.0001 | 1.14 (0.92, 1.41) | 0.23 |
| 35–40 vs. 18.5–25 | 1.10 (0.99, 1.23) | 0.08 | 1.51 (1.20, 1.91) | 0.001 | 1.47 (1.08, 2.01) | 0.01 | 1.43 (1.28, 1.61) | < 0.0001 | 1.33 (0.97, 1.83) | 0.08 |
| 40+ vs. 18.5–25 | 1.19 (0.96, 1.47) | 0.11 | 1.03 (0.64, 1.67) | 0.90 | 0.83 (0.39, 1.77) | 0.62 | 2.20 (1.73, 2.80) | < 0.0001 | 0.68 (0.32, 1.47) | 0.33 |
| Age at surgery | 1.00 (0.99, 1.00) | 0.14 | 1.00 (0.99, 1.00) | 0.32 | 1.01 (1.00, 1.02) | 0.02 | 1.10 (1.09, 1.10) | < 0.0001 | 0.99 (0.98, 1.00) | 0.07 |
| Pathological T34 vs. T2 | 1.76 (1.67, 1.85) | < 0.0001 | 3.10 (2.73, 3.51) | < 0.0001 | 2.90 (2.46, 3.41) | < 0.0001 | 1.24 (1.18, 1.31) | < 0.0001 | 2.82 (2.38, 3.36) | < 0.0001 |
| Log 2 (preoperative PSA) | 1.23 (1.20, 1.26) | < 0.0001 | 1.15 (1.10, 1.21) | < 0.0001 | 1.09 (1.03, 1.15) | 0.005 | 1.02 (1.00, 1.04) | 0.06 | 1.07 (1.00, 1.14) | 0.04 |
| Pathological Gleason score | 1.73 (1.67, 1.79) | < 0.0001 | 2.98 (2.74, 3.24) | < 0.0001 | 3.04 (2.74, 3.37) | < 0.0001 | 1.25 (1.20, 1.29) | < 0.0001 | 2.95 (2.66, 3.28) | < 0.0001 |
| LRP vs. RRP | 0.89 (0.83, 0.95) | 0.001 | 1.35 (1.13, 1.61) | 0.001 | 1.02 (0.76, 1.37) | 0.88 | 0.99 (0.88, 1.10) | 0.81 | 0.96 (0.72, 1.28) | 0.76 |
| Year of surgery (every 10 y) | 0.73 (0.71, 0.76) | < 0.0001 | 0.95 (0.87, 1.03) | 0.21 | 0.92 (0.82, 1.04) | 0.17 | 1.07 (1.03, 1.12) | 0.002 | 0.82 (0.73, 0.92) | 0.0006 |
| Positive surgical margin | 1.70 (1.62, 1.79) | < 0.0001 | 1.18 (1.05, 1.33) | 0.005 | 1.37 (1.18, 1.59) | < 0.0001 | 1.04 (0.99, 1.10) | 0.14 | 1.36 (1.17, 1.59) | < 0.0001 |
| Adjuvant radiotherapy | 0.50 (0.45, 0.57) | < 0.0001 | 0.78 (0.63, 0.96) | 0.02 | 0.68 (0.52, 0.89) | 0.005 | 1.04 (0.93, 1.15) | 0.52 | 0.67 (0.51, 0.89) | 0.006 |
| Adjuvant hormonal therapy | 0.47 (0.43, 0.50) | < 0.0001 | 0.79 (0.68, 0.91) | 0.001 | 1.04 (0.88, 1.23) | 0.66 | 1.04 (0.97, 1.12) | 0.30 | 1.05 (0.88, 1.25) | 0.57 |
Related posts:
 Is primary retroperitoneal lymph node dissection the way forward for patients with testicular seminoma and limited retroperitoneal metastases?
 Critical care therapy and in-hospital mortality after radical nephroureterectomy for nonmetastatic upper urinary tract carcinoma
 The clinical relevance of cut-off percentage for high-grade urothelial carcinoma within low-grade urothelial carcinoma: A determining factor?
 Cumulative smoking exposure impacts oncologic outcomes of upper tract urothelial carcinoma
Multicenter study of active surveillance for small renal masses: Real world practice pattern
Cumulative smoking exposure impacts oncologic outcomes of upper tract urothelial carcinoma
Multicenter study of active surveillance for small renal masses: Real world practice pattern
 Pathologic prostate cancer grade concordance among high-resolution micro-ultrasound, systematic transrectal ultrasound and MRI fusion biopsy
Stay updated, free articles. Join our Telegram channel

Full access? Get Clinical Tree


