Method
Measurement
Advantages
Disadvantages
Value in drug development decisions
Ultrasound (US)
Images based on frequency and strength (amplitude) of ultrasound signal and time it takes for that signal to return to transducer
Inexpensive, widely available
Inaccurate, imprecise, operator dependent
Low suitability for clinical trials requiring quantitative assessment of liver fat
Computer tomography (CT)
Images based on measuring x-ray attenuation
Widely available, moderate accuracy, high repeatability
Ionizing radiation, expensive, not always reproducible across different CT scanners
Limited suitability for clinical trials requiring quantitative assessment of liver fat
Magnetic resonance spectroscopy (MRS)
MR spectrum obtained from specified location in liver
Accurate, high repeatability, provides detailed spectral information for fat
Whole liver not assessed, analysis requires expertise, expensive, limited reproducibility across different MR scanners
Suitable for some single-centre cross-sectional and longitudinal studies where additional information to that available from MRI is being sought
Conventional magnetic resonance imaging (MRI)
MR T1-independent nominally out-of-phase and in-phase images obtained of liver
Whole liver imaging, widely available, good precision
Inaccurate, expensive, requires standardization
Suitable for some single and multicentre longitudinal studies requiring quantitative assessment of liver fat
Advanced magnetic resonance imaging (MRI)
MR T1-independent nominally alternately out-of-phase and in-phase images obtained of liver using three or more echoes
Whole liver imaging, accurate, precise, yields estimates of both PDFF and T2*
Not yet widely available, expensive, requires standardization
Suitable for single and multicentre cross-sectional and longitudinal studies requiring quantitative assessment of liver fat
Noninvasive Imaging Assessment of Skeletal Intramyocellular Lipid (IMCL)
Magnetic Resonance Spectroscopy (MRS)
As described above for MRS evaluation liver fat, MRS noninvasive assessment of IMCL may also have a limited role in drug development. Since MRI alone cannot assess IMCL and since MRS is the only way to assess IMCL noninvasively, if noninvasive assessment of IMCL is required, MRS is necessary. Hence, although there are limitations, MRS is feasible for single-centre trials where expertise in acquisition and analysis is available.
Conclusions
In the context of developing new drugs for nonalcoholic fatty liver disease (NAFLD) and related metabolic conditions (obesity, type-2 diabetes, cardiovascular disease, metabolic syndrome), advanced MRI currently stands out as the best method to assess liver fat. The advantages of whole-liver coverage, accuracy, precision, suitability for multi- as well as single-centre trials, and suitability for cross-sectional and longitudinal trials outweigh the disadvantages of cost and currently less-than-widespread availability. The various MRI scanner vendors are developing and can be expected in the future to support advanced MRI techniques. Future harmonization of acquisition and analysis techniques across MRI scanner vendors will result in advanced MRI becoming more widely available, and eventually results across sites, vendors, and time will be comparable. Conventional 2-point Dixon MRI is likely to remain useful in longitudinal trials.
Advanced ultrasound techniques are being developed to assess liver fat and, if validated as biomarkers of liver fat, may also become useful in clinical trials. CT is likely to be less useful than MRI but probably will continue to be of value on a limited basis when advanced MRI is not available or contraindicated. MRS is currently the only way to noninvasively assess IMCL, and so if that is required in single-centre or small multicenter trials, it may be of use. The use of MRS in large multicenter trials to assess IMCL is not feasible at this time.
Introduction
The global obesity epidemic is driving increasing rates of type 2 diabetes [1–3], nonalcoholic fatty liver disease (NAFLD) [4–6], and associated cardiometabolic disorders [6–9]. This urgent public health threat has prompted the development of noninvasive imaging techniques to monitor excessive accumulation of ectopic fat in liver and muscle. Ectopic fat is defined as the deposition of triglycerides within non-adipose tissue cells that normally contain only small amounts of fat [10]. Fat deposition in liver and/or muscle has adverse cardiometabolic consequences that arise through effects on aspects of local and systemic energy metabolism [11, 12]. In liver and muscle, triglyceride content usually correlates with whole-body and tissue-specific insulin sensitivity. Accumulation of fat in the abdominal viscera has an equal or more important role in the development of cardiometabolic risk compared with overall obesity [10].
NAFLD is a highly prevalent, and largely subclinical, disorder in which fat collects in hepatocytes in people who have limited alcohol consumption and who have no other condition causing steatosis [13]. NAFLD presents as a spectrum of disease, ranging from simple (or isolated) steatosis to nonalcoholic steatohepatitis (NASH), a more advanced form of the disease characterized by inflammation and cellular injury, and sometimes by fibrosis, as well as steatosis. NAFLD is associated with the metabolic syndrome, insulin resistance, and type 2 diabetes mellitus [9, 14]. NAFLD exacerbates insulin resistance in the liver and systemically [14]. Moreover, NAFLD generates an atherogenic lipid profile and other risk factors for cardiovascular disease [15, 16]. In a minority of affected subjects, NASH may progress ultimately to cirrhosis and hepatocellular carcinoma.
Intramyocellular lipid (IMCL) is fat that is deposited intracellularly within skeletal muscles. It also has been implicated in the pathogenesis of the metabolic syndrome [17]. Several studies have shown that increased IMCL is associated with decreased insulin sensitivity in individuals with obesity or type 2 diabetes [18, 19] and in the offspring of patients with type 2 diabetes [20, 21]. It has been hypothesized that defects in skeletal muscle mitochondrial function are associated with both decreased insulin resistance and accumulation of IMCL in skeletal muscle [22]. The thiazolidinedione class of glucose-lowering drugs, e.g., pioglitazone, may improve insulin sensitivity in subjects in part by reducing intracellular triglyceride content of skeletal muscle and liver [23].
NAFLD has emerged as a potential target for the prevention of type 2 diabetes, reflecting a potential bi-directional relationship between liver fat, insulin resistance, and the metabolic syndrome [9]. A range of non-pharmacological and pharmacological interventions has been evaluated for NAFLD and associated cardiometabolic risk factors. The latter include diet-induced weight reduction and physical exercise [24–26], bariatric surgery [25], metformin [27, 28], thiazolidinediones [23, 28, 29], omega-3 fatty acids [30], statins [31], and 11β-hydroxysteroid dehydrogenase type 1 inhibitors [32]. Noninvasive methods to quantify liver and skeletal muscle fat may be used to assess efficacy and safety endpoints in drug development (Table 4.1). In early-phase drug development, noninvasive methods can determine whether drugs have fat-lowering or fat-raising effects in liver and/or skeletal muscle. They can also determine the time course and duration of these effects. This information may be useful for go/no-go decisions. In late-phase drug development, noninvasive methods additionally may serve to measure surrogate or secondary biomarker endpoints in clinical trials for drugs intended to reduce ectopic fat accumulation.
Table 4.1
Potential roles of liver and muscle fat imaging in cardiometabolic drug development
Screening of subjects to determine eligibility |
To identify subjects with fatty liver, without fatty liver, and subjects spanning a spectrum of fat deposition severity |
Endpoint in interventional clinical trials |
Change in fat content in treatment vs. placebo groups. Imaging may be used to assess efficacy for drugs intended to lower liver fat, safety of drugs intended for other purposes that may cause fat accumulation as an unwanted effect, and interim analyses for clinical trials with vanguard design to determine whether to proceed or terminate early. Such data may inform go/no go decisions, design of larger studies, applications for Food and Drug Administration (FDA) approval, etc |
Elucidation of mechanism |
Serial analysis of fat accumulation in liver and extrahepatic fat depots may help elucidate mechanism of action of novel drugs for diabetes and related metabolic diseases |
Multiple imaging methods have been proposed to measure the amount fat in the liver [33, 34]. This chapter emphasizes magnetic resonance imaging (MRI) and magnetic resonance spectroscopy (MRS) methods as these are the most accurate and precise methods for liver fat quantification [35]. We also review ultrasound (US) and computed tomography (CT) and discuss relative strengths and weaknesses. For monitoring IMCL, however, MRS is the only noninvasive method that has gained widespread acceptance [36].
History of Magnetic Resonance Imaging of Fat in Liver and Skeletal Muscle
A variety of MRI-, MRS-, CT-, and US-based approaches have been proposed to measure fat in the liver. As the leading methods for quantifying liver fat are MRI and MRS, we will briefly review only the history of MRI and MRS here.
MRI of liver fat began in 1984 when Dixon et al. proposed an MRI-based liver fat measurement technique; [37] to this day, MRI-based techniques to measure fat throughout the body are often referred to as Dixon imaging. In the 1990s, MRI-based quantification was extended to collect three echoes [38], and dual-echo techniques using gradient-recalled-echo (GRE) sequences were developed to allow single breath-hold fat assessment [39]. More complete understanding of the MR behavior of fat allowed development and refinement of advanced MRI methods to estimate proton density fat fraction (PDFF), a standardized biomarker un-confounded by biological, physical, or technical factors [40–42].
Liver and muscle MRS initially focused on 31P and 13C, but these techniques are not aimed at quantifying fat. 1H MRS-based measurement of liver fat began in the 1990s when three landmark papers examined several confounding factors [43–45]. More recently,1H MRS was used to measure liver fat in over 2,000 subjects to investigate the prevalence of fatty liver at a population level [46]. Multi-TE 1H MRS techniques have subsequently been developed that allow hepatic PDFF estimation in a single breath-hold [47, 48].
In 1993, Schick et al. [49] were the first to realize that there were two different types of fat in muscle; these were identified by Boesch et al. [50] as intramyocellular lipid (IMCL) and extramyocellular lipid (EMCL). It was recognized that skeletal muscle MRS was orientation-dependent [51] and that IMCL was important in providing an energy source in endurance exercise [52].
Noninvasive Liver Imaging Methods
Ultrasound
Perhaps the most common imaging modality to assess liver fat is conventional US, which is widely available and can be performed quickly, cheaply, and safely [53]. However, conventional US only produces a qualitative estimate of liver fat, relies on a subjective interpretation of features in the US image, and is both operator and machine dependent [54–56]. Thus estimates of liver fat derived from conventional US are semiquantitative and have lower repeatability and reproducibility than MRI or MRS and so are of limited value in assessing hepatic fat to inform drug development decisions. US is more reliable at identifying moderate-to-severe degrees of hepatic steatosis as confirmed by histology than are measurements of serum liver transaminase levels [15]. Advanced US methods are being investigated to provide quantitative estimates of liver fat [57]. However, these techniques are still in development and have only limited availability. While these techniques should provide more accurate estimates of liver fat than conventional US, only limited data are currently available on the accuracy and precision of these techniques. Hence, these investigational techniques currently have limited applicability in drug development.
Computed Tomography
Unenhanced CT evaluates liver fat by measuring x-ray attenuation; x-rays are attenuated less in fatty liver than in non-fatty liver [53]. While CT lacks the ease and portability of ultrasound, it is more widely available and more rapid than MR scans. Unlike US, x-ray attenuation is not subjective and can be measured precisely [58–60]. However x-ray attenuation is affected by several patient factors in addition to fat, reducing the accuracy and precision of liver fat estimation [58]. There may also be variability of attenuation values between CT scanners, particularly those produced by different manufacturers [61]. Finally, CT uses ionizing radiation, which limits its use in vulnerable groups such as children and pregnant women or in studies where multiple scans are required over time [62]. For these reasons CT has only limited applicability for liver fat quantification in drug development, and the use of CT for this purpose is not justified if MRI is available or unless CT of the liver is being performed anyway for other reasons.
Introduction to Magnetic Resonance Measurement Techniques
The two noninvasive MR-based techniques used to assess liver fat are 1H (i.e., proton) MRS and MRI. Although the information that these techniques produces is different, the two approaches are similar; the same physics principles underlie and the same equipment is used for both techniques. The patient is placed in a strong magnetic field (called the “main” magnetic field), and then both water and fat molecules in the patient’s body are excited with radiofrequency (RF) pulses. In MRI, gradients (additional magnetic fields of far smaller strength than the main magnetic field) and Fourier transformation are used to “encode” signals allowing images to be produced.
For MRS, gradients are used to locate (i.e., preferentially excite only) a region of interest, and then the Fourier transform of that signal produces a spectrum (which, as described further below, depicts the MR signal intensity transmitted from hydrogen protons in different chemical environments such as those in water molecules and those in the various moieties of triglyceride molecules). To the patient undergoing an MR examination, the difference between the two approaches may not be obvious, except that MRS sequences often are quieter than MRI sequences. Even though MRS measurements technically are not MRI per se, MRS examinations always require some imaging to allow accurate placement of the volume from which fat is being measured. Hence, the phrase “MRI” is often colloquially used to describe both MRI and MRS, even if the main outcome is an MRS measurement.
Most of the strengths and weakness of MRI apply equally to MRS. The lack of ionizing radiation in MR examinations safely permits repeat scanning and hence longitudinal monitoring. It also allows scanning of vulnerable groups, such as children and, if necessary, pregnant women. Given the increasing prevalence of obesity in children, with its downstream problems related to NAFLD, NASH, and other metabolic syndrome complications, the ability to scan children safely, accurately, and precisely to measure fat over time is a significant strength of both MRI and MRS.
A common contraindication to MR scanning is claustrophobia. MR systems are designed to achieve a highly uniform main magnetic field, which is required for both MRI and MRS. The most common scanner geometry that provides this is a long-cylinder (or long “bore”) geometry. Modern MR systems generally have shorter bores than early scanners, decreasing claustrophobia-induced examination failure. Recent wider-bore MR systems have been designed which further reduce the incidence and severity of claustrophobic reactions and also increase the size of patients who can be scanned, which is of importance in conditions associated with obesity. Open systems have also been designed which further reduce claustrophobic reactions, but these systems operate at lower fields strengths and have poorer uniformity than equivalent smaller-bore systems. As yet the advanced MRI and MRS methods detailed in this chapter have not been validated in open systems. Other contraindications to MR scanning arise from the interaction of the (necessary) magnetic field or RF pulses, with metallic “foreign bodies” in the patient being scanned. Many objects implanted for clinical purposes such pacemakers, metallic cardiac valves, and some surgical clips exclude patients from undergoing an MR scan. Also metal that has entered the body accidentally may be of concern, particularly metal fragments in the orbits since the MRI magnet can exert a pull on these tiny metal fragments potentially leading to serious injuries. For this reason, screening is required beforehand, generally in the form of a questionnaire to ensure that patients can safely be scanned.
Both MRS and MRI exploit differences in the resonance frequency of hydrogen nuclei in water and fat molecules to measure fat signal quantitatively. Typical MR spectra from adipose and liver tissue are shown in Fig. 4.1, displaying the separate frequencies, or chemical shifts, of the various water and fat peaks. The resonant frequency of each hydrogen nucleus is determined by the magnetic field it “experiences.” The frequency position of a particular peak, or chemical shift, is determined by the amount of electron shielding it experiences. Both protons in water molecules experience the same amount of shielding and hence the same magnetic field, so there is only one water spectral peak. Different hydrogen nuclei in fat molecules experience slightly different levels of shielding and hence experience different magnetic fields, resulting in a fat spectrum that has several peaks [63]. Individual fat peaks will have a complex shape due to j-coupling, but a discussion of this affect is beyond the scope of this chapter [47]. While the individual main fat peaks can be partially discerned in pure fat tissue, there is insufficient spectral resolution at clinical field strengths (1.5 T and 3 T) to delineate all of the liver fat peaks in vivo [63].


Fig. 4.1
Typical in vivo adipose MR spectrum (left) and liver MR spectrum (right). Both spectra acquired at 3T with the STEAM sequence, TR = 3,500 ms and TE = 10 ms. The peak assignments are shown in Table 4.2
The resonant frequency of each MR spectral peak (fat, water, and other) could be, but rarely is, given as its actual resonant frequency (near 63 MHz for 1.5 T scanners and near 127 MHz for 3 T scanners). However, it is useful and is common practice to indicate the position of each spectral peak in parts-per-million (ppm), which is independent of the strength of the main magnetic field. By convention, spectral peak frequencies are measured with respect to a reference material (tetramethylsilane (TMS)), which is assigned a frequency of 0 ppm. In vivo, there will be no TMS present, and so the water spectral peak acts as a surrogate reference. Water has a chemical shift (i.e., spectral peak position) of 4.7 ppm at 37 °C. Different types of fat will have slightly different spectra, depending on the amount of saturated, monounsaturated, and polyunsaturated fat they contain. Several studies have shown that MRS and MRI both can be used to determine “type” of fat – i.e., the degree and type of unsaturation of fat [63–65]. However, description of the details of these more advanced methods is beyond the scope of this chapter; we will focus here only on MR measurement of fat content.
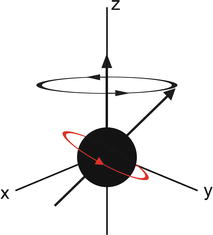
MRI and MRS both measure the amount of fat by referencing the MR signal from fat to the MR signal from water. To be of utility, the fat and water signal values are converted to a value which is independent of possible confounding effects present in both MRI and MRS, some of which arise from and can be avoided or corrected for by judicious choice of MR scanner settings. When placed in a magnet field, hydrogen nuclei align with the main magnetic field to create longitudinal magnetization (M z ). This magnetization is not detectable when a patient is just placed in the main magnetic field, so an “excitation” RF pulse at the resonant frequency of the hydrogen nuclei is applied which transfers energy to (excites) M z , rotating it into the transverse plane where it begins to precess (rotate), as shown in Fig. 4.2. The magnitude of the magnetization in the x–y plane is called M xy . When excited into the x–y plane, the precession frequency of the magnetization vector as it rotates at the resonant frequency is given by the Larmour equation:
 where ν is the Larmour (resonant, precession) frequency, γ is the gyromagnetic ratio (which is different for each type of nucleus), and B 0 is the main magnetic field that each atomic nucleus experiences (i.e., after shielding).

Fig. 4.2
Diagrammatic representation of a precessing hydrogen nucleus following a radio frequency (RF) pulse. The magnetization is no longer purely in the z direction, and the proportion of magnetization in the x–y plane is detectable by the MR system

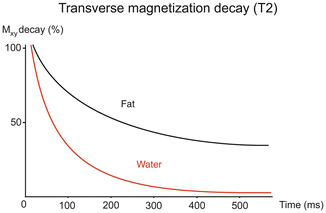
The signal radiated by the excited protons will exponentially decay with a (transverse) rate of decay (or relaxation) given by T2, as described in the equation:
 where M xy (0) is the initial transverse magnetization before it starts to decay, the echo time (TE) is the time between the RF pulse and the signal acquisition, and T2 is the time for M xy to decay to 1/e of its initial value (Fig. 4.3). In MRS, we have to correct for T2 decay, but in the MRI sequences discussed in this chapter, this decay is described by T2*, rather than T2, which accounts for additional sources of relaxation that protons typically experience during imaging. MR images require numerous excitations, often hundreds to thousands, and the amount of M z (i.e., ready to be tipped again into the x–y place to give more signal) after an excitation is given by the equation:
 where TR is the time between acquisitions and T1 is the time required for M z to recover to (e − 1)/e of its original value (Fig. 4.4).
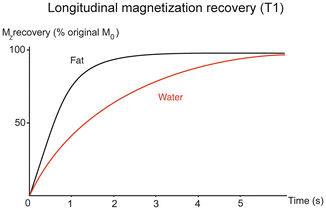


Fig. 4.3
T2 relaxation fat and water in liver. The different T2 decay rates for liver water and fat are evident in this figure, with water having a shorter T2 than fat. Hence in the liver, signal from water decays more rapidly than that from fat


Fig. 4.4
T1 relaxation of fat and water in liver. Water has longer T1 than fat and hence it takes water longer for longitinidal magnetiztion to recover
Water and fat have different values of T1, T2, and T2*. These values will vary from patient to patient and also are dependent on the field strength of the MR scanner [66]. Thus different sequences with different TR and TE values may give different estimates of the fat content. Choosing sequence parameters that minimize T1 and T2 weighting, or acquiring data such that these parameters can be corrected, can avoid or correct for these patient-related differences. This chapter will discuss several of these, as well as other confounding factors, and discuss how to produce an estimate of fat that is independent of field strength and scanner platform.
MRS Liver Fat Measurement Techniques
MRS is widely considered to be the most accurate, noninvasive method to estimate hepatic PDFF [53]. As shown in Fig. 4.1, MRS at 1.5 and 3 T can directly identify the main spectral peaks in fat and water. The amount of signal associated with a spectral peak is related to the area under the peak. Thus, if there were no confounding effects, summing the areas under all the spectral fat peaks and also measuring the area under the water peak would produce an estimate of the ratio of fat-to-water signal, which is related to how much fat is present. However, as stated above, these signals can be confounded by several factors. To produce a repeatable, reproducible estimate of amount of fat, independent of confounding factors, specialized acquisition, and analysis procedures are required. As a first step, MR images of the liver are acquired to allow a volume of the liver to be selected. Normally, images are acquired in more than one plane to assist in selecting an MRS volume of interest, also known as a “voxel.” The MRS voxel, generally a 2 × 2 × 2 cm cube, is manually placed in liver parenchyma, using the localizing MR images, to avoid liver edges, large vessels, and large bile ducts as shown in Fig. 4.5. Shimming, a series of short tuning scans, is then performed to achieve a maximally homogeneous magnetic field across the MRS voxel. After successful shimming, an MRS sequence is performed.
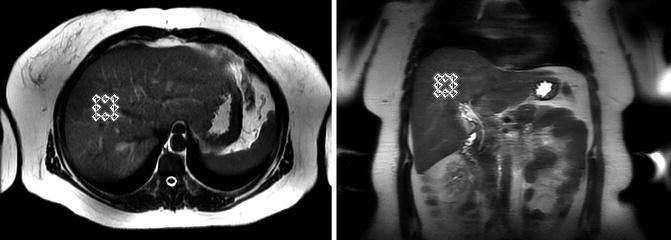

Fig. 4.5
Liver MRS voxel selection in a typical subject as shown on axial (left) and coronal (right) images. The MRS voxel position is selected to avoid major blood vessels, bile ducts and the edge of the liver
There are two main MRS sequences used to measure liver fat. These are PRESS (point resolved spectroscopy) [67] and STEAM (stimulated echo acquisition mode) [68, 69]. There are advantages to both these sequences. PRESS provides twice the signal to noise obtainable from STEAM, but STEAM is capable of a shorter echo time (TE) [70]. Both sequences have been used to measure hepatic PDFF, but as discussed later in this section, STEAM is preferable to PRESS for liver fat quantification. When measuring liver fat using MRS, no water or fat saturation should be used [35]. Also, spatial saturation bands should be disabled. Spatial saturation bands remove all signals from a selected volume band and are used in spectroscopy to remove possible contamination from outside the voxel but can also introduce an unequal response across the spectrum within the selected MRS voxel [71]. While previous studies have used free breathing and multiple averages, there is sufficient signal to noise to accurately measure liver in a single breath-hold.
As discussed previously, water and fat have different T1 and T2 values, and these vary between individuals. In MRS, to remove T1-induced variability (mainly of water), TR >3,000 ms is chosen. This TR is sufficient to minimize/avoid the natural variability in T1 between individuals, while still allowing multiple spectra to be acquired in a single breath-hold. This long TR also minimizes the effect of the water and fat having different T1 values.
There are two ways to correct for T2 variability between individuals. The simplest is to collect spectra at as short a TE as possible. This minimizes differences in the amount of decay that occurs due to intersubject variability in T2 values. STEAM has a shorter minimum TE than PRESS and so avoids T2 variability better than PRESS. Mean values of T2 for water and fat, taken from literature, are then used to correct approximately for the T2 decay that does occur. A more advanced solution is to collect single-average spectra at multiple TE values [47, 48]. With a TR of 3,500 ms, spectra at five different TE values can be comfortably collected in a single breath-hold. This allows the areas of fat and water peaks to be calculated by fitting the T2 decay equation:
 Here S is the area under the spectral peak curve, and S 0 is the T2-corrected peak area (i.e., the area under the curve that would be present at TE = 0 ms).

The range of TE values for multi-TE T2 measurement must carefully be chosen, as at longer TE values the decay of fat is no longer purely exponential due to j-coupling. This again suggests the use of the STEAM sequence, which is capable of shorter TEs [72]. A typical liver MRS multi-TE acquisition is shown in Fig. 4.6. However, acquisition of spectra at multiple TE values in a single breath-hold requires a specialized version of MRS sequence. For some scanners, the ability to run these specialized sequences may require a research agreement with the scanner manufacturer.
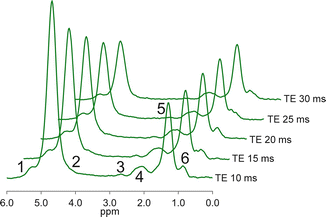

Fig. 4.6
Typical in vivo liver multi-TE MRS acquisition. Spectra acquired at 3T with the STEAM sequence, TR 3,500 ms. The peak assignments are shown in Table 4.1. The difference in the change in peak area of the water and fat peaks with increasing TE shows the differing T2s of fat and water
Virtually all liver MRS is effectively limited to single-voxel acquisition. Thus MRS cannot readily provide information about the spatial distribution of fat in the liver. Liver fat distribution can be heterogeneous, and it is possible that the MRS voxel location is not indicative of the liver as a whole. This may pose a challenge in longitudinal studies, as care must be taken to co-localize the MRS voxel in follow-up scans to a similar location as was selected in the initial study. Otherwise spatial variation in the liver may be mistaken for a change in liver fat over time. There are multi-voxel MRS sequences available that cover large volumes of the liver, providing information on the spatial distribution of fat. However, the large volume reduces the uniformity of magnetic field within the volume, producing poor quality spectra. Also multi-voxel sequences are time consuming and beyond the range of single breath-hold techniques. Thus, they are highly susceptible to artifacts introduced by patient breathing, such as contamination of fat signal from surrounding adipose tissue [35, 66].
Automated, reliable, online analysis methods of spectral analysis are not yet available, so spectral analysis must be performed offline with specialized software by experienced personnel [73]. Spectral tools available from MR scanner manufacturers generally are suitable for viewing spectra, but not optimally suited to estimate hepatic PDFF. However there are a number of advanced tools that incorporate prior knowledge of the structure of the spectrum into fitting algorithms [74, 75]. These tools require initial input from a physicist with advanced knowledge of fat-related MRS to set up so-called “prior knowledge” constraints for analysis of fat spectra. This prior knowledge is generated from a number of factors, including biochemical data and MR scanner parameters. Further, these tools are generally designed for research rather than clinical use, and even when prior knowledge has been set up, an experienced user is still needed to analyze the spectra. Finally on many MR scanners, the raw MR data required for MRS analysis is not automatically archived but instead is stored in temporary files that require a research agreement with the scanner manufacturer to access.
Stay updated, free articles. Join our Telegram channel

Full access? Get Clinical Tree


