Imaging of Head and Neck Cancer


Imaging of Head and Neck Cancer


Reza Forghani

Jason M. Johnson

Lawrence E. Ginsberg


Over the past decades, there have been major advances and improvements in cross-sectional imaging techniques. Imaging, in particular computed tomography (CT), magnetic resonance imaging (MRI), and increasingly positron emission tomography (PET mainly combined with CT as PET/CT), now plays a central role in the management of head and neck cancer by the multidisciplinary team. Imaging can be used to identify tumor and at times suggest a differential diagnosis in order to attempt to distinguish benign from malignant lesions. However, in head and neck cancer, the determination of the specific tumor type requires biopsy for histopathology and increasingly molecular analysis, regardless of the imaging appearance of a tumor. Furthermore, not uncommonly, a diagnosis may have been already made at the time of initial imaging evaluation. Therefore, one of the most fundamental roles of imaging in head and neck cancer is to accurately determine the stage of a tumor and upstage the initial clinical assessment when appropriate. Imaging is integral in the evaluation of deep extent of tumor and lymph node levels that cannot be reliably evaluated clinically as well as in the identification of distant metastases. Following treatment, imaging is essential for surveillance and for identification of tumor recurrence, as well as for differentiating recurrence from treatment-related complications. The optimal imaging evaluation should focus on identification of tumor spread to critical structures that would alter tumor stage, determine resectability, and help with surgical and radiation therapy planning and approach.

This chapter provides an overview of current imaging modalities and emerging techniques for head and neck cancer imaging. It is neither the intention nor possible to cover such a broad topic in exhaustive detail in a single chapter. Rather, our aim is to introduce the most commonly used techniques (CT, MRI, and PET/CT) and approach for noninvasive assessment of the common mucosal cancers of the head and neck. Imaging evaluation of sinonasal, oral cavity, oropharynx, hypopharynx, and laryngeal cancer will be discussed. A discussion of other cancer types and primary sites, including thyroid malignancies, salivary gland neoplasms, and skull base, is beyond the scope of this chapter. Ultrasound (US) and image-guided biopsies will be only briefly discussed. The chapter will begin with a discussion of the imaging techniques. This is followed by an overview of general assessment of tumors including tumor staging, spread, lymphadenopathy, and evaluation of perineural spread (PNS) of tumor. Post-treatment imaging will then be addressed. The chapter will conclude with primary site-specific considerations and a section on emerging imaging techniques.


IMAGING TECHNIQUES AND APPROACH TO HEAD AND NECK CANCER


Overview

Cross-sectional imaging techniques such as CT and MRI are the mainstay anatomic imaging modalities used for initial evaluation and follow-up of head and neck cancer. Since its invention in the 1970s, there have been remarkable advances in speed of acquisition and quality of images generated by CT scanners. MRI is another robust imaging technique that provides superb soft tissue contrast and likewise has undergone significant technical improvements enabling high-quality imaging of head and neck cancer and intracranial tumor extension. While both techniques have their strengths, currently, CT is typically the first-line imaging modality for initial evaluation of most head and neck pathologies. One exception is imaging of nasopharyngeal carcinoma (NPC), in which MRI has been shown to be superior in tumor staging,1,2,3,4,5,6 although there can still be significant practice variations among different institutions. This will be discussed in greater detail later in the section on the nasopharynx. MRI also has certain advantages in the evaluation of sinonasal and oral cavity tumors that will be discussed in the specific sections on these primary sites. MRI is frequently used as an adjunctive imaging modality for additional assessment of equivocal findings on CT, and has specific advantages for the evaluation of PNS and intracranial extension of tumor and is complementary to CT for evaluation of bone invasion.

Another important milestone in head and neck cancer imaging has been the introduction of molecular imaging techniques. PET, combined with anatomic/morphologic imaging techniques like CT (and more recently MRI), has emerged as an important adjunctive tool for initial evaluation and followup of head and neck cancers. US plays a central role in evaluation of thyroid disease, including thyroid malignancies, and is an important adjunct imaging tool in the assessment of nodal disease, particularly with its ability to facilitate image-guided biopsies. However, beyond select applications, US is not routinely used for evaluation and follow-up of the majority of mucosal head and neck malignancies in most North American institutions. Plain films and fluoroscopy have little role in routine evaluation and follow-up of head and neck cancer. The use of videofluoroscopic techniques for evaluation of swallowing and dysphagia in patients with head and neck cancer is beyond the scope of this chapter. The chapter will begin with an overview of CT, MRI, and PET before proceeding to a more specific discussion of tumor assessment.


Computed Tomography


Overview of CT Image Acquisition

CT is the first-line imaging modality for evaluation of most head and neck cancers in adults, known or suspected. Although it is not necessary to understand the complex physics and informatics behind acquisition of a CT scan, familiarity with broad principles behind image acquisition and display will enable a more effective use of the technology and recognition of its limitations. CT images are generated when x-rays transmitted through the patient’s body are processed by detectors and reconstructed into a tomographic image, or slice, using sophisticated computer algorithms. The current conventional state-of-the-art CT scanners have a rotating gantry with a tube and detector opposing each other and enable acquisition of multiple slices simultaneously.7 Current state-of-the-art scanners typically are 64-slice or higher, and the typical 64-slice scanner can generate slices with a thickness of as little as 0.5 to 0.625 mm. For the standard neck CT, images should be typically reconstructed at a section thickness between 1 and 3 mm. The spatial resolution of the images in the axial (X to Y) plane, that is, the ability to resolve fine detail or the smallest distance at which two separate objects can be distinguished on an image, ranges between 0.33 and 0.47 mm. Because of their high resolution, the axial acquisitions on modern CT scanners can be used to generate “reformatted” images in the coronal and sagittal planes. This can be very useful for evaluation of head and neck cancer. In addition to the improvements in image quality, technical advances in CT have also resulted in significantly reduced patient exposure to ionizing radiation on modern CT scanners compared to their earlier counterparts.


Figure 5.1. Axial contrast-enhanced CT image from a patient with a thyroglossal duct cyst (TGDC) demonstrates the basic tissue densities on CT. As discussed in greater detail in the text, there is progressively increasing density of air (dark black), subcutaneous fat, fluid or water (within the TGDC), muscle (soft tissue), and bone. Various intermediate densities are seen, such as the brightly opacified carotid arteries (CA), secondary to a higher concentration of intravenous iodinated contrast, with density much higher than muscle but less than bone.


Table 5.1 Basic Tissue and Tumor Characteristics on Contrast-Enhanced CT


Tissue or Lesion


Relative Density and Approximate Hounsfield Unit (HU) Measurement


Comments


Air


Dark black; -1,000 HU range


Fat


Darker than fluid; -180 to -30 HU


Macroscopic fat has a distinctive appearance and is readily recognized on CT. Fat is an important source of “intrinsic contrast,” readily distinguishable from normal soft tissues such as muscle and most (nonlipomatous) tumors.


Water and other simple fluids


-30 to +20 HU


Simple cystic lesions, such as thyroglossal ducts cysts, have this density. However, areas of cystic change and necrosis within a tumor or lymph node can also approach the density of water on CT.


Normal soft tissues (e.g., muscle), tumor, complex fluid or cystic lesions (i.e., proteinaceous or hemorrhagic)


Typically +20 HU to +70/+100 HU; may be as dense as +300 HU or higher


Most tumors and soft tissues have densities less than +100 HU on contrast-enhanced CT. However, very vascular tumors (e.g., paraganglioma) with large iodine content can have higher density. Vessels with high iodine content can approach or even exceed +300 HU depending on the phase of the study, for example, in angiographic studies.


Bone, metal implants


Range close to +3,000 HU or higher for metal implants


Bone is very dense on CT, and this further varies based on the type of bone (i.e., cortical bone is denser than cancellous bone). Metallic devices can be even denser than bone, exceeding +3,000 HU, and appear very bright on CT.


On CT, tissue density can be quantified, measured by its Hounsfield unit (HU) density value. By convention, the attenuation of x-rays by water is used as standard reference and arbitrarily set at 0 (zero) HU. Greater HU value indicates greater density or brightness on CT.


Tissue Characterization and Image Display in CT

On CT, different tissues are characterized and distinguished based on their ability to attenuate x-ray beams passing through. The density of a structure can be quantified, and the standard measure used for quantification is the Hounsfield unit (HU), named after the British engineer who built the first CT scanner in the 1970s. By convention, the attenuation of x-rays by water is used as a standard reference and arbitrarily set at 0 (zero) HU. All other attenuations are reported in reference to that of water. The basic densities typically used as reference points on CT are air, fat, water, soft tissue, and bone, each having a higher attenuation (i.e., density or brightness) than the preceding, respectively (Fig. 5.1; Table 5.1), spanning a range of densities
typically between -1,000 and +3,000 HU. Increased iodine content of a tissue also results in increased density of that tissue, which forms the basis of contrast-enhanced CT images.

Air essentially does not attenuate x-ray transmission and would have densities in the -1,000 HU range, appearing black on a CT image displayed with soft tissue settings, or “window” (discussed further below) (Fig. 5.1). Fat typically has densities between -180 and -30 HU and visually appears black on soft tissue “windows.” Water and other simple fluids have densities ranging between -30 and +20 HU. More complex (i.e., proteinaceous or hemorrhagic) fluid and soft tissue (in the absence of IV contrast) have densities higher than +20 HU and may approach densities up to +70 to +100 HU. However, after administration of IV iodinated contrast, these could have densities as high as +300 HU, particularly in a structure with a high concentration of contrast such as a vessel (Fig. 5.1), if properly timed. Bone is very dense on CT, and the density further varies based on the type of bone (i.e., cancellous vs. cortical bone) and can have attenuations of up to +3,000 HU.

To recapitulate, the ability to distinguish both normal and pathologic structures on CT is based on their density/attenuation. Therefore, spaces or tissues with largely different densities, such as soft tissue tumor invading a normally fat containing area or tumor extension into air containing sinus, are easy to distinguish on CT. However, this “inherent” tissue contrast by itself is insufficient for optimal imaging of head and neck cancer. The reason is that proper staging of tumor extent and lymphadenopathy frequently requires distinction from adjacent soft tissues, such as muscle, which can have very similar density to tumor on an unenhanced CT scan (Fig. 5.2). Therefore, in order to improve soft tissue contrast and help distinguish tumor from normal soft tissues or vital structures such as vessels, neck CTs are almost always performed after administration of iodinated IV contrast unless contraindicated. Administration of iodinated contrast agents results in increased tissue contrast and improves detection and delineation of tumors based on differences in their composition and vascularity, resulting in different enhancement patterns compared to normal soft tissue structures (Figs. 5.2 and 5.3). Sometimes, there can be early or increased enhancement of the tumor margins, presumably because of the higher vascularity of the tumor periphery8 (Fig. 5.3). There is no need for routinely obtaining a precontrast study before the contrast-enhanced scan. However, a second set of contrast-enhanced images in a plane with a slightly different angle should be obtained through the oral cavity to improve visualization of areas obscured by dental artifact on the standard acquisition. Absolute and relative contraindications to the use of IV iodinated contrast agents are most frequently due to a history of allergic reactions or impaired renal function, a more detailed discussion of which is beyond the scope of this chapter.


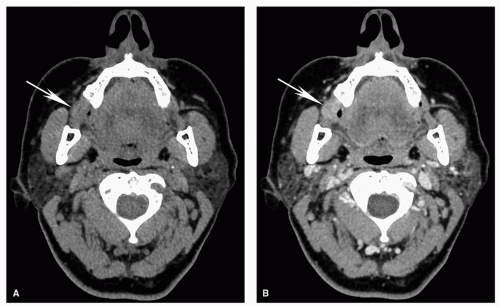
Figure 5.2. Contrast-enhanced neck CT for tumor evaluation. Axial CT images obtained (A) before and (B) after administration of IV contrast from a 59-year-old woman with a right buccal squamous cell carcinoma (arrow) are shown. A: Without IV contrast, there is asymmetry at the site of tumor, but the density is nearly identical (isodense) to muscle, and it is very difficult to clearly visualize the tumor margins. B: After administration of IV contrast, there is differential enhancement of tumor compared to adjacent soft tissues with better delineation of tumor margins.

Clinicians should be aware that for optimal viewing of specific structures, different display parameters, referred to as “windows,” are used. Windows routinely used during evaluation of a neck CT include soft tissues, bones, and lung windows (because the lung apices are scanned as part of standard neck acquisition). Failure to use the proper window may result in overlooking an abnormality. For example, failure to use bone windows may result in overlooking bone invasion (Fig. 5.4) or a bone metastasis.
Commonly used display windows are also usually preprogrammed using different function keys for easy and rapid access.


Figure 5.3. Contrast-enhanced neck CT for tumor evaluation and delineation. Axial contrast-enhanced CT image from a 56-year-old woman with a large invasive oral tongue cancer is shown. Because of differences in tumor vascularity compared to normal tissues, contrast-enhanced images are used to distinguish tumor from otherwise similar density soft tissues such as muscle. Note the clear demarcation of the enhancing edge of tumor (white arrows). The small low-density areas within the tumor represent areas of cystic change and necrosis (small black arrows). T, tongue muscles; SLS, sublingual space.


Figure 5.4. Optimal window display for evaluation of bones on CT. Axial contrast-enhanced CT images are shown from a 67-year-old woman with squamous cell carcinoma of the right gingivobuccal sulcus with extension to the retromolar trigone. The same slice is shown using two different reconstruction algorithms and display windows. A: Image displayed using narrow soft tissue windows is used for demonstration and evaluation of the mass (white arrows) and adjacent soft tissues. Notice how the cortex of the mandible is very bright when displayed in soft tissue windows with poor visualization of bone architecture (black arrow). This image is not diagnostic of cortical invasion. B: The same slice reconstructed and displayed in bone “algorithm” demonstrates a small defect (arrow) corresponding to a pathologically proven focal cortical invasion of the mandible, resulting in a T4 stage designation. Note that although the bone windows demonstrate cortical invasion to better advantage, the soft tissue mass itself is poorly seen using these display parameters.


Magnetic Resonance Imaging


Basics of MRI

Whereas CT relies on differences in attenuation of x-ray beams by different tissues and tumor for distinction, MRI relies on entirely different properties of tissues. MRI is a powerful imaging technique based on the application of a uniform external magnetic field coupled with use of radiofrequency (RF) excitation pulses. Placement into an external magnetic field results in alignment of some of the protons within the tissues of the body. An RF pulse is then applied to perturb and result in a change in alignment of some of those protons, which subsequently return to their original alignment upon discontinuation of the RF pulse. This process produces signals that are ultimately reconstructed into images. Using different parameters, multiple “sequences” are acquired, each demonstrating different tissue characteristics and typically in different planes. These are then interpreted for characterization of normal tissues and pathology.

In general, MRI has superb soft tissue contrast that is superior to CT. Therefore, although CT provides an excellent evaluation of most head and neck cancers, in certain cases MRI may be able to identify tumor not seen on CT (Fig. 5.5). However, one disadvantage of MRI for head and neck cancer imaging is the relatively long scan times of at least 20 to 30 minutes or longer. Patients with head and neck cancer may have difficulty undergoing an MRI because of their inability to handle secretions and remain motionless during the scan, decreasing the
diagnostic quality of the examination. This results in increased propensity to motion artifact, particularly below the hard palate, where there can also be image degradation secondary to swallowing artifact. A more detailed comparison of the two techniques will be provided later.


Figure 5.5. Superior soft tissue contrast of MRI compared to CT. Axial CT (A) and MRI (B, C) images are shown from a patient with an adenoid cystic carcinoma involving the right hard palate. On the contrast-enhanced CT image, the approximate area of the lesion is marked by the arrows. The lesion is not clearly visible on CT, and only mild asymmetry and minimal heterogeneous density are seen in the region of the tumor. STIR (B) and contrast-enhanced T1w fatsuppressed MR images (C), on the other hand, demonstrate abnormal high signal and heterogeneous enhancement in the right hard palate (arrows, B and C, respectively). Although CT typically enables excellent tumor delineation, occasionally, such as in this case, the lesion is much better seen on MRI because of MRI’s superior soft tissue contrast.

There are trade-offs between key parameters affecting the quality of a scan and length of acquisition, which can both positively and negatively affect image quality. This is particularly relevant for MRI given the long scan times. Spatial resolution (e.g., when high-resolution imaging is required to look at a small structure of interest such as skull base neural foramina) comes partly at the expense of signal-to-noise ratio and ability to evaluate soft tissue contrast (i.e., ability to distinguish tumor from adjacent normal soft tissues), unless the duration of acquisition of a sequence is increased. However, while increasing the length of a scan improves signal to noise, it also predisposes
to motion artifact, which can degrade image quality. Therefore, the MRI protocols are designed carefully and optimized to achieve the best result taking into account these variables. When detailed evaluation of a small area of interest, such as skull base foramina, is required, this is best performed as a targeted exam focusing on the area of interest, rather than an evaluation of the entire neck, if possible. An optimal examination is designed to achieve reasonable scan times that can be tolerated by the patient and also enable acquisition of high-quality images without significant motion degradation and image distortion.


Basic Sequences Used for MRI and Evaluation of Tissue Signal Characteristics

As discussed earlier, an MRI examination consists of different “sequences,” typically obtained in different planes. Unlike CT, MRI of head and neck cancer is obtained without and with administration of IV contrast. For MRI, paramagnetic gadolinium (Gd)-based contrast agents are used, different from iodinated contrast agents used in CT. The basic sequences that can be used for head and neck imaging are T1-weighted images (T1w), T2-weighted images (T2w), and short tau inversion recovery (STIR) images. T1w and T2w images can be obtained with fat suppression (T1FS and T2FS) to suppress the bright signal of fat and highlight pathologies such as tumor (see below for more explanations). T1w/T1FS or similar type sequences are used for evaluation of enhancement characteristics of a tumor, because Gd-based MRI contrast agents result in signal change and appear bright (white in color, or “hyperintense”) on these sequences. It should be noted that the names and certain technical parameters for the sequences can vary depending on the specific scanner and vendor.

On MRI, lesions are characterized based on their signal or brightness. Lesions with higher signal are described as “hyperintense,” those with signal similar to a reference structure are described as “isointense,” and those with lower signal than the reference are described as “hypointense.” The signal is typically compared to a standard or specific structure of interest. The reference used varies depending on body site (or the reader may specifically select a reference for comparison when appropriate), but in head and neck, the standard reference is frequently muscle. The typical sequences used for MRI evaluation of the neck and tissue and tumor characteristics on these sequences are summarized in Table 5.2 and are also further discussed below. Other sequences, such as head and neck applications of diffusion-weighted imaging, will be discussed in the section on emerging techniques.

T1w Images and Contrast-Enhanced Imaging. T1w images can be performed without or with fat suppression and are also the sequences used for evaluation of contrast enhancement as described earlier. Standard, non-fat-suppressed T1w images have relatively short scanning times and are good for evaluating normal anatomy and tissue architecture (Fig. 5.6). On this sequence, fat is very bright, muscle has intermediate signal, and simple fluid has low signal. Cortical bone has a very dark signal. The signal of the medullary portion of bones varies depending on the extent of their fat and hematopoietic elements. Fatty marrow appears bright, whereas significant cellular infiltration of marrow, including marrow invasion by tumor, has intermediate signal.

Contrast-enhanced images are key for tumor evaluation and should be obtained in all head and neck MRIs unless contraindicated. Paramagnetic contrast agents have bright signal on T1w images, and therefore, T1w images are the main sequence used for evaluation of contrast enhancement. In order to better depict tissue enhancement, contrast-enhanced T1w images are obtained as fat-suppressed sequences (T1FS). On these sequences, the bright signal of fat is suppressed and the fat appears dark, accentuating the enhancement characteristics of normal tissues and tumors (Fig. 5.6). All head and neck MRIs should include contrast-enhanced T1FS images. However, it is noteworthy that fat-saturated images are more prone to artifacts, particularly at air-bone interfaces such as the skull base or at sites of metal implants, dental fillings, or dental implants (Table 5.2; Fig. 5.7). Therefore, at some institutions and for select applications, one or more sets of postcontrast T1w images without fat suppression may also be obtained, in addition to fat-suppressed images (Fig. 5.7). On non-fat-suppressed contrast-enhanced T1w images, tumor has a grayish hue, which is typically distinguishable from the brighter signal of fat although the enhancement is not as conspicuous as on T1FS images.

T2w and STIR Images. T2w and/or STIR images are important sequences and are routinely obtained during head and neck imaging. On T2w images, fat is bright, although typically not as bright as T1 images, and muscle has intermediate to low signal (Table 5.2). Unlike T1 images, fluid is very bright on T2w images. On T2w images, tumor typically has intermediate signal, but this can vary from hypointense to hyperintense relative to muscle depending on the specific tumor type and tumor cellularity. This sequence typically provides good contrast between tumor and muscle. Tumor-associated edema also has high signal, typically higher than the signal of cellular tumor itself, which needs to be taken into account when evaluating invasion of anatomic structures such as marrow, when distinction between reactive edema and tumor invasion is important. Tumors with high cellularity tend to have relatively lower signal on T2w images compared to less cellular and more loosely packed tumors. As would be expected, the necrotic part of a tumor would have higher signal approaching that of fluid, and T2w images are a good sequence for identification of nodal inhomogeneity or necrosis, confirmed by demonstration of lack of internal enhancement on postcontrast T1w images (necrotic tumor components do not enhance). T2w images can also be obtained with fat suppression, to subdue the bright signal of fat and accentuate relatively hyperintense tumor and edema (Fig. 5.8). Fat-suppressed T2w images and STIR images (discussed next) are especially important for the evaluation of skull base and nasopharynx and are also very useful for demonstrating edema associated with denervation changes (Fig. 5.8).

Although technically different, the signal characteristics of tissues on STIR images (Fig. 5.9) are in many ways similar to, and follow what is seen on, fat-suppressed T2w images. Although the signal to noise of a typical STIR image is lower than that of T2w images, this is made up for by the increased soft tissue contrast. STIR has very good soft tissue contrast, has more uniform suppression of fat signal, and is excellent for demonstrating high signal from soft tissue tumors or edema9,10 (Fig. 5.9; Table 5.2). Similar to fat-saturated T2w images, fat is dark on STIR images. Simple fluid and edema are even brighter on STIR than T2w images, and these sequences are excellent for demonstrating edema or necrosis within the tumor or pathologic lymph nodes. Tumor also tends to be brighter on STIR compared to T2w images. It is noteworthy that normal mucosal surfaces may have high signal intensity on STIR images, and this should not be mistaken for pathology.11 All head and neck MRIs should include at least one set of fat-suppressed T2w or STIR images. Please refer to Table 5.2 for a more detailed description of tissue signal on different MRI sequences.


Table 5.2 Basic MRI Sequences and Tissue Characteristics


Sequence


Basic Tissue Signal


Comments


T1w, without fat suppression


High signal: fat (including fat in the bone marrow), paramagnetic contrast, subacute hematoma (methemoglobin), mineralization


Good for depicting tissue architecture and anatomy. Enhancing tumor not as conspicuous as T1w images with fat suppression


Intermediate signal: muscle, tumor


Fat can act as intrinsic contrast agent and help identify invasion of fatty structures by tumor by demonstrating replacement of high signal fat by intermediate signal of tumor


Low signal: fluid, edema (low to intermediate)


Necrotic part of tumor or lymph node would have lower signal approaching that of fluid


Very low signal/dark black: cortical bone, calcium


Hemorrhage or proteinaceous fluid can be bright—compare with precontrast images in order not to misinterpret as tissue enhancement


T1w, with fat suppression (standard sequence used to evaluate enhancement characteristics of tissues and tumor)


Fat has low, dark signal. Although not identical, other tissue signal patterns generally follow the trends described for T1w image without fat suppression.


Used to evaluate tumor enhancement, appearing as increased signal Better demonstrates tumor enhancement and allows clearer distinction from bright signal of normal structures such as fat


Always compare to precontrast images to make sure bright signal is true enhancement (and not increased signal from proteinacious secretions and content or hemorrhage)


Longer acquisition time than non-fat-suppressed T1 images may increase propensity to motion artifact


Increased propensity to susceptibility artifact (at interfaces between air-containing paranasal sinuses and bones at the skull base or dental filling and implant artifact)


Inhomogeneity of fat suppression can occur and should not be misinterpreted as bright signal from abnormal enhancement


Enables diagnosis and confirmation of lesions with macroscopic fat content (e.g., a dermoid or lipoma or fat within a liposarcoma)


T2w images (fast spin-echo technique)


High signal: fluid, edema, fat (but less bright than fluid and not as bright as fat on T1w images)


Fat-suppressed T2w images accentuate high signal of tumor and edema by suppressing the bright signal of fat


Intermediate signal: muscle (intermediate to low signal)


There may be areas of inhomogeneous or incomplete fat suppression (particularly superficially or in areas prone to susceptibility): should not be misinterpreted as abnormal


Very low signal/dark black: cortical bone, calcium


Tumor usually has intermediate to high signal, and this sequence typically provides good contrast between tumor and muscle


Higher cellularity tightly packed tumors may have relatively lower signal than lower cellularity loosely packed tumors


Reactive tumor-associated edema typically appears brighter than the tumor itself


Distinction from other structures such as salivary gland tissue may not be as clear based on signal alone and requires evaluation of subtle detailed anatomic features and/or correlation with other sequences


STIR


Although not identical, tissue signal patterns generally follow the trends described for fatsuppressed T2w images.


Typically has lower signal-to-noise than fast spin-echo T2w images, but practically, that is compensated for by greater soft tissue contrast and more uniform suppression of bright fat signal


Fluid is even brighter than on T2w images.


Very good sequence for demonstrating tumor-associated edema or edema secondary to denervation change; see above comments and caveats for T2w images


Comparative Overview of Strengths and Weaknesses of CT Technique for Head and Neck Cancer Imaging

Some of the advantages of CT and MRI were discussed in the preceding sections, and the techniques are also compared in greater detail in Table 5.3. Briefly, advantages of CT accounting for its popularity include rapid image acquisition, widespread availability, and relatively lower cost compared to MRI. On the typical modern CT scanner with 64 or more slices, a neck CT is obtained in <10 seconds. As a result, CT is generally better tolerated by patients compared to MRI where the typical scan times will be 20 to 30 minutes or even more in specialized applications. Imaging of the head and neck, particularly below the level of the hard palate, is prone to motion artifact that may result from swallowing or other motion if the patient cannot remain still. The problem is further exacerbated in patients having difficulty breathing or difficulty clearing secretions. Therefore, from a diagnostic image quality perspective, the short scan times of CT represent a considerable advantage over


MRI for cancers below the level of the hard palate. CT is also a safer environment for the evaluation of acutely ill patients or patients with respiratory difficulties who would have difficulty lying still in the supine position for a prolonged period of time.


Figure 5.6. T1w and contrast-enhanced imaging for evaluation of cancer of the head and neck. Images are shown from a 59-yearold man with oral tongue squamous cell carcinoma. A: Axial T1w image without fat suppression. As discussed in the text, there is good depiction of normal anatomy. Muscle has intermediate signal (e.g., MS, masseter), and fat is very bright (or hyperintense), for example, the subcutaneous fat (black asterisk). Cortical bone is dark, whereas the fatty marrow is bright (A, e.g., white circle around the right mandibular ramus). The tumor (T) has intermediate signal on the unenhanced T1w image and is not very conspicuous. Because this patient has a relatively fatty tongue, the tumor margins are still visible. B: Postcontrast axial T1w image without fat suppression. Because of the intrinsically bright signal associated with the fat in the tongue, this sequence does not show the enhancing tumor (T) well. Postcontrast axial (C) and coronal T1w image (D), both with fat suppression. Note how the enhancing tumor (T) is much more conspicuous on the fat-suppressed images compared to the non-fat-suppressed image (B).


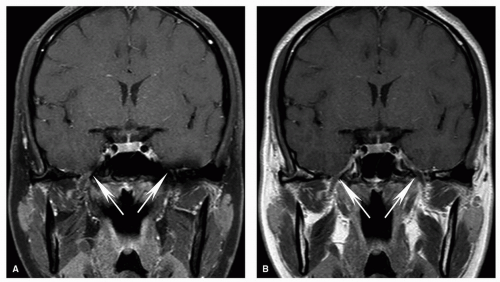
Figure 5.7. Effects of fat suppression on artifacts at the skull base. Coronal postcontrast T1w images with fat suppression (A) and without fat suppression (B) are shown. On the fat-suppressed image (A), the foramen ovale (arrows) is partly obscured bilaterally, especially on the left side. On the other hand, the foramen ovale is well seen bilaterally on the T1w image obtained without fat suppression (B, arrows), and a normal intermediate signal V3 branch is well seen on both sides. Therefore, although fat-suppressed T1w images are the primary sequence for evaluation of lesion enhancement, in select cases, addition of a non-fat-suppressed T1w sequence can improve diagnostic evaluation.


Figure 5.8. Denervation changes on MRI and utility of fat-suppressed T2w images. Axial fat-suppressed T2w (A) and contrast enhanced T1w (B) images are shown from a 43-year-old woman with recurrent nasopharyngeal cancer to the left Meckel cave (not shown). There are typical denervation changes in the distribution of the mandibular division of the left trigeminal nerve (V3) with hyperintense T2 signal (A) and abnormal enhancement (B) in the lateral pterygoid (LP), temporalis (TP), and masseter (MS) muscles. Note the preservation of muscle architecture with striations that is typical of denervation change and should not be mistaken for tumor. Fat-suppressed T2w images (or STIR images—not shown) are excellent for demonstrating edema.

MRI is frequently used as an adjunctive tool for better delineation of lesions not clearly seen on CT and for specialized applications such as evaluation of PNS of tumor or intracranial extension. There is also typically less dental artifact on MRI compared to CT, although this is not always predictable. CT and MRI are generally considered complementary for the evaluation of bone invasion. CT is superior for detection of cortical erosion (Fig. 5.4), whereas MRI is superior for determination of marrow invasion, such as infiltration by nasopharyngeal cancer. Additional site-specific advantages of each modality are discussed later in this chapter. There is greater risk of adverse reactions such as anaphylactic reactions with iodinated contrast agents used for CT compared to MRI contrast agents. There is also a risk of impaired renal function with CT contrast agents, mainly in patients with preexisting renal failure. However, although MRI contrast agents do not induce renal failure, there is a rare but potentially fatal complication of nephrogenic systemic fibrosis associated with gadolinium-based MRI contrast agents in patients with severely impaired renal function,12 and an estimated glomerular filtration rate (eGFR) of <30 mL/min/1.73 m2 is generally considered an absolute contraindication to administration of gadolinium. MRI is also contraindicated in patients with certain metallic implants, accidental foreign bodies, and most patients with pacemakers, although newer pacemakers with conditional MRI compatibility are increasingly becoming available and may no longer represent an absolute contraindication in the future. A more detailed discussion of potential adverse reactions and safety is beyond the scope of this chapter. A summary comparison of strengths and relative disadvantages of CT and MRI is provided in Table 5.3.


Figure 5.9. Tumor appearance on STIR images. STIR image is shown from the same case displayed in Figure 5.6. Note the bright signal of the tongue cancer (T) compared to adjacent tissues. Fluid, such as that of cerebrospinal fluid (CSF), is very bright on STIR.


Table 5.3 Comparison of Relative Strengths of CT and MRI for Head and Neck Cancer Imaging


CT


MRI


Diagnostic and image quality, artifact


▪ Less prone to motion degradation and swallowing artifact, particularly below the level of the hard palate


▪ Complementary to MRI for evaluation of bone, better visualization of bone architecture, and early cortical invasion


▪ Single plane acquisition disadvantage for certain areas such as palate but at least in part offset by the ability to generate high-quality reformats in sagittal and coronal planes on modern scanners


▪ Higher soft tissue contrast


▪ Typically less prone to dental implant and metallic hardware-related artifact


▪ Prone to artifact at interfaces between soft tissues or bone and air


▪ Complementary to CT for evaluation of bones, better visualization of marrow edema, and marrow invasion


▪ Multiplanar acquisition


Patient tolerance, safety, and exposure to ionizing radiation


▪ Rapid acquisition (actual scan time within seconds) is better tolerated by patients, particularly patients who are ill and patients with respiratory problems or difficulty clearing secretions who may have a hard time remaining motionless for a prolonged period of time


▪ Higher likelihood of occurrence and severity of anaphylactoid and anaphylactic reactions compared to MRI contrast agents


▪ Exposure to ionizing radiation


▪ No exposure to ionizing radiation although practically this is not a significant or determining factor in the typical adult head and neck cancer population


▪ Risk of rare but potentially fatal adverse reaction of nephrogenic systemic fibrosis in patients with significantly impaired renal function


Accessibility and cost


▪ Generally more accessible


▪ Costs less than MRI


▪ Less accessible, especially outside large centers


▪ Typically costs more than CT


Molecular Functional Imaging: Positron Emission Tomography in Head and Neck Cancer


Overview of PET Principles and Acquisition

PET has emerged as an essential adjunctive modality for evaluation of head and neck cancer.13,14 PET is a functional technique that evaluates cellular metabolism. This is achieved by “tagging” metabolites of interest with specific radiopharmaceuticals,
which in turn can be detected and localized with a PET scanner. When integrated with an anatomic technique like CT, this provides a robust functional evaluation while enabling accurate anatomic localization, which is very important given the complex anatomy in the head and neck. Therefore, current standard practice is to perform a combined PET/CT for evaluation of head and neck cancer.13,14 Most PET/CTs for head and neck cancer are performed using the radiopharmaceutical 2-18F-fluoro-2-deoxy-D-glucose (FDG), a glucose analog that is taken up by cells but is not metabolized.13,14 The rationale for FDG-PET cancer imaging is that in general, cancer cells have greater uptake on PET than do normal tissues (known as Warburg effect) (Fig. 5.10). However, one must take into account that increased FDG uptake is not specific to cancer cells and may be seen in context of inflammation/infection including biopsy sites, some benign neoplasms, or increased muscular activity under certain circumstances. This needs to be taken into account when interpreting PET scans; to be discussed later.

Currently, the CT portion of a PET/CT can be performed using two techniques. In one approach, a low-dose CT is obtained without IV contrast. This provides adequate anatomic localization, but the CT portion is otherwise not considered a diagnostic study. When this is done, the standard practice would be to interpret the PET/CT scan in conjunction with a dedicated contrast-enhanced CT obtained in a separate session. It is important to interpret these scans in conjunction with a dedicated contrast-enhanced neck CT because the contrast-enhanced CT provides superior anatomic information for tumor delineation and invasion of critical structures, including vessels.13,15 This is the approach used at our institutions, although in practice, the two exams may end up temporally separated. The contrast-enhanced study is also important for identification of necrotic lymph nodes, which may not demonstrate significant uptake on the PET scan (Fig. 5.10). The other approach is to perform combined PET/CT scanning with a diagnostic quality contrastenhanced CT. The advantage of this approach is that both tests are obtained in a single session. However, the use of CT contrast media in PET/CT has the potential to introduce artifacts and may result in an overestimation of PET attenuation factors. The clinical significance of this is unclear at this time with some authors suggesting that the effect is not clinically significant whereas others suggesting that interpretation can be adversely affected.15,16,17,18 There are in addition other limitations to this approach such as an excessively large CT field of view, and inability to angle the gantry so as to avoid artifact from dental fillings.


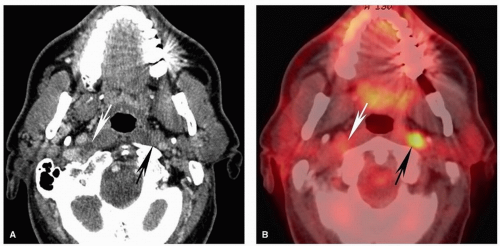
Figure 5.10. Advantages and pitfalls of PET for detection of metastatic lymph nodes. Axial contrast-enhanced CT scan (A) and fused PET image (B) are shown from a 60-year-old man with squamous cell carcinoma of the left lateral pharyngeal wall (not shown). There is abnormal, markedly increased uptake in the left lateral retropharyngeal lymph node (black arrow) that on the CT is barely visible and cannot be convincingly characterized as abnormal but which is quite evident on the PET study. This illustrates the increased sensitivity of PET compared to CT. On the other hand, there is a subtle but clearly necrotic, pathologic right lateral retropharyngeal lymph node seen on CT without significant uptake on PET (white arrow). Necrotic nodes are a known potential pitfall of PET because there may be insufficient metabolically active tissue to permit visual detection. This case highlights the importance of combined interpretation of a diagnostic CT and PET scan.


PET/CT Interpretation

The FDG uptake by a tumor is typically displayed with a color overlay map to demonstrate metabolic activity (Figs. 5.10, 5.11, 5.12, 5.13). The overlay map can also be fused with the CT part of the exam for display for easier anatomic colocalization (Figs. 5.10, 5.11, 5.12, 5.13). The uptake on PET can also be evaluated semiquantitatively using the standard uptake value (SUV), a measure of the radioactivity within a region of interest (e.g., tumor) corrected for the amount of radioactivity injected and the patient’s body weight. The SUV by itself is not specific, and a number of benign processes can result in false-positive uptake on a PET scan, as discussed below. Nonetheless, SUV is a useful indicator of the potential of a lesion to represent a malignancy.13

The most common SUV used as a threshold between a benign and potentially malignant lesion is 2.5. This value has been extrapolated from a study of pulmonary lesions
performed in 199319 and has been used by some for evaluation of head and neck cancer.20 Therefore, although it is useful as a reference for potential pathology, there is no clear evidence that this threshold can be extrapolated to lymph nodes or tissues and lesions outside the thorax. For example, others have used an SUV of 3.5 to 4 as threshold for evaluation of lymphadenopathy,21 and one study showed that the greatest specificity for determination of metastatic nodal disease in squamous cell carcinoma (SCC) was achieved when a threshold of 5 was used.22 As discussed by Escott,13 another pitfall of using strict SUV criteria for determination of lymphadenopathy is that small pathologic lymph nodes may have an SUV value below an accepted threshold and thus be visually difficult to call abnormal. This highlights the importance of using the SUV as a guide, rather than absolute determining value, and carefully correlating with findings on the contrastenhanced CT for determination of pathologic lesions and lymphadenopathy.


Pitfalls, Artifacts, and False Positives in PET Imaging

It is also important to be aware of general pitfalls, potential false positives, and artifacts during PET/CT interpretation. An exhaustive list of false-positive and false-negative findings is beyond the scope of this chapter, but increased FDG uptake can be seen in a variety of nonneoplastic pathologies such as inflammatory and infectious processes, including that seen after radiation therapy, as well as uptake from normal anatomic structures such as muscle, brown fat, salivary glands, and lymphoid tissue, particularly the tissues of Waldeyer ring13,23 (Figs. 5.11 and 5.12). Asymmetric uptake can occur with vocal cord paralysis (Fig. 5.13) or after surgery or other posttreatment changes resulting in asymmetric muscle uptake. A number of benign lesions can also result in increased FDG uptake including thyroid adenomas, Paget disease, and fibrous dysplasia. Thyroiditis and Graves disease can also result in increased FDG uptake. One must also be aware of different artifacts including those secondary to metallic implants or dense IV or enteric contrast falsely appearing as hypermetabolic areas.


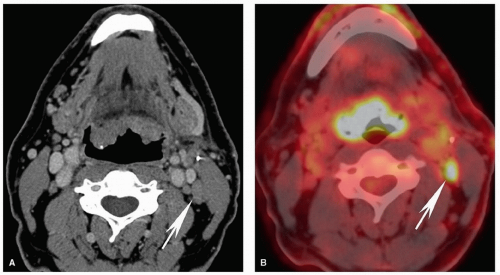
Figure 5.11. Pitfalls and false positives in PET: lymphoid tissues of the Waldeyer ring. Axial contrast-enhanced CT scan (A) and fused PET image (B) are shown from a 50-year-old with carcinoma of unknown primary who presented with an N2C neck. On CT, there are enlarged lingual tonsils at the base of the tongue without a focal enhancing mass. On PET, there is diffusely increased uptake of this lymphoid tissue. However, all base of tongue biopsies were negative. Note the pathologic level IIb node detected on PET (arrow). On CT, the node is prominent but cannot be characterized as abnormal by anatomic imaging criteria.


EVALUATION OF TUMORS—GENERAL CONSIDERATIONS


Overview

Although there are important differences in tumor behavior, spread pattern, and consequently imaging evaluation according to the primary site, the general approach to interpreting head and neck cancer studies is similar regardless of specific tumor or primary location. A careful, systematic evaluation is essential for optimal imaging assessment and should parallel the American Joint Committee on Cancer (AJCC) tumor, node, metastasis (TNM) staging system.24 Using this approach, the report will follow a logical and clinically relevant structure for optimal communication of results. In this regard, it is not absolutely necessary to provide the specific radiologic tumor stage in the report, the pros and cons of which are beyond the scope of this chapter. What is important is to evaluate and identify involvement of critical structures that would alter tumor stage and consequently patient management.

As discussed earlier, one role of imaging is to evaluate a lesion’s characteristics, provide a differential diagnosis, and
when necessary help with biopsy planning. Imaging can also be helpful in clinically misleading presentations, and sometimes the radiologist is the first to suggest the presence and site of a head and neck cancer (Fig. 5.14). However, frequently, at the time of initial evaluation, the diagnosis has already been made, and the main role of imaging is to stage the tumor. The added value of imaging in that scenario is typically to upstage the clinical assessment by identifying involvement of critical structures, lymph nodes, or distant metastases that are not reliably identified clinically. Imaging can also guide biopsy when there are potentially important equivocal findings. Furthermore, imaging plays a key role in follow-up and surveillance of cancers to evaluate response to treatment, progression of disease, and tumor recurrence.


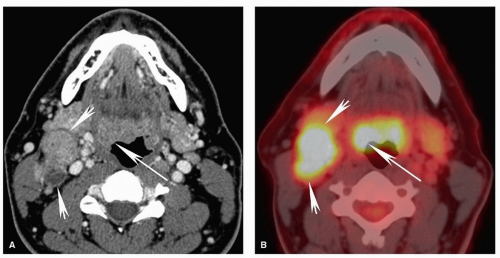
Figure 5.12. Pitfalls and false positives in PET: lymphoid tissues of the Waldeyer ring. Axial contrast-enhanced CT scan (A) and fused PET image (B) are shown from a 52-year-old with biopsy-proven squamous cell carcinoma of the right base of the tongue. Similar to the case in Figure 5.11, there is diffuse uptake at the base of the tongue without clear focally increased uptake at the site of tumor on the right (long arrow). On CT, there is asymmetric enlargement of the right base of tongue tissues (long arrow). Although by itself this is insufficient for a confident diagnosis, it is useful for directing the biopsy, which demonstrated cancer at that site. Note the large, partly necrotic, right level II pathologic nodal mass with diffusely increased uptake on PET (short arrows).


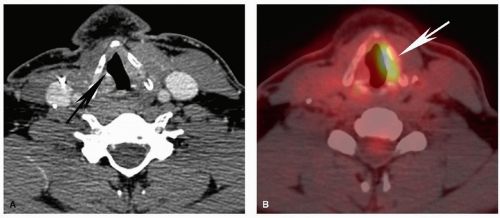
Figure 5.13. Pitfalls and false positives in PET: asymmetric muscle uptake associated with vocal cord paralysis. Axial contrastenhanced CT scan (A) and fused PET image (B) are shown from a 33-year-old patient operated for thyroid cancer with right vocal cord paralysis. The CT image demonstrates a patulous laryngeal ventricle on the right (black arrow) typical of vocal cord paralysis. The PET image demonstrates typical compensatory increased activity in the normal left true vocal cord (white arrow). This should not be mistaken for tumor.


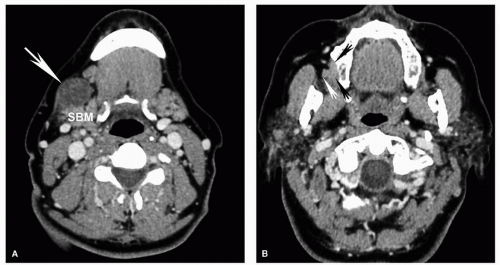
Figure 5.14. Nodal metastasis from squamous cell carcinoma presenting clinically as a submandibular region mass. Axial contrastenhanced CT images in a patient referred for evaluation of a new right submandibular mass demonstrate an inhomogeneous enlarged level IB node (large arrow; A) anterior to the submandibular gland (SBM), compressing and displacing the gland posteriorly. Images more superiorly demonstrate a small buccal mucosal primary cancer (small arrows; B). The small black arrows mark the medial margin of the tumor. The small white arrow marks the lateral margin of the tumor, resulting in partial obliteration and asymmetry of adjacent buccal space fat. Evaluation of subtle loss of symmetry is very useful for detection of small lesions in the neck.

Tumors can spread by direct extension with encroachment and invasion of nearby structures, lymphatic dissemination, and hematogenous dissemination to distant sites, as reflected in the TNM staging.24 A less common but important route of spread for head and neck cancer is along the nerve bundles, referred to as PNS of tumor.25,26 In addition, head and neck cancer patients are also at risk for the presence of a second primary cancer, which can arise from the upper aerodigestive tract, the lungs, or less frequently other organs.27,28,29,30,31,32 A thorough evaluation will lead to proper staging at the time of diagnosis and, in turn, will help determine the appropriate treatment regimen.24 The following sections will provide an overview of imaging characteristics and approach to evaluation of head and neck cancer.


Approach to Evaluation and General Characteristics of Head and Neck Cancer on CT, MRI, and PET

The majority of head and neck cancers are SCCs. Although it is not always possible to distinguish different malignancies based on imaging alone, SCCs, especially when large, tend to have a more invasive or aggressive appearance with irregular enhancing margins, invasion rather than displacement of adjacent normal anatomic structures, and areas of internal heterogeneity/necrosis or ulceration (Figs. 5.3, 5.4, and 5.6). More indolent or benign neoplasms such as benign salivary gland tumors tend to have more homogenous appearance with smooth rounded margins, however, biopsy is typically required for definitive diagnosis. Malignant salivary gland neoplasms may have a similar appearance as SCC on imaging and require biopsy for diagnosis (Fig. 5.15). For necrotic or cystic lesions, nodularity and irregularity of the margins of the lesion favors a malignant process over benign cystic lesions or abscesses,8 but there can be overlap in appearance, and without clinical information or biopsy, the imaging appearance may not be sufficient for a definitive distinction from inflammatory or infectious lesions.

On CT, SCCs can appear as homogenous or heterogeneous soft tissue attenuation lesions with variable enhancement33,34 (Figs. 5.2, 5.3, 5.4). There can be areas of internal heterogeneity or necrosis with low attenuation, particularly in larger lesions (Fig. 5.3). On MRI, the soft tissue extent of a tumor may be better seen because of MRI’s superior soft tissue contrast compared to CT. On conventional T1w images without fat suppression, SCC has intermediate signal intensity and is generally isointense or hypointense to muscles35,36,37,38 (Fig. 5.6), although rarely it may be slightly hyperintense.38 On T2w images, SCC is typically isointense to hyperintense relative to normal muscle (but may be hypointense depending on the specific tumor type and cellularity) and can appear heterogeneous35,37,38 (Fig. 5.16). Similar to CT, SCC has variable enhancement on contrastenhanced MRI and typically well seen on fat-suppressed T1w images35,36,37 (Figs. 5.6, 5.16, and 5.17). It is important to confirm that the high signal represents true enhancement by comparing to the similar sequence obtained before fat suppression.

Assessment of tumor density on CT and signal on MRI is only part of the evaluation used to detect tumor and delineate its extent. Assessment for presence of asymmetry is also key for detection of subtle small tumors that may have density or signal similar to adjacent structures (Fig. 5.14). Loss of symmetry in or around a structure can be an important clue to the presence of pathology in that region. Fat represents an important source

of intrinsic contrast on both CT and MRI and is clearly distinguishable from soft tissue characteristics of most nonlipomatous tumors. Careful evaluation of infiltration and obliteration/asymmetry in the fat within and fat planes separating various structures and spaces in the neck will enable identification of small tumors and areas of tumor infiltration (Fig. 5.14). Familiarity with the detailed anatomy of the neck is an essential asset to help evaluation. Disruption of normal tissue architecture is also important for evaluating tumor infiltration. For example, the preserved striated architecture of denervated muscle should enable
distinction from tumor invasion despite the abnormal signal (Fig. 5.8). By taking into account all the different characteristics, an optimal imaging evaluation and lesion characterization can be performed. Information from the PET scan complements the anatomic information provided on CT and MRI and can increase sensitivity for detection of tumor, lymphadenopathy, and recurrence in head and neck squamous cell carcinoma (HNSCC).13


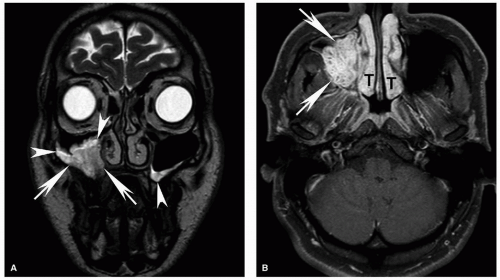
Figure 5.15. Adenoid cystic carcinoma of the maxillary sinus. Coronal T2w (A) and axial postcontrast T1w (B) fat-suppressed images from a 26-year-old patient. On T2w images, the tumor (arrows) is hyperintense to muscle but not strikingly bright. There is only a small amount of secretions and inflammatory mucosal changes on either sides (arrowheads), with higher signal than the tumor on T2w images (A). There is heterogeneous but robust enhancement of the tumor arrows in (B). The normal enhancement of the lining of nasal turbinates (T) should not be mistaken for tumor. In cases when tumor abuts the turbinates, this distinction may be more difficult, but careful evaluation of contiguity with the main tumor mass and subtle signal changes on all sequences may be helpful for making the distinction.


Figure 5.16. Buccal squamous cell carcinoma. Coronal T2w (A) and contrast-enhanced fat-suppressed T1w (B) images. The mass is heterogeneous and appears hyperintense to muscle on T2w images with heterogeneous enhancement that is greatest around its margins.


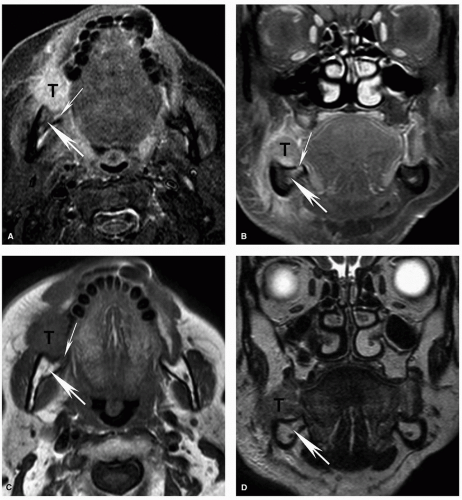
Figure 5.17. Superficial invasion of the mandibular cortex with reactive marrow edema on MRI. Axial STIR (A), coronal contrastenhanced fat-suppressed T1w (B), axial T1w (C), and coronal T2w (D) MRI images are shown from the same patient whose CT is shown in Figure 5.4. Corresponding to the small focal cortical break seen on CT, there is a potential defect (thin arrow), although the MRI is less convincing than the CT. There is also mildly increased signal within the marrow (thick arrow) on the STIR (A) and contrast-enhanced (B) images, demonstrating the increased sensitivity of MRI for detecting subtle marrow changes. However, in this case, the fat within the marrow is preserved on the T1w image (C; thick arrow) and the signal is normal on the T2w image (D; thick arrow). This suggests that the mild signal abnormality represents reactive marrow edema and not true marrow invasion. Pathology confirmed superficial cortical invasion without marrow invasion.


Evaluation of the Primary Site and Local Extent of Tumor (T Stage)


General Evaluation

After identification of the primary tumor, the initial key task of the radiologist is to determine the anatomic extent of the tumor. The T stage indicating the extent of primary tumor will vary depending on the primary site, and important site-specific determinants of T stage are discussed later for individual primary sites or can be found in the AJCC manual24 and elsewhere in this book. In this regard, familiarity with the AJCC tumor staging classification and factors altering management, including those important for selection of organ preservation and surgical therapies, is an essential asset for the head and neck radiologist and will enable the radiologist to provide an optimal, clinically relevant imaging evaluation. Regardless of particularities of each primary site, certain general principles apply to all sites.


Evaluation of Bone Invasion

CT and MRI are generally considered complementary in the evaluation of bone invasion by tumor. CT better demonstrates bone detail and architecture and is excellent for evaluation of cortical bone. CT is particularly useful for assessment of subtle cortical bone destruction or periosteal reaction (Figs. 5.4 and 5.18). CT also shows bony landmarks, including those used for surgical planning and intraoperative guidance during sinonasal and skull base surgery. On the other hand, MRI is more sensitive than CT for detection of early marrow invasion and better depicts marrow invasion by tumor (Fig. 5.18). MRI has superior sensitivity to CT in demonstrating marrow edema. This can be an advantage, but care should be taken to make sure the signal is similar to the actual tumor in order not to overcall marrow invasion (Figs. 5.17 and 5.18).


Evaluation of Arterial Invasion

Invasion of the carotid artery in head and neck cancer portends a poor prognosis39 and alters management, including surgical approach and assessment for resectability of a lesion. Different imaging criteria have been evaluated for prediction of arterial invasion by tumor.40,41,42,43,44 In general, if there is >180 degree encasement of the circumference of the artery with loss of fat plane, the possibility of invasion needs to be raised and there is high likelihood of invasion if there is >270 degree encasement.40


Role of FDG-PET in the Evaluation of Untreated Primary Tumor Local Extent and T Stage

Most HNSCCs are well visualized by CT and MRI during initial tumor evaluation, and CT and MRI are superior to PET alone for evaluation of detailed anatomy and tumor extent. Therefore, even though PET has high accuracy in detecting the primary lesion, typically, it does not add significant clinically useful information to CT/MRI for determination of the local anatomic extent/T stage of the tumor.14 However, in cases of equivocal findings, PET may be helpful and should be considered. In cases of carcinomas of unknown primary, there is currently no consensus on the role of PET. Although some studies have reported that the addition of PET improves detection of the occult primary HNSCC,20 PET does not have sufficient sensitivity or negative predictive value to exclude a primary. In particular, PET has low sensitivity for detection of primary cancers arising in the oropharynx because of the relatively high background physiologic activity within the Waldeyer ring structures14 (Figs. 5.11 and 5.12).


Evaluation of Lymphatic Spread of Tumor (N Stage)


Overview

Determination of the presence of nodal metastasis is also essential for proper staging and surveillance of head and neck cancer. In the AJCC classification, there is a uniform N classification system for cervical lymph node metastasis from all primary sites except for those arising from the nasopharynx, thyroid, and skin cancers; nasopharyngeal carcinoma has a separate nodal staging classification.24 Imaging plays an important role in evaluation of lymph nodes, enabling confirmation of clinically suspected lymphadenopathy and evaluation of deeper nodal levels that cannot be reliably evaluated on clinical examination.45,46,47 Optimal evaluation for the presence of lymphadenopathy requires an understanding of the strengths and limitations of imaging criteria used for determination of nodal metastases. In equivocal cases, image-guided (usually US) biopsy can be used for a more definitive assessment. In addition, it is important to be aware that although imaging is useful for staging a tumor, imaging cannot reliably exclude micrometastases to lymph nodes, especially for tumors of the oral cavity. It is worth emphasizing that potentially abnormal nodes should be interpreted in the context of their location with respect to a known or suspected primary malignancy; their size, shape, and number; or presence of focal internal defect. As such, isolated interpretation based solely on the appearance of lymph nodes on an imaging study is fraught with pitfalls and is discouraged.45,46,47


Imaging-Based Anatomic Classification of Lymph Nodes

When evaluating cervical lymph nodes, the first step is the proper anatomic localization of a lymph node. Earlier lymph node classification systems were based on clinical landmarks.45,46,47,48 However, with improvements in imaging techniques enabling accurate identification of enlarged lymph nodes and a shift in treatment paradigm in which many cancers were not treated surgically, an imaging-based classification system represented the most practical and logical approach. The imaging-based classification system proposed by Som et al.49 is a level-based classification and has received widespread acceptance, including adoption by the AJCC. The rationale behind this classification system is to provide a reproducible, widely applicable framework based on readily identifiable imaging landmarks.

In the imaging-based classification, the cervical nodal chains are divided into seven levels.45,46,47,48,49 The levels and the landmarks used for the classification are described in detail in Table 5.4 and illustrated in Figure 5.19. Briefly, level I consists of submental (IA) and submandibular (IB) nodes. Levels II to IV consist of internal jugular nodes. Level II nodes extend from the skull base to the level of the lower body of the hyoid bone. Level II is further subclassified into levels IIA (anterior) and IIB (posterior to the internal jugular vein and separated from it by a fat plane). Level III nodes consist of those nodes that are around the internal jugular vein, between the level of the lower body of the hyoid bone and the level of the lower margin of the cricoid cartilage


arch. Level IV nodes are internal jugular chain nodes that extend from the level of the lower margin of the cricoid cartilage arch to the level of the top of the manubrium. Level V nodes are posteriorly located lymph nodes that are subdivided into levels VA and VB. Level VI nodes are the visceral nodes, and level VII nodes are those that lie caudal to the top of the manubrium, located between the medial margins of the left and right common carotid arteries in the substernal region45,46,47 (Fig. 5.19; Table 5.4). Please refer to Table 5.4 for a detailed description of the anatomic landmarks used for the imaging classification.


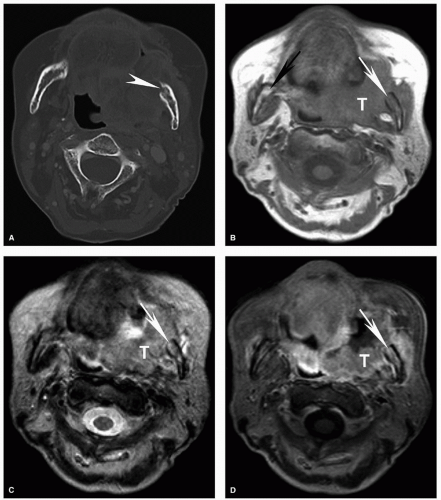
Figure 5.18. Increased sensitivity of MRI for determination of invasion of the bone marrow compared to CT. Axial CT displayed in bone windows (A) and unenhanced T1w (B), T2w (C), and contrast-enhanced fat-suppressed T1w (D) MRI images are shown from a patient with an advanced squamous cell carcinoma of the retromolar trigone (T) with invasion of multiple adjacent spaces including the buccal space, masticator space, and oropharynx. On CT, the cortical invasion of the left mandible is subtly evident (arrowhead). However, the marrow invasion is not clearly demonstrated. On the MRI, however, there is clear invasion of the marrow with replacement of the normal marrow fat in the mandibular ramus with tumor (white arrow). Note the difference compared to the normal marrow of the contralateral mandibular ramus, particularly well seen on the unenhanced T1w image (B, black arrow). Unlike reactive marrow edema shown in Figure 5.17, the marrow signal abnormality follows the signal of large extraosseous tumor mass on all sequences, a key feature for differentiating the two on imaging.


Table 5.4 Landmarks Used for Cervical Lymph Node Localization Using the Imaging-Based Classification


Node Levels


Major Landmarks


Sub-Classifications


Level I


All of the nodes below the mylohyoid muscles, anterior to a transverse line drawn through the posterior edge of the submandibular gland in the axial plane, and above the bottom of the body of the hyoid bone.


Level IA


Nodes that lie between the medial margins of the anterior bellies of the digastric muscles (previously classified as submental nodes)


These include previously classified submental and submandibular nodes.


Level IB


Nodes that lie posterior and lateral to the medial edge of the anterior belly of the digastric muscle (previously classified as submandibular nodes)


Level II


Nodes around the internal jugular vein extending from the lower bony margin of the jugular fossa at the skull base to the level of the lower body of the hyoid bone.


Level IIA


Nodes that lie anterior, lateral, or medial to the internal jugular vein (previously classified as upper internal jugular nodes) as well as nodes that lie posterior to the internal jugular vein and are inseparable from the vein


Nodes that lie anterior to a transverse line drawn on each axial image through the posterior edge of the sternocleidomastoid muscle, and posterior to a transverse line drawn on each axial scan through the posterior edge of the submandibular gland.


In the area within 2-3 cm of the skull base, a node located anterior, lateral, or posterior to the internal carotid artery is classified as a level II node. However, if the node lies medial to the internal carotid artery, it is classified as a retropharyngeal node. More caudally, level II nodes include those located anterior, lateral, medial, or posterior to the internal jugular vein.


Level IIB


Nodes that lie posterior to the internal jugular vein and are separated from the vein by a fat plane (previously classified as upper spinal accessory nodes). These nodes are located in the fat deep to the sternocleidomastoid muscle.


Level III


Nodes around the internal jugular vein between the level of the lower body of the hyoid bone and the level of the lower margin of the cricoid cartilage arch.


These nodes lie anterior to a transverse line drawn on each axial image through the posterior edge of the sternocleidomastoid muscle.


Level III nodes also lie lateral to the medial margin of either the common carotid artery or the internal carotid artery. On each side of the neck, the medial margin of carotid arteries separates level III nodes (located laterally) from level VI nodes (located medially).


Level IV


Nodes around the internal jugular vein between the level of the lower margin of the cricoid cartilage arch and the level of the top of the manubrium.


These nodes lie anterior and medial to an oblique line drawn through the posterior edge of the sternocleidomastoid muscle and the lateral posterior edge of the anterior scalene muscle.


The medial margin of the common carotid artery is the landmark that separates level IV nodes (located laterally) from level VI nodes (located medially).


Level V


Nodes extending from the skull base, at the posterior border of the attachment of the sternocleidomastoid muscle, to the level of the clavicle, as seen on each axial scan.


Level VA


Nodes between the skull base and the level of the lower margin of the cricoid cartilage arch, behind the posterior edge of the sternocleidomastoid muscle


All these nodes lie anterior to a transverse line through the anterior edge of the trapezius muscle in the axial plane.


From the skull base to the bottom of the cricoid arch, these nodes are located posterior to a transverse line through the posterior edge of the sternocleidomastoid muscle in the axial plane (VA). More caudally, between the level of the bottom of the cricoid arch and top of the manubrium, they lie posterior and lateral to an oblique line through the posterior edge of the sternocleidomastoid muscle and the lateral posterior edge of the anterior scalene muscle (VB).


Level VB


Nodes between the lower margin of the cricoid cartilage arch and the level of the clavicle, as seen on each axial scan. They are behind an oblique line through the posterior edge of the sternocleidomastoid muscle and the lateral posterior edge of the anterior scalene muscle.


Level VI


Nodes located between the medial margins of the left and right common carotid or internal carotid arteries, extending from the level of the lower body of the hyoid bone to the level superior to the top of the manubrium. These are the visceral nodes.


Level VII


Nodes in the substernal region extending from the level of the top of the manubrium to the level of the innominate vein, between the medial margins of the left and right common carotid arteries


Adapted from Forghani R, Yu E, Levental M, et al. Imaging evaluation of lymphadenopathy and patterns of lymph node spread in head and neck cancer. Expert Rev Anticancer Ther. 2015:15(2):207-224.

Only gold members can continue reading. Log In or Register to continue

Stay updated, free articles. Join our Telegram channel

Dec 18, 2016 | Posted by in ONCOLOGY | Comments Off on Imaging of Head and Neck Cancer

Full access? Get Clinical Tree

Get Clinical Tree app for offline access