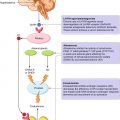
Fig. 8.1
Physiopathological processes correlate with the entrance of FDG in the prostatic cancer cell. DHT dihydrotestosterone, AR androgen receptors, TCA tricarboxylic acid cycle
8.2 Comparative Diagnostic Accuracy among Imaging Modalities
Early studies in mid-1990s showed discrepancy between bone scintigraphy and FDG PET with bone scans showing more lesions than FDG PET [11, 12]. However, the clinical setting was mixed, and more studies in specific clinical settings were needed to decipher the unique utility of FDG PET. One prospective investigation compared FDG PET and conventional bone scan in 16 patients with prostate cancer [13]. Overall bone scan detected more suspicious metastatic bony lesions than FDG PET; however, PET also revealed some marrow-only disease sites and many metastatic soft tissue lesions. The apparent false-negative FDG PET findings at some bony sites may have in fact been true negative with regard to favorable response to treatment with metabolically inactive disease, while bone scan may have displayed false-positive flare or healing reaction at these sites. The authors concluded that bone scan and FDG PET could be complementary in the management of patients with metastatic prostate cancer (Fig. 8.2).
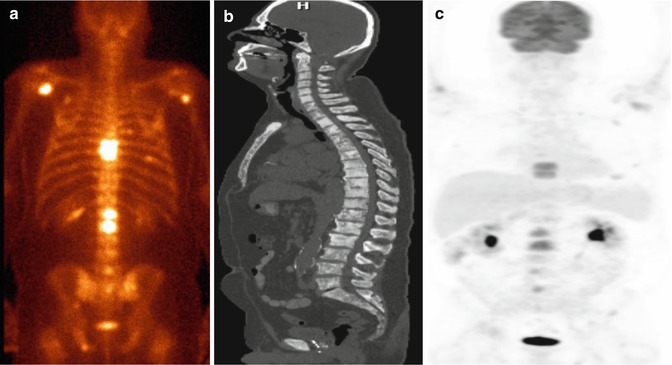
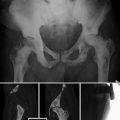
Fig. 8.2
Metastatic castrate-resistant prostate cancer (PSA 168.6 ng/mL). 99mTc-MDP bone scan (a) shows multiple randomly distributed osseous lesions while sagittal CT scan at bone window level (b) shows many more sclerotic lesions and FDG PET maximal intensity projection image (c) demonstrating fewer metabolically active lesions than bone scan
In a prospective study of patients with breast, lung, and prostate cancer, FDG PET-CT was compared with 18F-NaF PET-CT and standard 99mTc-methylene diphosphonate (99mTc-MDP) bone scan at the time of initial staging or restaging [14]. Sensitivity and negative predictive value of 18F-NaF PET-CT was 100 % for all 3 cancers. In prostate cancer, the sensitivity, specificity, negative predictive value, and positive predictive value were 72 %, 65 %, 100 %, and 100 %, respectively. Conventional bone scan displayed superior sensitivity and negative predictive value compared to FDG PET-CT but had lower specificity and positive predictive value. Langsteger et al. contended in a review article that 18F-NaF PET provides a more sensitive “conventional” bone scan and also that FDG PET in early disease (marrow only involvement) is more advantageous than 18F-NaF PET [15]. It is interesting to note that FDG PET-CT may also display extensive hypermetabolic osseous metastatic disease similar to “superscan” described previously for bone scintigraphy [16]. The use of combined 18F-NaF and FDG has been advocated by some investigators who contend that such co-injected radiotracer PET study can provide synergistic diagnostic information with reduced overall cost and patient radiation exposure from the CT component and enhanced patient convenience [17, 18]. Mianamimoto et al. from Stanford University, Stanford, CA, prospectively evaluated the use of combined 18F-NaF and FDG in 15 men with prostate cancer and 15 women with breast cancer [19]. For detection of skeletal lesions, combined PET scintigraphy showed significantly higher sensitivity compared to whole-body magnetic resonance imaging (MRI) alone (96.2 % vs. 81.4 %, p < 0.001) and 99mTc-MDP bone scan alone (96.2 % vs. 64.6 %, p < 0.001). For extra-skeletal lesions, there was no statistically difference between PET scintigraphy and whole-body MRI. In one retrospective study of 91 men with PSA relapse following prostatectomy and validation of PET findings by biopsy or clinical and imaging follow-up, mean serum PSA levels were higher in the FDG PET-positive patients than in the FDG PET-negative patients (9.5 ± 2.2 ng/mL vs. 2.1 ± 3.3 ng/mL) with an overall PET detection rate of 31 % [20]. However, the reported detection rate was likely overestimated since some patients had disease already evident on conventional imaging; as such the unique diagnostic contribution of FDG PET in this clinical setting was unclear. Nevertheless, PET-CT with FDG in patients with prostate cancer has a prognostic meaning, being able to assess the aggressiveness of the lesions and therefore the long-term survival ([7]; Fig. 8.3).
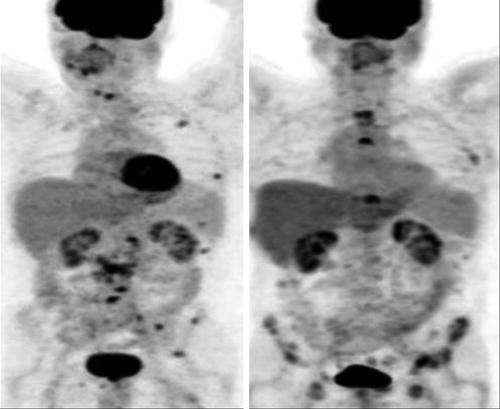
Fig. 8.3
Prognostic utility of FDG PET-CT in metastatic prostate cancer. Maximum intensity projection PET images show clinical states of castrate-sensitive predominantly lymph node disease at baseline (left) developing into castrate-resistant predominantly bone metastatic disease after 12 months (right). The patient died at 28.5 months after the baseline scan (This research was originally published in Jadvar [7]. Figure 3)
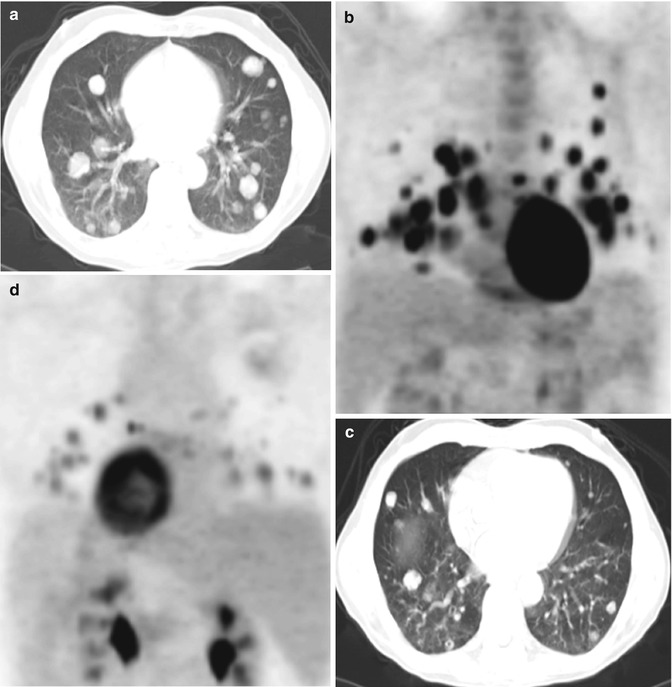
Jadvar et al. reported on a prospective investigation of FDG PET-CT and 18F-NaF PET-CT in detection of occult metastases in 37 men with biochemical recurrence (range, 0.5–40.2 ng/mL) and negative standard imaging studies [21]. The occult metastasis detection rate for FDG PET-CT was only 8.1 %, which was much lower than that reported previously and likely represented the unique diagnostic information provided by FDG PET-CT in this clinical setting (Fig. 8.4).
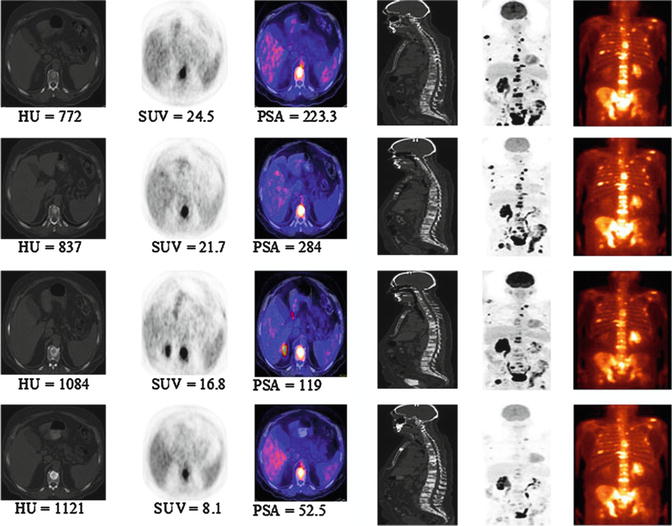
Fig. 8.4
Serial 18F-FDG PET-CT and bone scans of 63-year-old man with castrate-resistant metastatic prostate cancer with original primary cancer Gleason score of 9. Rows from top to bottom are scans at baseline (before chemotherapy) and at 4, 8, and 12 months after initiation of chemotherapy. Columns from the left to right are axial CT scans (bone window level), 18F-FDG PET scan, fused PET-CT scans, mid sagittal CT scan (bone window level), PET maximum intensity projection images, and 99mTc-methylene diphosphonate bone scans. Concordant decline in overall metabolic activity of metastatic lesions and PSA level is seen with treatment. Sclerosis of osseous lesions increases as corresponding metabolic activity declines with treatment (This research was originally published in JNM. Jadvar [34]. Fig. 8.2 © by the Society of Nuclear Medicine and Molecular Imaging, Inc.)
8.3 Treatment Response Evaluation and Outcome Prediction
It has become evident that conventional imaging methods are inadequate for the assessment of changes in bone metastases in response to various treatments. Challenges include flare phenomenon, insensitivity to capture degrees of biological response, and the need to interpret imaging changes in the context of other clinical and nonimaging data. The situation is even more problematic since bone lesions are considered nonmeasurable targets in the commonly used structure-based response criteria (e.g., RECIST 1.0 and RECIST 1.1). New international consensus response criteria specific for bone metastases using the newer imaging modalities (PET, multiparametric MR imaging) will need to be developed and then adopted to improve treatment response assessment of bony lesions [22]. Preclinical studies have shown the feasibility of assessing response to therapy quantitatively. Zhang et al. performed FDG microPET scans before, during, and after treatment with bortezomib (a proteasome inhibitor) in immunodeficient mice harboring prostate tumor cell line CWR22 xenografts [23]. Decline in tumor FDG uptake was advantageous over tumor volume reduction in measuring response to therapy. In the clinical arena, Zukotynski and colleagues performed FDG PET-CT, 18F-NaF PET-CT, and standard 99mTc-MDP bone scan in 9 men with castrate-resistant prostate cancer before and after 8 weeks of therapy with abiraterone and cabozantinib [24]. The authors found that 18F-NaF-avid disease was not predictive of treatment response. However, FDG PET-CT was noted to have the potential to stratify men into three groups (widespread vs. oligometastatic FDG-avid vs. non-FDG avid metastases) that could tailor appropriate therapy. Simoncic and colleagues compared dynamic 18F-NaF and FDG PET-CT for assessment of response to zibotentan in men with bone metastases from prostate cancer [25]. All patients initially received a diagnostic CT and bone scan, followed by 18F-NaF and FDG PET-CT and MR imaging at baseline (before therapy), and then again after 4 weeks of therapy (peak therapy effect). Zibotentan was then held for 2 weeks (therapy break with maximum drug washout) followed by the final 18F-NaF and FDG PET-CT and MR imaging scans. It was assumed that a change in imaging metrics from baseline scan to week 4 scan would be most suggestive of a true therapy effect if the scan at week 6 (i.e., after 2 weeks of drug break) showed a change back toward baseline scan. Conversely, a change from baseline scan to week 4 scan that still persisted at week 6 (after drug break), might have represented a change that was probably not due to treatment effect (or possibly reflected drug resistant colonies). The 2-week drug washout was based on the half-life of zibotentan, with complete drug washout at the time of week 6 scan. Late (week 6) 18F-NaF and FDG uptake responses were correlated, but earlier uptake responses (4 week scan) were unrelated suggesting that 18F-NaF and FDG uptakes in the setting of response assessment may be spatially dislocated and that both radiotracers may provide complementary information. A recent investigation showed that FDG PET could be useful in assessing treatment with the mTOR inhibitor, everolimus, in combination with docetaxel [26]. Yu et al. compared 11C-acetate and FDG in assessing treatment response to androgen deprivation therapy in 8 patients with >3 prostate cancer metastases on bone scintigraphy [27]. The authors’ overall conclusion was that acetate PET is complementary to FDG PET in bone metastases detection, probably reflecting the underlying complex tumor biology. Morris et al. from Memorial Sloan Kettering Cancer Center in New York, NY, performed a lesion-by-lesion analysis of FDG PET in progressive metastatic prostate cancer in 17 patients with 134 osseous lesions [28]. Ninety-five lesions (71 %) were evident on both FDG PET and bone scans, 31 lesions (23 %) were only seen on bone scan, and 8 lesions (6 %) were seen only on FDG PET. All metabolically active lesions on FDG PET were noted to be active on the follow-up bone scans (suggesting true positive findings on PET). The authors concluded that FDG PET could discriminate metabolically active bony lesions from scintigraphically quiescent lesions in men with progressive metastatic prostate cancer. Along the same line of rationale, the same group of investigators showed that FDG PET could be used as an outcome measure in patients with metastatic castrate-resistant prostate cancer undergoing treatment with antimicrotubule chemotherapy [29] (Fig. 8.5).