Imaging in Radiotherapy
George T.Y. Chen
Gregory C. Sharp
John A. Wolfgang
Introduction
Imaging is the basis of modern radiotherapy. Imaging plays a major role in localizing the extent of disease, improving treatment planning, guiding treatment delivery, and therapy response assessment.
One of the key advances has been the capability of visualizing patient anatomy in tomographic planes. Malignancies often alter the spatial relationships of normal organs (1) and imaging is essential in defining the volumetric extent, shape, and location of the tumor and adjacent normal organs. Four-dimensional computed tomography (4D CT) additionally provides trajectory information of organs relevant to treatment of moving tumors. Dose calculations utilize electron density data extracted from computed tomography (CT) scans. Serial imaging can also be used to visualize and quantify changes in tumor size and tissue densities for adaptive radiotherapy.
With advances in radiation delivery such as intensity modulated or charged-particle-beam radiotherapy (2,3,4,5,6), radiation therapy is now capable of delivering highly conformal doses. These delivery advances have increased the interest in the development of more accurate methods to image and treat moving targets. Complementary advances in treatment-room imaging have further provided the capability of image-guided radiotherapy (IGRT), in which images obtained on a daily basis before or during treatment are used to correct for variations in setup and organ motion. This chapter surveys the imaging modalities and image processing techniques relevant to achieving accurate radiotherapy.
Examining sources of uncertainties in the radiation process (7) provides insights into ways in which imaging can be used to improve treatment. Uncertainties in the process begin with those associated with target delineation. Early studies on the use of CT scan in treatment planning documented that tumor coverage without a CT scan was inadequate in 20% of the patients, marginal in another 27%, and adequate in 53% of the studied population (8). Defining the extent of the target volume in an accurate, consistent, and efficient manner is clearly important (9). With target positional uncertainties due to physiologic processes (10) (e.g., breathing, variable bladder filling), attention must be paid to adequate coverage of a dynamic target.
Another uncertainty is prescribing the appropriate dose sufficient for local tumor control. The dose prescribed may be limited by concern for nearby dose-limiting normal tissues. Imaging provides anatomic and functional localization of normal structures. A more accurate knowledge of the location of normal structural and functional regions may, in conjunction with sophisticated delivery techniques, lead to delivery of higher tumor doses while sparing normal structures, in order to achieve greater local control without increasing treatment-induced morbidity.
Even if the tumor is precisely contoured and an adequate dose is prescribed, uncertainties in dose delivery exist. The root causes of these uncertainties include (a) random and systematic patient setup error, (b) variations in organ physiologic states, which may cause interfractional target motion, and (c) intrafractional organ motion. Imaging can be used to monitor, quantify, correct, and adapt for these variations prior to treatment delivery. IGRT is addressed in detail in Chapter 12.
The image data sets used in treatment may be broadly categorized into acquired and processed images. Acquired anatomical images include volumetric data, most commonly CT scan, magnetic resonance imaging (MRI), emission tomography (PET, SPECT), and ultrasound (US). Radiographic projection images remain an important component of radiotherapy imaging and include film and electronic portal images acquired during simulation and treatment. Processed images in this chapter are defined as images derived from acquired image data. Examples include digitally reconstructed radiographs (DRRs) and volume-rendered images, both of which can be generated from CT studies.
The general principles of medical image formation are described in textbooks on diagnostic radiology and selected oncology texts (7,11). A clinical review of oncologic imaging is found in “Oncologic Imaging” edited by Bragg Rubin Hricak (12). For a historical perspective of imaging, the observance of the centennial anniversary of the discovery of x-rays by Roentgen has resulted in several excellent historical reviews (13,14,15).
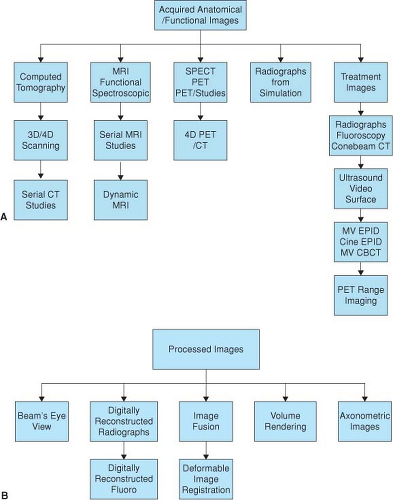 Figure 2.1. Schematic diagram of image data types, (A) acquired and (B) processed images, used in the course of radiotherapy. MRI, magnetic resonance imaging; SPECT, single photon emission computed tomography; PET, positron-emission tomography; 3D, three-dimensional; 4D, four-dimensional; CT, computed tomography; MV EPID, megavolt electronic portal imaging device; MV CBCT, megavolt core-beam computed tomography. |
Acquired Images
Volumetric Imaging
Figure 2.1 diagrammatically summarizes the diverse imaging modalities used in radiotherapy. Volumetric images are used principally to define the geometric shape and location of targets and the location of organs or functional areas at risk. The volumes of interest in treatment planning are defined interactively though a digitizing device such as a computer mouse or trackball.
The terminology and definitions associated with volumes of interest have evolved over time (ICRU 50,62,71). Table 2.1 (16) defines terminology commonly in use (17). Target volume delineation is subjective, and there are uncertainties introduced by interobserver and modality-specific variability (18,19). More advanced computer automated techniques to aid in image segmentation are under development (20).
Volumetric images are also acquired for target localization pretreatment to improve treatment accuracy (IGRT, typically with cone-beam CT). Serial volumetric studies are frequently acquired during the course of treatment and followup to monitor anatomical changes.
In this chapter, we group acquisition of volumetric images according to the imaging modality, beginning with x-ray computed tomography, followed by MRI and emission tomography. We conclude with a brief overview of projection radiography.
Computed Tomography
Excellent overviews of the history, theory, and basics of CT image formation are covered in texts and articles (21,22).
Briefly, CT measures the relative linear attenuation coefficient of each pixel (picture element) in the transverse imaging plane. A fan beam of x-rays passes through the patient, and the transmitted radiation is measured. Multiple projection views are acquired as the x-ray source system rotates around the patient. From these projections, image reconstruction algorithms generate an image matrix, typically 512 × 512 pixels, in which each pixel is a measure of μx, the linear attenuation coefficient (relative to water μw) at diagnostic x-ray energies. The pixel values are quantified in Hounsfield units (HU):
Briefly, CT measures the relative linear attenuation coefficient of each pixel (picture element) in the transverse imaging plane. A fan beam of x-rays passes through the patient, and the transmitted radiation is measured. Multiple projection views are acquired as the x-ray source system rotates around the patient. From these projections, image reconstruction algorithms generate an image matrix, typically 512 × 512 pixels, in which each pixel is a measure of μx, the linear attenuation coefficient (relative to water μw) at diagnostic x-ray energies. The pixel values are quantified in Hounsfield units (HU):
Table 2.1 Target and Normal Organ Volume Definitions | ||||||||||||||||||
|---|---|---|---|---|---|---|---|---|---|---|---|---|---|---|---|---|---|---|
|
The linear attenuation coefficient is a function of both electron density and atomic number of the tissue within a pixel. Tissue characterization to unfold the relative components of atomic composition and electron density can be achieved with dual energy scanning, although most radiotherapy planning scans are performed at a single x-ray tube potential. For a planning scan (typically 120 kVP), the HUs associated with various tissues and materials are as follows: air, -1000 HU; water, 0 HU; fat, approximately -100 HU; and bone variable up to 1000 HU. HUs of different tissues at diagnostic energies can be approximately extrapolated to electron density (23,24) values that are used for dose calculations.
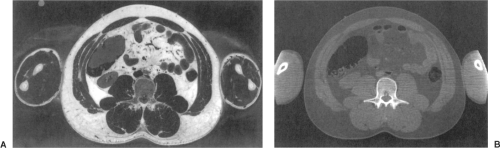 Figure 2.2. A: Photographic section of a human abdomen. B: The corresponding CT scan. Visible Human Project. |
The anatomic detail imaged with CT is compared with a photograph of the corresponding anatomy in Figure 2.2. The left image is a color photograph of the male pelvis, while the right image is the corresponding CT image (Visible Human Project of the National Library of Medicine) (25). Delineation of an organ (e.g., prostate) on CT may not precisely correspond to ground truth, defined as segmentation of the organs on the visible human cadaver photograph (18,26).
CT acquisition modes include step and shoot as well as helical mode. In step and shoot, a scan in the axial plane is acquired, the x-ray source is gated off, and the couch is advanced to the next longitudinal position. In helical mode, the couch is continuously advanced while the x-ray tube continuously rotates, leading to faster volumetric scan acquisitions. CT simulators currently use multislice detector rings (MDCT), which permit acquisition of multiple slices (from 4 to 64 slices) in one tube rotation. Tube rotation time is ∼0.5 second.
The spatial resolution of a CT image is quantified by the modulation transfer function and is a function of scanner geometry (focal spot size, detector size, field of view [FOV], slice thickness) and algorithm characteristics (27). Modern scanners with multiple detector rows can have isotropic submillimeter resolution. Contrast resolution is a measure of the ability to detect objects that have a small difference in HU from the background. CT is capable of detecting
and quantifying differences on the order of 0.5% relative to water. Image quality and its relation to scan parameters is reviewed by Judy (28) and Hu (29).
and quantifying differences on the order of 0.5% relative to water. Image quality and its relation to scan parameters is reviewed by Judy (28) and Hu (29).
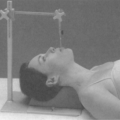
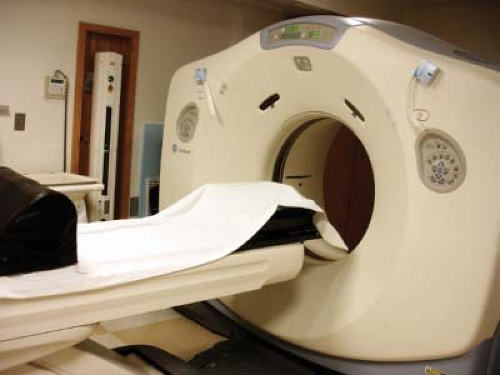 Figure 2.3. A CT simulator providing volumetric images of the gross tumor volume and normal tissues on a patient specific basis. A wide aperture facilitating scanning with immobilization accessories. |
CT Scan Acquisition for Treatment Planning
Scans are most frequently obtained for treatment planning in the radiation therapy department on a dedicated CT simulator as shown in Figure 2.3. Multidetector CT (MDCT) scanners with a wide bore (80 cm) are used for treatment planning scan acquisition because they accommodate treatment positioning accessories during scanning. MDCT scanning is three to five times faster depending on the number of detector rings (4,5,6,7,8,9,10,11,12,13,14,15,16,17,18,19,20,21,22,23,24,25,26,27,28,29,30,31,32,33,34,35,36,37,38,39,40,41,42,43,44,45,46,47,48,49,50,51,52,53,54,55,56,57,58,59,60,61,62,63,64). High-speed scanning can capture a bolus of contrast before dissipation, potentially reduces motion artifacts, and minimize issues related to x-ray tube heating.
The scan FOV is selected to permit visualization of the external skin contour, which is required for dose calculations. Longitudinal scan limits are chosen to capture the tumor extent and complete volume of organs at risk (for dose volume histogram analysis). Slice thickness of 3 mm and a total of 200 slices per scanning study (for a helical scan) are typical in planning scans. Convention dictates that cross-sectional images are displayed as viewed from below; for a patient in the supine position on the table, head first into the scan gantry, the image’s left is the patient’s right. Icons and alphanumeric information imprinted on the scan image provide details of pixel size, slice thickness, and radiographic parameters used during imaging.
Artifacts may degrade CT planning studies. Beam hardening causes streaks when the photon beam crosses particularly opaque regions, such as the bone in the posterior fossa of the brain, or metallic fillings in teeth (27). Physiologic motion can also cause streak artifacts. These artifacts perturb the calculation of radiographic path length. Such perturbations can affect an intensity-modulated fluence calculation or the calculated penetration of a charged particle beam.
Partial volume sampling is another imaging artifact present in transaxial scanning. Selection of slice thickness influences the detectability of small lesions if the dimensions are not well matched. Temporal aliasing can also result in artifacts (30).
Imaging Moving Anatomy
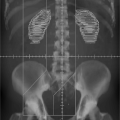
Respiratory motion artifacts during CT scans have been recognized for many years (31,32). A common observation in a thoracic CT scan of a patient breathing lightly during helical scanning is the presence of discontinuities at the diaphragm/lung interface. Figure 2.4 is an example of such an artifact, where the diaphragm/lung interface is unrealistically visualized due to motion.
These temporal aliasing artifacts have been studied in phantom and simulation (30,33) experiments to elucidate both their source and magnitude. In Figure 2.5, the first column is a photograph of test objects embedded in a foam block, scanned on a moving stage to simulate respiratory motion. Surface rendering of the scan with the phantom in a static state shows life-like realism, as seen in the second column. When the phantom is set into respiration-like motion and scans are acquired in conventional helical scan mode, the resulting images of the spherical objects are significantly distorted, as shown in the next three columns. If a sphere of 6 cm in diameter is imaged during motion with an amplitude of 1 cm (2 cm peak to peak), it may be observed with a longitudinal axis dimension of 4 cm, 2 cm smaller than its actual physical size. The distortion visualized is highly dependent on both scan and object motion parameters, as well as the respiratory phase at the instant the imaging planes intersects the test object (34), which is why the distortions can vary in magnitude. The presence of significant motion artifacts led investigators toward the development of imaging
algorithms that imaged object motion as a function of time or 4D imaging.
algorithms that imaged object motion as a function of time or 4D imaging.
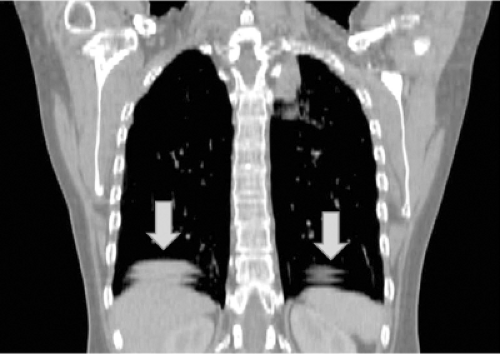 Figure 2.4. Artifacts from helical CT scanning during light breathing. Note discontinuities at the lung/diaphragm interface, indicated by blue arrows. |
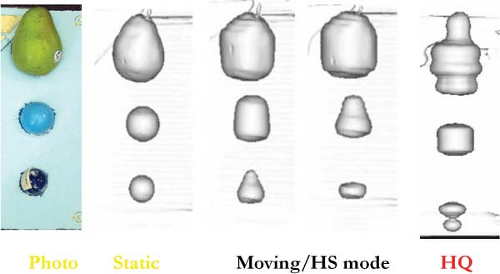 Figure 2.5. Images of phantom, surface renderings of the phantom during static and respiration simulated motion. Note the geometric distortions of the pear and spherical balls. These artifacts arise from temporal aliasing. HS, high speed mode; HQ, high quality mode. |
Four-dimensional CT Scanning
In its broadest sense, 4D scanning includes scans taken at very different time scales and technically includes 3D scans spaced weeks or months apart. 4D CT scanning in this chapter is defined as CT acquisition in the respiratory time scale. The objective of 4D CT scanning is to capture the shape and trajectory of moving organs during breathing. Proof of principle of 4D scanning was initially done on single-slice scanners (35,36,37) in 2003 and became commercially available shortly thereafter. Respiration-correlated CT uses either a surrogate signal, such as the motion of the abdominal surface, volume of air measured by spirometry, or internal anatomy, to provide a signal needed to re-sort the approximately 1,500 slices of reconstructed image data to coherent spatiotemporal CT data sets at specific instances of the respiratory phase. Scan times for a 4D CT scan with multidetector scanners are of the order of a few minutes, and the end result is typically 10 CT volumes, each with a temporal spacing of approximately one-tenth of the respiratory period (∼0.4 s). Details of the 4D CT acquisition methods are described elsewhere (38). Dose during a 4D CT scan is approximately five times that of a conventional treatment planning scan, but may be reduced by altering the radiographic technique without significant reduction of motion information (39,40).
A 4D CT scan provides an imaging method that quantifies and characterizes tumor and normal tissue shape and motion as a function of time. This enables the radiation planning team to design an aperture that adequately covers the internal target volume (ITV) (assuming respiration during treatment is reproducible to that during CT simulation). The 4D CT data can also be used to decide if a motion mitigation strategy is needed (e.g., gating).
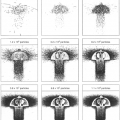
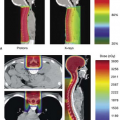
Figure 2.6 A and B show images from a 4D CT scan at two specific respiratory instants; the lung lesion is seen in extreme lateral positions, corresponding to inhale and exhale. In this patient, the tumor motion is lateral rather than craniocaudal. Figure 2.6 C shows the difference image, where dark and light areas identify the regions of greatest organ motion. Note that there is relatively little motion of the bony anatomy, and only a slight shift of the trachea between respiratory extremes. The value of 4D CT scan is that it provides a patient-specific estimate of organ trajectories, which can be used to customize treatment apertures and other parameters.
Related posts:
Stay updated, free articles. Join our Telegram channel

Full access? Get Clinical Tree


