Fig. 5.1
RCC and AML as visualized using gray-scale ultrasonography. (a) Isoechoic lesion relative to the renal parenchyma (arrows). This lesion was surgically resected and diagnosed as an RCC. (b) Markedly hyperechoic lesion with an anechoic rim (arrows) and intratumoral cysts. This lesion was surgically resected and diagnosed as an RCC. (c) Markedly hyperechoic lesion (arrows) with acoustic shadowing (arrow heads). This lesion was diagnosed as an AML based on unenhanced CT findings
Color Doppler or power Doppler US can be used to distinguish solid renal tumors from pseudotumors, allowing the possibility of renal pseudotumors including prominent column of Bertin, dromedary hump, and compensatory hypertrophy to be excluded [4] by depicting blood flow similar to that in normal renal parenchyma. Kitamura et al. reported that approximately 90% of clear cell RCCs as seen on CT were identifiable as hypervascular lesions on color Doppler US [14]. Power Doppler US is useful for describing the vascular distribution of renal tumors. Jinzaki et al. proposed a classification for the vascular distribution of renal tumors, classifying them into pattern 0 to pattern 4 [4] (Fig. 5.2). They found that RCC tended to exhibit a basket pattern (pattern 4), while AML tended to exhibit no signal or an intratumoral focal signal pattern (pattern 1); however, some overlap existed between the vascular patterns of RCC and benign lesions.
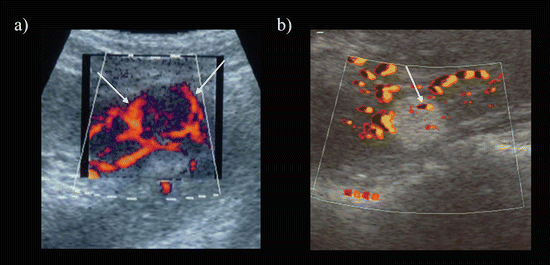

Fig. 5.2
RCC and AML as visualized using power Doppler ultrasonography. (a) Isoechoic lesion with a basket pattern (pattern 4, mixed penetrating and peripheral flow) (arrows). This lesion was diagnosed as an RCC. (b) Hyperechoic lesion with intratumoral focal signals (pattern 1) (arrow). This lesion was diagnosed as an AML
Contrast-enhanced ultrasonography (CEUS) can depict renal vessels and show enhancement using microbubbles, which do not affect renal function and have a minimal effect on allergic reactions. These agents, therefore, may be especially useful in patients with renal insufficiency or asthma. The sensitivity of US for the detection of renal tumors appears to be improved with the use of intravenous microbubble contrast agents; in one study, the sensitivity was 97%, while that for gray-scale US alone was 70% [17]. Contrast agents can be used to improve the characterization of complex renal cysts [18–21]. A strong enhancement of the vascularity in septations and mural nodules improves lesion classification [18]. Furthermore, positive enhancement on CEUS is useful for the detection of RCC in acquired cystic disease of the kidney, since the degree of enhancement of this disease is often low on dynamic CT [22]. However, US contrast agents are not covered by health insurance in many countries, including the USA and Japan.
5.2.2 Computed Tomography
Computed tomography is the gold standard for the detection and characterization of renal masses, as well as for RCC staging and preoperative planning. Multiphase CT scanning is considered to be the optimal technique [23–26]. There are two widely used protocols for multiphase CT scanning: a three-phase scan and a four-phase scan. A three-phase scan includes an unenhanced scan, a corticomedullary phase (CMP) scan, and a late nephrographic phase (late NP) scan, while a four-phase scan includes an unenhanced scan, a CMP scan, a NP scan, and an excretory phase (EP) scan (Fig. 5.3). An unenhanced scan is very important for the detection of fat attenuation for classic AMLs, small calcifications for RCCs, and hyperattenuation corresponding to a smooth muscle component in fat-poor AML or an intratumoral hemorrhage. An unenhanced scan must also be included as part of the baseline data when assessing the degree of enhancement. After the administration of contrast material at an injection rate of more than 3 mL/s, the optimal time until kidney imaging is approximately 30~40 s for the CMP scan, 90–120 s for the NP scan, 150–180 s for the late NP scan, and 180 s or more for the EP scan. The CMP is useful for assessing the renal vasculature anatomy, and enhancement seen during this phase can also be useful for characterizing lesions [27]. However, since the renal cortex, but not the renal medulla, is strongly enhanced during the CMP, hypovascular lesions located in the renal medulla may be missed, resulting in false-negative CMP findings [23–26]. The NP is the most sensitive for the detection of renal tumors, since both the renal cortex and the renal medulla are homogeneously enhanced. The EP is useful for imaging the collecting system and for detecting the obstruction or displacement of the renal pelvis.


Fig. 5.3
Multidetector CT images of four-phase scan. (a) Unenhanced CT image. (b) Corticomedullary phase image. This phase shows a densely enhanced cortex with minimal enhancement of the renal medulla. The renal artery (black arrow) and renal vein (white arrow) are well depicted. (c) Nephrographic phase image. The renal parenchyma is homogeneously enhanced. (d) Excretory phase image. The attenuation of the renal parenchyma has decreased progressively, and the collecting system shows contrast (arrow)
One advantage of CT over US and MRI is that quantitative evaluations are possible through the measurement of the CT attenuation value (Hounsfield units), which enables tumor components such as fat components, simple cystic components, and smooth muscle components to be defined using CT attenuation values. A fat component is defined as a region of less than −10 HU [28–30], a simple cyst as a region of 0~20 HU [31], and a smooth muscle component as a region of 40~50 HU [8] (Fig. 5.4). The degree of enhancement can also be quantitatively measured using the CT attenuation value. A change of 20 HU between unenhanced and enhanced scans is the threshold for determining enhancement, while a 10–20 HU change is considered an indeterminate finding and indicative of a need for other imaging modalities, such as MRI [32]. The degree of enhancement on the CMP and the enhancement pattern during multiphase CT are very important for the characterization of renal tumors or the determination of RCC subtypes. In fact, the three main subtypes of RCC, clear cell RCC, papillary RCC, and chromophobe RCC, show differing enhancement patterns [6].
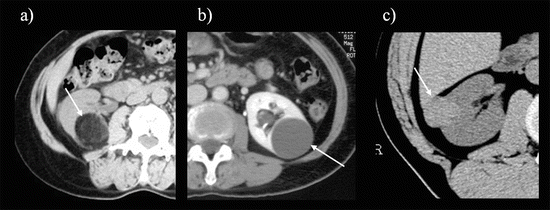

Fig. 5.4
Importance of unenhanced CT. (a) The lesion is less than −10 HU, corresponding to fat attenuation (arrow). (b) The lesion is between 0 and 20 HU, corresponding to water attenuation (arrow). (c) The lesion is hyperattenuating (40~50 HU), corresponding to a smooth muscle component (arrow)
Another advantage of CT over US and MRI is that the development of multidetector CT technology has enabled the acquisition of images with thinner slice thickness. As a result, two-dimensional (2D) multiplanar reformation images or three-dimensional (3D) post-processing images such as maximum intensity projection and volume rendering have become available using CT [33–35] (Fig. 5.5). These images are very useful for preoperative planning.
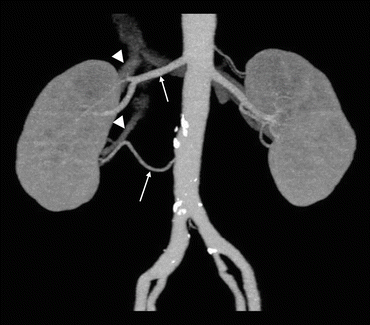

Fig. 5.5
Renal vasculature anatomy as assessed using CMP images. A maximum intensity projection image generated from CMP images shows two right renal arteries (arrows) and two right renal veins (arrowheads)
5.2.3 Magnetic Resonance Imaging
MRI is comparable to CT for RCC staging, for posttreatment follow-up, and for the evaluation of indeterminate renal masses [36]. It is the test of choice for patients with contrast allergies or those who are pregnant. Because of its lack of ionizing radiation exposure, MRI is also an attractive option for serial radiographic monitoring of patients with indeterminate renal masses or hereditary syndromes, such as tuberous sclerosis and von Hippel–Lindau disease [37, 38]. Similar to CT, MR imaging is performed before and after the administration of contrast material.
Before the administration of contrast material, T2-weighted imaging (T2WI) and T1-weighted imaging (T1WI), frequency-selective (FS) fat suppression imaging, and chemical-selective fat suppression imaging are usually performed. T2WI is useful for characterizing subcentimeter cysts, for detecting a low-intensity rim (corresponding to a pseudocapsule, which is a characteristic of RCC) [39] (Fig. 5.6), and for characterizing the muscle component of fat-poor AML as a low-intensity area [8]. Frequency-selective (FS) fat suppression generally indicates the presence of bulky fat cells, while chemical-selective fat suppression (in- and opposed-phase imaging) is used to detect rather small amounts of intracellular lipid or fat cells in the tumor [40, 41] (Fig. 5.7). A signal loss on opposed-phase images, compared with in-phase images, is seen when a small amount of fat is present, and this is often useful for the diagnosis of fat-poor AML [41].
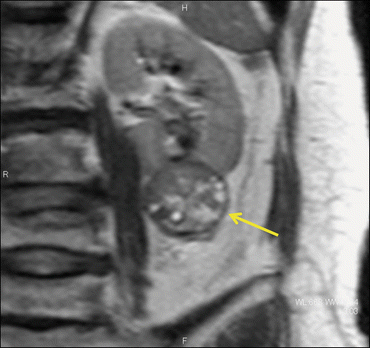
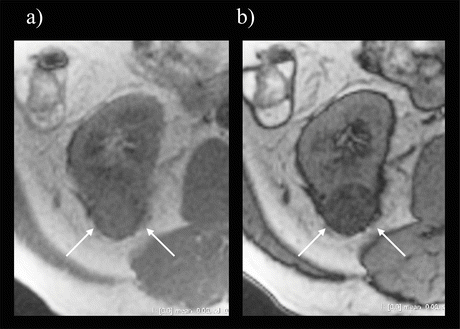

Fig. 5.6
RCC on a T2-weighted image. The low-intensity rim corresponds to a pseudocapsule (arrow)

Fig. 5.7
Clear cell RCC on chemical-selective fat suppression images. In-phase (a) and opposed-phase (b) images demonstrate dropout on the opposed-phase image, compatible with the presence of intracytoplasmic fat in clear cell RCC
After the administration of contrast material, T1WI with a fat-suppressed breath-hold sequence is obtained during several phases in both the axial and coronal planes [42, 43]. In patients with normal renal function, gadolinium-based MRI contrast agents do not appear to have substantial nephrotoxic effects [44]. Recently, nephrogenic systemic fibrosis (NSF) has been reported as an adverse effect specific to gadolinium contrast media in patients with compromised renal function [45–47]. NSF is a severe, usually progressive, and potentially fatal systemic fibrotic disease that affects the dermis, subcutaneous fasciae, and striated muscles. The prevailing theory regarding gadolinium and NSF is that gadolinium (Gd3+) ions are released from the Gd-chelate complex of MRI contrast agents and accumulate in tissues such as the skin, thereby initiating what some have described as a “toxic” reaction. Currently, NSF is considered to be correlated with the administration of relatively high doses (e.g., >0.2 mM/kg) and with agents in which gadolinium is least strongly chelated. Many guidelines recommend that gadolinium contrast agents should not be administered to patients with an estimated GFR <30 mL/min/1.73 m, who have recently received a liver or kidney transplant or who have hepatorenal syndrome [46, 48]. In general, MRI is sensitive to contrast enhancement and is better at detecting enhancement and characterizing solid or cystic lesions that are indeterminate on CT. However, the signal intensity in MRI is based on a relative scale, not an absolute quantitative scale such as HU for CT [43]. Therefore, the difference between pre-contrast and post-contrast MRI sequences is often used to determine the enhancement after contrast on MR images. A threshold of a 15% increase in signal intensity has also been advocated to identify enhancement in renal tumors [49, 50]. The identification of calcium in renal masses on MRI is limited because calcium appears as a signal void. The sensitivity for the detection of renal tumors is similar between MRI and CT, and both are more sensitive than that of ultrasound [32, 51].
5.3 Differential Diagnosis of Renal Tumors
RCC can have cystic growth patterns and solid growth patterns. The differential diagnosis of cystic renal tumors has been based on the Bosniak classification. This classification was first proposed in 1986 [52] and is now widely used to describe and manage cystic renal tumors. The differential diagnosis of solid renal tumors is often difficult, as the disease spectrum is quite wide. Before the mid-1990s, any solid renal tumor in which a fat component was not detected was considered to be an RCC. Thus, many benign tumors were misdiagnosed as RCC and, consequently, were unnecessarily resected [53]. Actually, a systemic review of 19 studies showed that the frequency of the surgical removal of benign renal masses because of suspicions of RCC was generally proportional to the lesion size and was approximately 20% for masses larger than 1 cm but smaller than 3 cm and 40.4% for masses smaller than 1 cm [54]. Over the last 20 years, many researchers have tried to establish additional diagnostic criteria for solid renal tumors, other than the detection of a fat component alone. Here, we review the diagnostic criteria of the Bosniak classification for cystic tumors and the most recently proposed diagnostic criteria for solid tumors.
5.3.1 Cystic Renal Tumors
Cystic RCC can be unilocular or multilocular, and RCC can develop within the wall of an otherwise benign cyst. The classification of complex renal cysts based on imaging was originally proposed by Bosniak in 1986 to help predict the likelihood of a cystic lesion being malignant [52]. This classification has since been modified. Bosniak originally proposed four categories; more recently, the classification was modified to include a fifth category [55] (Fig. 5.8). The diagnostic clues for the differential diagnosis of cystic renal tumors are CT attenuation on unenhanced CT, the existence of calcification, the number of septa, the irregularity and thickness of walls and septa, the enhancement of walls and septa, and the existence of a solid component.
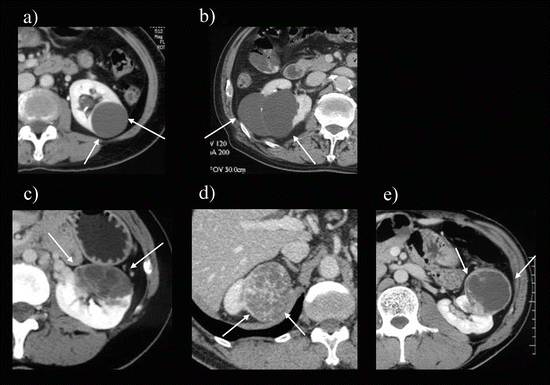

Fig. 5.8
CT images of Bosniak classifications. (a) Bosniak I: Thin-walled simple cyst (arrows) with homogenous low attenuation content. (b) Bosniak II: Cystic lesion with thin (<−1 mm) partially calcified internal septa (arrows). (c) Bosniak IIF: Slightly thicker wall cystic lesion with peripheral calcifications (arrows). (d) Bosniak III: Exophytic cystic renal lesion with multiple thick (>1 mm) enhancing septa (arrows). (e) Bosniak IV: Cystic renal lesion with a solid enhanced mural nodule (arrows)
Category I cysts are simple cysts with thin, noncalcified walls (Fig. 5.8a). These cysts contain simple serous fluid measuring less than 20 HU on CT images. Category II cysts are minimally complicated cysts with either high attenuation lesions (<3 cm) because of an increased protein content or hemorrhage or are multilocular with few septa (Fig. 5.8b) or thin peripheral calcifications. Category II cysts do not show enhancement after the injection of intravenous contrast material and are almost always benign. Category IIF cysts are complex lesions that have a high attenuation (>3 cm) or multiple septa or calcifications and a relatively benign appearance (Fig. 5.8c). Category III cysts are complicated cystic lesions that have some features suggesting malignancy that have multiple septa, thick or irregular rims, or heterogeneity suggesting necrosis (Fig. 5.8d). Category IV cysts contain solid, soft tissue-enhancing elements seen either within the cyst or as part of a complex cystic mass (Fig. 5.8e).
In general, Category I and II lesions are benign and so do not need further evaluation. Category IIF cysts have a less than 25% chance of malignancy and, therefore, may be followed to document stability over time [57, 58]. Concerning the intervals of follow-up examinations, it is recommended to perform the first follow-up after half a year and, if there is no change, to continue the examination annually at least for 5 years [58]. Category III cysts have an approximately 54–84% chance of a cystic RCC [56, 57]. Typically, these lesions are surgically explored. Category IV lesions are almost always cystic RCC and should be treated as such.
While one typically expects Bosniak III or IV lesions to represent cystic RCC, there are a number of benign cystic neoplasms that mimic this diagnosis. These include cystic nephroma (CN) and mixed epithelial and stromal tumor (MEST) of the kidney. In one series, 70% of 22 CN were characterized as Bosniak III lesions, and 70% of 10 MEST had enhanced solid elements [59]. These tumors are much more commonly seen in women or men receiving exogenous hormone treatment.
5.3.2 Solid Renal Tumors
Solid RCC can show an expansive growth pattern and an infiltrative growth pattern. Renal tumors with an infiltrative growth pattern are almost definitely malignant. On the other hand, the differential diagnosis of benign and malignant lesions is often challenging for renal tumors with an expansive growth pattern. The diagnostic clues for the differential diagnosis of solid renal tumors are CT attenuation on unenhanced CT images, the existence of calcification, the degree of enhancement on the CMP and the enhancement patterns during multiphase CT, the heterogeneity of the tumor, the signal intensity on T2WI images, and the presence or absence of cystic degeneration.
Renal tumors with an expansive growth pattern are well marginated but show various enhancements, depending on the tumor. The major subtypes of RCCs, such as clear cell RCC, papillary RCC, and chromophobe RCC, are included among renal tumors with an expansive growth pattern. This type of tumor also includes almost all benign tumors, such as AML, leiomyoma, or metanephric adenoma. For the diagnosis of renal tumors with an expansive growth pattern, there are three key criteria: the first criterion is that when fat attenuation (attenuations less than −10 HU) is detected in the tumor on an unenhanced CT image, the lesion is a classic AML [28–30, 62] (Fig. 5.9); the second criterion is that when the tumor exhibits marked heterogeneous enhancement almost equal to or greater than that in the renal cortex on the CMP of multiphase CT, the lesion is a clear cell RCC [6, 63] (Fig. 5.10); and the third criterion is that when the tumor appears as a hyperattenuated lesion (>45 HU) on an unenhanced CT image with homogeneous enhancement and T2W hypointensity, the lesion is a benign tumor, such as a fat-poor AML, leiomyoma, or metanephric adenoma [8–10] (Fig. 5.11). For the first criterion, AML with a fat component detectable on imaging is called classic AML. On US, classic AML is almost always markedly hyperechoic relative to the renal parenchyma [4, 5], but RCC can also be hyperechoic. Shadowing is a characteristic finding of AML on US, but this characteristic is only seen in 21–33% of AMLs [4, 5]. Thus, it is often difficult to diagnose a classic AML using US alone, and further CT examination is usually necessary. When evaluating AMLs with CT, the acquisition of thin (1.5–3 mm) sections and the use of attenuation measurements for small ROIs or even pixel values might be necessary to detect small amounts of fat [63, 64]. For the second criterion, no renal tumors other than clear cell RCC exhibit marked enhancement equal to or greater than that of the renal cortex during the CMP. Heterogeneity is caused by intratumoral hemorrhage or necrosis, which is frequently seen in clear cell RCC. For the third criterion, the findings of both hyperattenuation (>45 HU) on unenhanced CT and T2 hypointensity correspond to a smooth muscle component in fat-poor AML and leiomyoma and to psammomatous calcifications in metanephric adenoma [6, 8–10, 65].
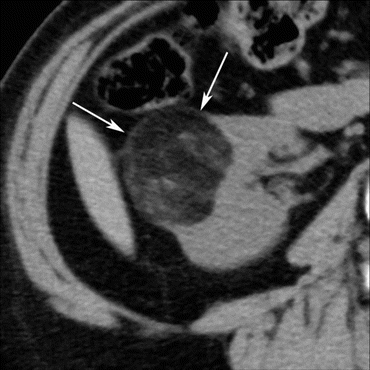


Fig. 5.9
Classic AML. A transverse, unenhanced CT image shows a right renal mass (arrows) with fat attenuation (−60 HU)

Fig. 5.10
Clear cell RCC. A transverse, unenhanced CT image (a) shows an isoattenuating mass. The mass shows a heterogeneously marked enhancement on enhanced CT during CMP (b) and rapid washout during late NP (c), while it appears hypointense on a transverse T2-weighted image (d)

Fig. 5.11
Fat-poor AML. A transverse, unenhanced CT image (a) shows a hyperattenuating (47 HU) mass (arrows). The mass appears as a homogeneous enhancement on enhanced CT during CMP (b) and late NP (c) and was hypointense on a transverse T2-weighted image (d)
Renal tumors with an infiltrative growth pattern are poorly marginated and show relatively decreased and heterogeneous enhancement [66] (Fig. 5.12). The renal contour is maintained, but the involved portion of the kidney is often enlarged. Rare subtypes of renal carcinomas such as collecting duct carcinoma, renal medullary carcinoma, type 2 papillary RCC, transitional cell carcinoma infiltrating the renal parenchyma, and sarcomatoid carcinoma are included in this type. It is often difficult to differentiate these diseases from each other, but most require active management, including surgery. Primary renal non-Hodgkin’s lymphoma (NHL) can also appear as either a focal mass or a lesion with an infiltrative appearance. Lymphoma is typically homogeneous, with less enhancement than the normal renal parenchyma, and is often present as multiple lesions [67]. This disease should be considered when splenomegaly or bulky retroperitoneal or mesenteric lymphadenopathy is present. Perinephric confluent tissue is more suggestive of NHL than RCC. Metastatic disease to the kidneys also appears as multiple, bilateral, poorly marginated solid lesions that can occasionally demonstrate an infiltrative pattern [68, 69]. Metastatic disease to the kidneys is particularly common with lung and breast carcinoma as well as melanoma. Metastases should be considered when infiltrative renal tumor is accompanied by nonrenal tumors. A biopsy should be considered to differentiate from RCC when other imaging findings are suggestive of lymphoma or metastases. It is important to recognize that some nonmalignant conditions can exhibit an infiltrating pattern with decreased enhancement on imaging. Acute pyelonephritis appears as wedge-shaped areas of decreased enhancement that extend from the papilla to the cortex. This appearance should be distinguished from tumor infiltration, especially in patients with a history of fever, flank pain, and pyuria.
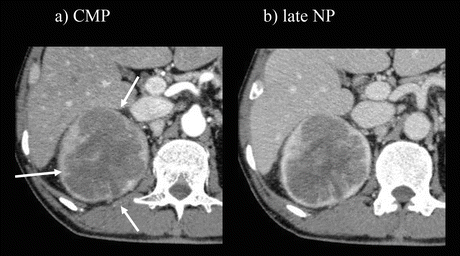

Fig. 5.12
Collecting duct carcinoma. The mass appears as an ill-defined infiltrative hypoenhancement on enhanced CT during CMP (a) and late NP (b)
5.4 Imaging Findings for RCCs and Benign Tumors
The representative classic subtypes of RCCs are clear cell type, chromophobe type, and papillary type, followed by collecting duct type, medullary carcinoma, and multilocular cystic type. Recently, new subtypes of RCCs have been proposed: the Xp11.2 translocation–TFE3 gene fusion type and the mucinous spindle and tubular type. The main benign tumors that need to be differentiated from RCCs are fat-poor AML, oncocytoma, and metanephric adenoma. Each of these tumors has characteristic findings, although there are still some overlaps among the findings for these tumors. The ability to identify the imaging features of each type is very important for the improved diagnosis of renal tumors.
5.4.1 Clear Cell RCC
Clear cell RCC, the most common type of RCC, originates from the proximal convoluted tubule and accounts for 70–80% of all RCCs. This tumor is seen in patients with von Hippel–Lindau (VHL) disease.
Clear cell RCCs typically show marked heterogeneous enhancement almost equal to that of the renal cortex during the CMP (more than 100 HU) and rapid washout during the NP or EP (80 HU) of multiphase CT (Fig. 5.10). The degree of enhancement is more avid than those of other RCC subtypes because of the deregulated angiogenesis of clear cell RCC (Fig. 4.2) [6, 7, 70]. Clear cell RCC also usually shows a heterogeneous enhancement because it is often accompanied by intratumoral hemorrhage or necrosis [6]. Cystic degeneration is also more common (15%) in the clear cell subtype than in the other subtypes irrespective of tumor size. On MRI, clear cell RCC is typically isointense on T1-weighted images and isointense to hyperintense on T2-weighted images, compared with the normal renal parenchyma (Fig. 4.13 ) [71, 72]. Clear cell RCC contains intracellular lipids in the tumor that cannot be detected on conventional fat suppression MR images but can be detected as a signal loss on chemical shift suppression images [72, 73]. This finding can help distinguish clear cell RCC from other RCC subtypes; however, this characteristic is also seen in fat-poor AML (isoattenuating type). The apparent diffusion coefficient calculated from diffusion-weighted images is reportedly lower among high-grade clear cell RCCs than among low-grade clear cell RCCs [74].
Clear cell RCCs tend to be more aggressive than other cell types, and they may directly involve and invade the renal collecting system [75]. Intratumoral necrosis and discontinuity of the capsule are correlated with higher-grade clear cell RCC [76]. Clear cell RCC may contain calcification, but less frequently than that seen in papillary and chromophobe subtypes [77]. Venous invasion is more commonly associated with clear cell RCCs [76].
5.4.2 Papillary RCC
Papillary RCC comprises 10–15% of all RCCs. An important feature of papillary RCC is that it is more commonly bilateral and multifocal than other RCC subtypes. Papillary RCC occurs in familial papillary RCC syndrome. Papillary RCC has a greater tendency to be of a lower stage and to have a better prognosis than clear cell RCC. There are two different histologic types of papillary RCC: those with small basophilic cells (type 1) and those with eosinophilic cells (type 2) [78]. Type 2 tumors have less distinct margins, are more heterogeneous, generally present at more advanced stages, frequently grow centripetally, and are associated with a poorer outcome [79].
Papillary RCC typically shows mild enhancement less than that of the adjacent cortex during the CMP (50–60 HU) and gradual enhancement during the NP or EP (65–75 HU) of multiphase CT (Fig. 5.13). Type 1 tumors are well marginated and exhibit homogeneous enhancement because they have lower frequencies of intratumoral necrosis and hemorrhage than clear cell RCC [6, 79, 80]. Type 2 tumors are poorly marginated and usually exhibit heterogeneous enhancement, but they can exhibit homogeneous enhancement when they are relatively small [79]. On MRI, papillary RCC can be visualized as a decreased signal intensity on T2-weighted images, compared with the normal renal parenchyma, possibly because of iron-containing hemosiderin, which can be found in the cytoplasm of tumor cells [71]. The imaging findings of type 1 papillary RCC are usually similar to those of metanephric adenoma [6], while the imaging findings of type 2 papillary RCC are similar to those of collecting duct carcinoma, spindle cell carcinoma, and urothelial carcinoma infiltrating the renal parenchyma.


Fig. 5.13
Papillary RCC. Transverse, unenhanced CT shows an isoattenuating mass on unenhanced CT (arrows) (a). The mass exhibits a homogeneous mild enhancement on enhanced CT during CMP (b) and gradual enhancement during late NP (c), while it was hypointense on a transverse T2-weighted image (d)
5.4.3 Chromophobe RCC
Chromophobe RCC accounts for only 5% of all RCCs. Chromophobe RCC and hybrid oncocytic/chromophobe tumors are associated with Birt–Hogg–Dubé syndrome.
Chromophobe RCC shows a moderate homogeneous enhancement during the CMP and washout during the NP and EP of multiphase CT (Fig. 5.14). The degree of enhancement during the CMP is intermediate between that of clear cell and papillary RCC [6, 81]. This tumor usually exhibits homogeneous enhancement. On MRI, chromophobe RCC is typically isointense on T1-weighted images and isointense to hyperintense on T2-weighted images, compared with normal renal parenchyma. However, this enhancement pattern is also seen in oncocytoma [6, 81]. Thus, differentiating between these two tumors is difficult. One study reported the presence of a spoke-like enhancement pattern with a central stellate form [82]. This pattern can be seen for both chromophobe RCC and oncocytoma and is, therefore, not specific for either tumor. Hale’s colloidal iron stain has been used to differentiate between the two pathologically.


Fig. 5.14
Chromophobe RCC. Transverse, unenhanced CT (a) shows an isoattenuating mass on unenhanced CT (arrows). The mass shows a homogeneously moderate enhancement on enhanced CT during CMP (b) and washout during late NP (c), while it was isointense on a transverse T2-weighted image (d)
5.4.4 Collecting Duct Carcinoma
Collecting duct (Bellini duct) carcinomas are uncommon, accounting for 1–2% of renal tumors. Collecting duct carcinoma is an aggressive tumor, with most patients presenting with high-stage disease.
Collecting duct RCC are usually located in the medullary portion or infiltrating the central sinus and have only rarely been reported in the renal cortex [83–85]. They exhibit an infiltrating growth pattern, rather than showing expansile growth, and preserve the reniform shape of the kidney (Fig. 5.12). They are commonly hypovascular with heterogeneous enhancement and may be difficult to differentiate from infiltrating urothelial carcinoma infiltrating the renal parenchyma and sarcomatoid variants of RCC [86]. They have variable signal intensities on T1-weighted images and typically have a low signal intensity on T2-weighted images [86, 87].
Metastases are more common at presentation than with other types of RCC, occurring in 35–40% of patients [84]. When bone metastases occur, they are frequently osteoblastic, unlike metastases from clear cell RCC, which are osteolytic.
5.4.5 Xp11.2 Translocation–TFE3 Gene Fusion Carcinoma
Xp11.2/TFE RCC is a rare subtype of RCC characterized by Xp11.2 chromosome translocations and fusion with the transcription factor E3 and is now accepted as a distinct entity according to the 2004 World Health Organization renal tumor classification [88]. It primarily affects children and adolescents. In the adult population, it is associated with a poor prognosis, presenting at an advanced stage and more frequently with lymph node metastasis [88, 89].
Xp11.2/TFE RCC appears as a heterogeneous mass that is frequently accompanied by cystic and necrotic portions. Calcification is frequently seen, especially in younger patients, and is often distributed within the marginal area of the tumor (eggshell calcification). The lesion appears as a hyperattenuation on unenhanced CT and exhibits moderate enhancement during the CMP and gradual enhancement during the NP and EP [90, 91] (Fig. 5.15). The gradual enhancement pattern is similar to that seen for papillary RCC. However, Xp11.2/TFE RCC appears as a hyperattenuation on unenhanced CT, unlike papillary RCC, and has a higher attenuation value during the CMP than papillary RCC. Cystic change, calcification, and lymph node metastasis are more frequent in Xp11.2/TFE RCCs than papillary RCC [91].


Fig. 5.15
Xp11.2 translocation–TFE3 gene fusion carcinoma. Transverse, unenhanced CT (a) shows a hyperattenuating (47 HU) mass (arrows). The mass exhibited heterogeneously moderate enhancement on enhanced CT during CMP (b) and persistent enhancement during late NP (c)
5.4.6 Mucinous Tubular and Spindle Cell Carcinoma
Mucinous tubular and spindle cell carcinoma (MTSCC) is a low-grade polymorphic epithelial carcinoma associated with a favorable prognosis.
MTSCC exhibits mild enhancement less than the adjacent cortex during the CMP (50–60 HU) and gradual enhancement during the NP or EP (65–75 HU) of multiphase CT, similar to findings for papillary RCC [92, 93]. Unlike papillary RCC, however, it shows an intermediate to high signal intensity on T2-weighted images corresponding to a mucinous component within the tumor [94]. An enhancement pattern similar to that of papillary RCC but with an intermediate- to high-intensity area on T2WI is suggestive of MTSCC.
5.4.7 Angiomyolipoma
Angiomyolipoma is typically a solid tumor composed of varying amounts of three elements: dysmorphic blood vessels, smooth muscle components, and mature adipose tissue. Once thought to be a hamartoma, AMLs are now considered to belong to the family of perivascular epithelioid cell tumors (PEComa) [62]. While 80% of AMLs are sporadic and most of them inconsequential, approximately 20% are associated with tuberous sclerosis complex (TSC).
Because most AMLs contain substantial amounts of adipose tissue, they are usually diagnosed using CT or MRI by identifying the imaging features of fat cells in the mass [28, 29]. Those that can be diagnosed using imaging have been called “classic AMLs” [28–30, 62] (Fig. 5.9). The presence of regions of attenuation less than −10 HU on unenhanced CT or frequency-selective (FS) fat suppression or chemical shift suppression on MRI enables fat to be identified with confidence [28–30, 40, 41]. Intratumoral hemorrhage can occur, particularly in tumors larger than 4 cm; the high attenuation of blood can mask fat, particularly if only a small amount is present, and lead to the misdiagnosis of a classic AML as RCC [95]. On ultrasound, a classic AML is almost always markedly hyperechoic relative to the renal parenchyma and is often as hyperechoic as renal sinus fat [4, 5]. Acoustic shadowing is a characteristic finding of AML but seen only in 21–33% of AMLs smaller than 3 cm [4, 5] (Fig. 5.1). Thus, a confident diagnosis of a classic AML requires the identification of fat using CT or MRI.
Some AMLs, however, have small amounts of fat that cannot be identified preoperatively using unenhanced CT (1.5–3 mm) and rich amounts of smooth muscle component [8]. These subtypes are now collectively referred to as “fat-poor AMLs,” which pathologically contain no more than 25% fat cells [96]. Fat-poor AMLs are divided into mainly two subtypes—hyperattenuating and isoattenuating AMLs—depending on the relationship of the amount of fat cells and their distribution in the mass. Hyperattenuating AMLs represent approximately 4.5% of all AMLs. These lesions are hyperattenuating relative to the renal parenchyma on unenhanced CT (usually more than 45 HU) and T2 hypointese, corresponding to smooth muscle components, and typically show homogeneous enhancement on CT [8, 62] (Fig. 5.11). Pathological examination generally reveals a fat cell content of only 4% (range, 3–10%) and a composition consisting mostly of a smooth muscle component [97]. Signal loss on fat-suppressed pulse sequences and chemical shift suppression are not observed. On ultrasound, they are usually homogeneously isoechoic, similar to smooth muscle components elsewhere [8, 62]. Because only 2% of RCCs show these findings, a percutaneous biopsy is recommended to avoid unnecessary surgery when encountering a renal mass that is hyperattenuating on unenhanced CT, T2 hypointense, and homogeneously enhancing [5, 6, 59, 60]. Isoattenuating AMLs show close attenuation to the renal parenchyma (−10 and 45 HU) on unenhanced CT and slightly hyperechogenicity on US [62]. This type of AML contains diffuse, scattered fat cells (theoretical fat cell content of 10–25%) among the smooth muscle component. Because there are more fat cells than hyperattenuating AMLs, isoattenuating AMLs typically show chemical shift suppression [62, 98]. At the same time, because of the predominance of the smooth muscle component, the lesion exhibits T2 hypointensity [62, 98]. Thus, T2 hypointensity in combination with the signal loss of opposed-phase imaging and homogeneous enhancement is suggestive of an isoattenuating AML, and a percutaneous biopsy is reasonable in such cases.
5.4.8 Oncocytoma
Oncocytoma is a common benign renal tumor that accounts for 9% of all renal cell neoplasms. Bilateral and/or multifocal oncocytomas, oncocytosis, and hybrid oncocytic/chromophobe tumors are associated with Birt–Hogg–Dubé syndrome.
Oncocytoma appears as a solid, well-circumscribed tumor with marked or moderate enhancement during CMP and washout during the NP and EP of multiphase CT (Fig. 5.16). The degree of enhancement during the CMP is intermediate between that of clear cell and chromophobe RCC [6, 7]. When the tumor is small in size, there is a homogeneous enhancement pattern with an absence of internal necrosis and hemorrhage [6, 101, 102]. Oncocytoma is typically hypointense to hyperintense on T1-weighted images and isointense to hyperintense on T2-weighted images [103]. When the tumor size is larger, oncocytomas often have a central stellate scar that appears as a low attenuation area during the CMP and an area with delayed enhancement during the NP or EP; such lesions have a low T1 signal and a high T2 signal when observed using MRI [72, 104] (Fig. 5.17). Although this feature is suggestive of oncocytoma, it is nonspecific and can been seen in both chromophobe and clear cell RCCs [101, 102]. Oncocytomas, therefore, present the greatest diagnostic challenge because of the overlap in their appearance with RCC. Recently, the appearance of segmental enhancement inversion during CMP and EP was reported to be a possible characteristic enhancement pattern of small renal oncocytoma when observed using multiphasic CT [105]. This finding consists of two distinct regions of enhancement in which the degree of enhancement reverses during the CMP and EP. The highly enhanced segments during the CMP develop a lower attenuation during the EP (corresponding to the tumor cells), while less-enhanced segments during the CMP develop a higher attenuation during the EP (corresponding to abundant hypocellular hyalinized stroma). Although chromophobe RCC also exhibits this finding, it seems to be more common in oncocytoma and may be helpful for differentiating small oncocytoma from RCC [106, 107].
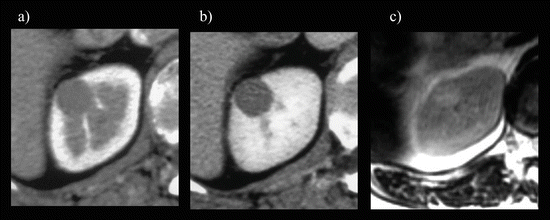
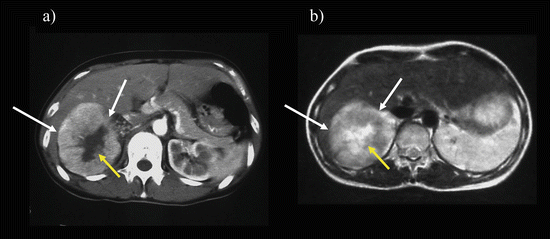

Fig. 5.16
Small oncocytoma. The mass appeared as a homogeneously moderate enhancement on enhanced CT during CMP (a) with washout during late NP (b), while it was hyperintense on a transverse T2-weighted image (c)

Fig. 5.17


Large oncocytoma with central stellate scar. A large right renal mass (arrows) with a central stellate-shaped scar (yellow arrow) appears as a low attenuation area on enhanced CT during CMP (a) and as a hyperintense area on a T2-weighted image (b)
Stay updated, free articles. Join our Telegram channel

Full access? Get Clinical Tree


