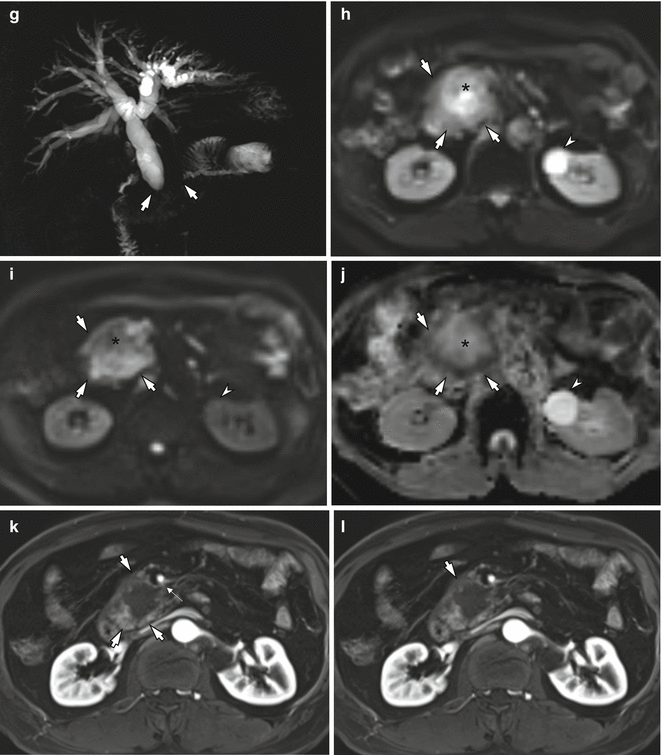
Fig. 7.1
A 69-year-old man with pancreatic head cancer. Pancreatic protocol MDCT and MRI examinations. (a–d) Pancreatic protocol MDCT examination composed of precontrast (a), early arterial (b), pancreatic (c), and portal venous phase (d) images. Note the pancreatic head tumor (arrows) shows central hypoenhancement with peripheral enhancement and also encases the superior mesenteric artery more than 180° (thin arrow). (e–l) Pancreatic protocol MRI examination. (e) Axial T2-weighted image shows the pancreatic head cancer (arrows) with heterogeneous hyperintensity due to central necrosis. (f) Axial fat-suppressed T1-weighted image shows a hypointense tumor (arrow) in the pancreatic head. (g) MR cholangiopancreatography shows strictures (arrows) of the main pancreatic duct and the common bile duct (double-duct sign +) with upstream ductal dilation. (h) Low b-value (b = 0) diffusion-weighted image shows the pancreatic head cancer (arrows) with heterogeneous hyperintensity due to central necrosis (asterisk) similar to T2-weighted image (e). (i) High b-value (b = 1,000) diffusion-weighted image demonstrates that the central portion of the pancreatic head cancer with central necrosis (asterisk) shows hypointensity, whereas the peripheral portion of the tumor with tumor cell infiltrations (arrows) shows hyperintensity due to restricted diffusion. (j) ADC map also demonstrates that the central portion of the tumor shows high ADC value which represent free diffusion, while the peripheral portion shows low ADC value representing restricted diffusion. Note a left renal cyst shows hyperintensity on low b-value (h), hypointensity on high b-value diffusion-weighted images (i), and hyperintensity on ADC map, representing free diffusion of the water. (j, k) Contrast-enhanced T1-weighted image obtained during pancreatic (j) and portal venous phases (k) shows a hypovascular tumor in the pancreatic head with peripheral enhancement and encasement of the superior mesenteric artery (thin arrow)
Table 7.1
Minimum technical specifications for pancreatic CT
Feature | Specification | Comment |
|---|---|---|
Scanner type | Multidetector-row scanner | |
Detector type | Minimum of 16 detector rows | Higher than 64 detector rows is preferable |
Detector configuration | Preferably submillimeter (0.5~ <1 mm) | |
Section thickness and interval | Minimum of 5 mm ST and RI | A slice thickness of 2.5–3.0 mm and a reconstruction interval of 1.5–2 mm is preferable |
Oral contrast agent | Neural or low-Hounsfield unit oral agent | |
Injector | Power injector, preferably dual chamber | Bolus tracking desirable |
Contrast medium dose and injection rate | No less than 3 mL/s of contrast, 300 mg I/mL or a higher concentration, for an iodine dose of 550 mgI/kg of body weight | A saline flush desirable |
Mandatory dynamic phases | 1. Early arterial phasea | The split-bolus CT protocol can be used to reduced radiation doseb |
2. Pancreatic phase | ||
3. Portal venous phase | ||
Reformatted images | Coronal and sagittal MPR | |
Curved MPR along the pancreatic duct | ||
Maximum intensity projection for CT angiography | ||
Minimum intensity projections are helpful for ductal structures |
Another recent development has been the use of a variety of types of reformations to enhance the conspicuity of tumor and its relationship to local structures [54]. For pancreatic cancer staging, the smallest available section thickness or detector configuration should be used to enable the production of high-fidelity reformatted and volumetric images from the nearly isotropic voxel acquisition [4, 49]. The most commonly used techniques are multiplanar reformations (MPR), curved multiplanar reformations (CMPR), and minimum intensity projections (MinIP) [49, 55] (Fig. 7.2). The use of CMPR reconstruction drawn along the common bile duct, pancreatic duct, and/or mesenteric vessels may help improve sensitivity for detection of pancreatic cancer and the speed of interpretation over axial images alone by demonstrating the relationship between tumors and the pancreatic duct or adjacent major structures [56]. MinIP images use the lowest density values along each ray and clearly show low-density structures such as pancreatic and bile ducts. The recommended MinIP slab thickness is 3 mm for the pancreatic duct [49, 50, 57]. Maximum intensity projections (MIP) are also often used to evaluate the relationship between tumors and adjacent, enhanced vessels.
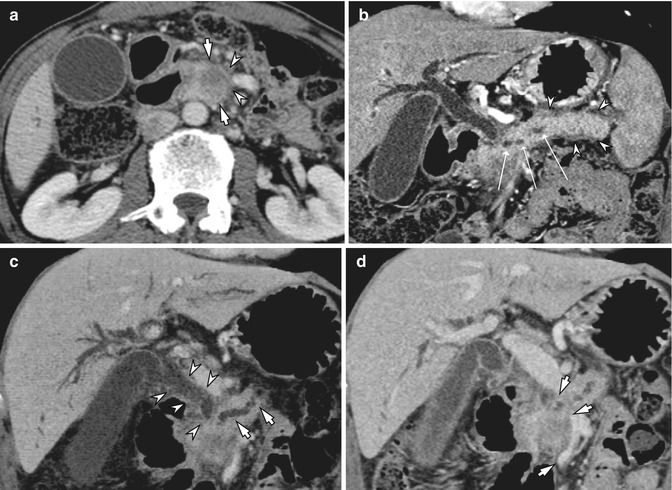

Fig. 7.2
Post-process of MDCT for pancreatic head cancer. (a) Approximately 2.5 cm, ill-defined hypovascular mass is seen in the pancreatic head (arrow), and the fat plane (arrowheads) between the mass and the superior mesenteric vein is not clearly depicted at CT. (b) Curved multiplanar reformation image along the pancreatic duct shows and demonstrates dilated upstream pancreatic duct (open arrows) and parenchymal swelling with peripancreatic fat infiltration (arrowheads) due to combined acute pancreatitis. (c) Oblique coronal minimum intensity projection image shows the dilated bile duct (arrowheads) and the pancreatic duct (arrows), which are suggestive of pancreatic head cancer invading intrapancreatic segment of the common bile duct. (d) On oblique coronal multiplanar reformation image, the main portal vein and proximal superior mesenteric vein show luminal narrowing (arrows) over 3.5 cm due to tumor involvement, and splenic vein is not opacified (not shown)
Although MDCT shows excellent performance regarding its diagnosis and staging, the detection of small pancreatic cancers <2 cm in diameter, or of isoattenuating tumors, which account for approximately 10% of all pancreatic adenocarcinomas, still remains challenging [58, 59]. For those cases, we can improve the contrast-to-noise ratio between pancreatic cancer and normal parenchyma using the dual-energy or low-tube-voltage techniques [60], as the X-ray absorption of iodine can be increased at low tube voltage (80 kVp) compared with a standard tube voltage (120 kVp) [60–64]. The downside of low-tube-voltage technique is increased image noise, but this could be reduced by iterative reconstruction (IR) algorithms [65]. Considering the effects of IR techniques on reducing image noise, these techniques could be used for high spatial resolution, pancreatic CT imaging which may provide high quality, 1–2 mm, thin-slice CT images. Optimizing the IR technique using a study protocol is necessary to balance imaging distortion and radiation reduction and to balance image quality and high spatial resolution along the z-axis.
7.2.2 Magnetic Resonance Imaging
MRI is frequently used as a problem-solving tool for the evaluation of pancreatic diseases, based on CT or sonographic findings. MRI has relatively high spatial and temporal resolution without exposure to ionizing radiation. Of recent advances in MRI including increased magnetic strength, improved coil technology, and advanced imaging sequences, the most significant is the increasing magnetic field strength resulting in increased signal-to-noise ratio, and commonly used scanners in clinical practice are 1.5 T or 3.0 T [66]. In addition, with development of diffusion-weighted imaging (DWI) and rapid 3D T1-weighted gradient-echo (GRE) sequences, MR is able to offer improved ability to identify and stage pancreatic tumors. In addition, MR cholangiopancreatography (MRCP) can be used to visualize the pancreatic and biliary ductal system. According to a recent study, dynamic MRI with MRCP and a three-dimensional T1-weighted sequence showed superior tumor conspicuity and similar diagnostic performance compared with MDCT in evaluating the resectability of pancreatic cancer [67].
For comprehensive evaluation of the pancreatic parenchyma and the pancreaticobiliary ductal system, obtaining the following MR sequences is recommended [68]: T1-weighted in-phase and opposed-phase GRE; T2-weighted axial and coronal sequences, usually turbo spin echo (TSE) or single-shot fast spin echo (SSFSE); two-dimensional (2D) and three-dimensional (3D) MRCP; and fat-suppressed T1-weighted 3D gradient echo (GRE) before and after intravenous administration of gadolinium (Fig. 7.1). Diffusion-weighted imaging (DWI) is currently becoming an increasingly used, optional sequence for the detection and characterization of pancreatic lesions including cancer and inflammation [69]. T2-weighted images are useful for evaluating the pancreatic duct, fluid collections or necrosis in the pancreas or tumor, or cystic neoplasms such as intraductal papillary mucinous neoplasm (IPMN). T1-weighted dual-echo GRE sequence (3D two-point Dixon techniques) or multi-echo GRE sequence (three-point Dixon techniques) can estimate by assessing the signal loss on opposed-phase images compared with in-phase images, and recent three-point Dixon techniques may provide more precise estimation of pancreatic fat component by correcting for T2* decay by using the data from a third echo. On unenhanced fat-suppressed T1-weighted images, the pancreas is hyperintense relative to other abdominal organs. Focal pancreatic masses are best identified and evaluated using a combination of unenhanced and early gadolinium-enhanced T1-weighted sequences [66]. MRCP uses heavily T2-weighted sequences to evaluate the pancreatic duct and biliary tract and is regarded as being essential in evaluating for the presence of ductal communication with cystic lesions of the pancreas and ductal deformity caused by pancreatic cancer [66, 67, 70]. DWI can detect random water motion within cellular tissues and, therefore, may represent tissue cellularity and produces a representative apparent diffusion coefficient (ADC) value [71] (Fig. 7.1). Therefore, pancreatic cancers show increased signal on both low b-value and high b-value images and low ADC values due to restricted water motion, whereas cystic lesions show high signal intensity on low b-value images, lower signal intensity on high b-value images, and high ADC values because of the increased motion of water [66]. Therefore, DWI may allow better depiction of pancreatic neoplasms as well as detection of liver and lymph node metastases, which are not always apparent on other sequences [66, 72, 73] (Fig. 7.3).
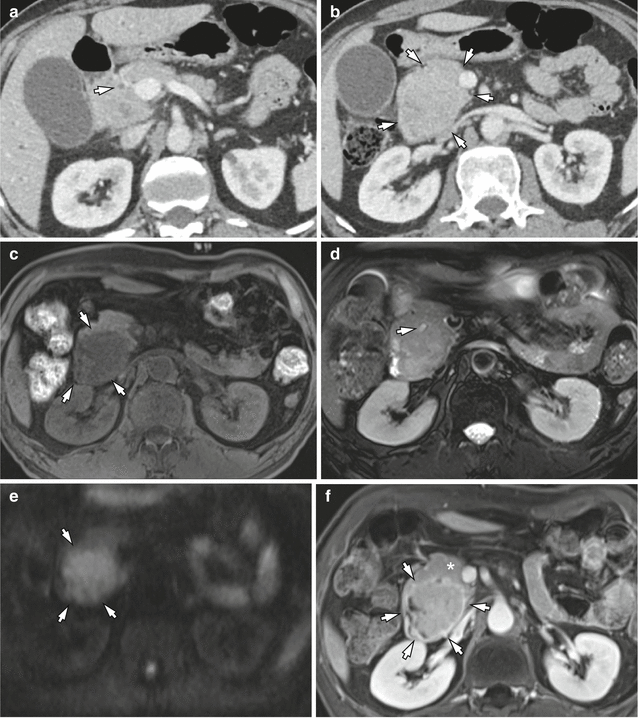
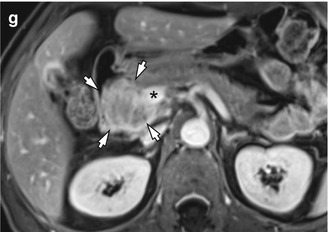


Fig. 7.3
CT and MRI of a 61-year-old man who presented with jaundice and weight loss. (a) Abrupt narrowing of intrapancreatic common bile duct (arrow) is shown, whereas pancreatic ductal dilatation is not seen on late arterial phase at MDCT. (b) Diffuse pancreatic head swelling is observed on portal venous phase (arrows) which may be a pancreatic cancer, but tumor contour is not clearly differentiated from the background parenchyma at CT. (c) Unenhanced T1-weighted image using a fat-suppressed 3D gradient-echo sequence shows a hypointense tumor (arrows) in the pancreatic head. Note the pancreatic parenchyma shows hypointensity on fat-suppressed T1-weighted image. (d) Axial T2-weighted image shows the distal common bile duct (arrow) which is displaced by a vaguely defined, slightly hyperintense solid tumor. (e) Diffusion-weighted image (b = 800) shows a hyperintense solid tumor (arrows) in the head of the pancreas which is more clearly distinguished from the background parenchyma than T2-weighted image. (f) Contrast-enhanced T1-weighted image during portal phase shows approximately 4.8 cm tumor (white asterisk) in the pancreatic head which is clearly distinguished from the background parenchyma by a peripheral enhancing rim. (g) MR image at a lower level shows that the tumor (arrows) abuts the main portal vein (asterisk)
At the author’s institute, 2D thick-slab MRCP and 3D multislice MRCP sequences were used to evaluate the biliary and pancreatic ductal anatomy. 2D MRCP images provide a good information of gross anatomy, and 3D MRCP images can offer good demonstration of ductal anatomy as well as intraluminal abnormalities. However, image quality of 3D MRCP in patients with irregular breathing rhythm or in uncooperative patients could be subdiagnostic range [74]. Unenhanced T1-weighted images and dynamic images were obtained using fat-suppressed, 3D GRE sequences, i.e., LAVA [liver acquisition with volume acceleration] (GE Medical Systems) and VIBE [volume interpolation with breath-hold examination] (Siemens Medical Solutions) and mDIXON (Philips Medical Solutions) before and following the administration of gadolinium-based contrast agents at a dose of 0.1 mmol per kilogram of body weight and with an injection rate of 2 mL/s (injection duration approximately 5–8 s). The arterial phase images were obtained 5 s after the gadolinium-containing bolus was detected in the abdominal aorta. Acquisition of 3D GRE data for each phase was completed during a single breath hold at the end of expiration (mean time, 20 s; range, 18–21 s). Arterial, portal venous, and equilibrium phase images were obtained approximately 20–40 s, 45–65 s, and 3–5 min, respectively, after injection of the contrast agent. An additional, fat-suppressed 3D GRE sequence was performed 2 min after the contrast-agent injection (between the portal venous phase and the equilibrium phase) on the coronal plane and parallel to the portal vein bifurcation [75, 76]. Recently, gadoxetic acid-enhanced liver MR imaging and DWI are more widely accepted as one of the best imaging tools for detecting liver metastasis in patients with pancreatic cancer. The reported sensitivity of gadoxetic acid-enhanced liver MR is 85% for detecting liver metastasis in pancreatic cancer, which is significantly higher compared with that of CT which is 69% [77]. The minimum technical specifications for MRI of the pancreas are summarized in Table 7.2.
Table 7.2
Minimum technical specifications for pancreatic protocol MRI
Feature | Specification | Comment |
|---|---|---|
Scanner type | 1.5 T or 3.0 T main magnetic field | Low-field magnets not suitable |
Coil type | Phased-array, multichannel torso coil | Unless patient-related factors preclude the use |
Gradient type | Current-generation, high-speed gradients (providing sufficient coverage of upper abdomen) | |
Slice thickness | 5 mm or less for dynamic series | 2–3 mm ST is preferable with 3D T1w-GRE sequence |
8 mm or less for other imaging | ||
Breath holding and matrix | Approximately 20 s of breath hold with a minimum matrix of 128–160 × 256 | Breath-hold instructions are very important |
Injector | Power injector, preferably dual chamber | Bolus tracking/MR fluoroscopy desirable |
Contrast injection rate | 1.5–2 mL/s of gadolinium chelate | Preferably resulting in the vendor-recommended total dose |
Minimum sequences | T1-weighted, gradient echo (3D preferable) | DWI can provide high contrast of pancreatic tumors and is also valuable for detection of liver metastases |
T2-weighted, turbo spin echo (axial, coronal) | ||
MRCP (both 2D and 3D preferable), DWI | ||
Post-Gd, T1-weighted gradient echo | ||
Mandatory dynamic phases | 1. Arterial | 3D fat-suppressed GRE sequence |
2. Portal venous phase | ||
3. Equilibrium phase | ||
Dynamic timing | Arterial: 20–40 s | |
Portal venous: 45–65 s | ||
Equilibrium: 3–5 min after contrast injection |
7.3 Typical Imaging Features of Pancreatic Cancer
7.3.1 Morphologic Evaluation
On CT, pancreatic adenocarcinomas most often present as ill-defined, solid hypoattenuating masses compared to normal pancreatic parenchyma [78] (Figs. 7.1 and 7.4). However, approximately 5.4–10% of pancreatic adenocarcinomas are isoattenuating relative to the background pancreatic parenchyma [58, 79], especially in small tumors 2 cm or less [59], thus making diagnosis more difficult. In these situations, indirect (secondary) signs such as upstream pancreatic duct dilation or the double-duct sign caused by pancreatic and common bile duct obstruction are helpful for the diagnosis [59, 78]. In addition, other secondary signs of pancreatic cancer include focal pancreatic enlargement, extension of tumor beyond pancreas, and upstream pancreatic atrophy secondary to ductal obstruction [54]. As the tumor reaches into its advanced stage, it typically infiltrates the peripancreatic structures and involves adjacent vasculature such as celiac artery, superior mesenteric artery, portal vein or superior mesenteric vein, and in some cases adjacent organs. Approximately 88% and 100% of the isoattenuating adenocarcinomas <20 mm and >20 mm, respectively, are recognized only by the presence of secondary imaging findings highly suggestive of malignancy [80]. Pancreatic cancers can occasionally appear to be cystic or necrotic, and in rare cases they can contain calcium [81].
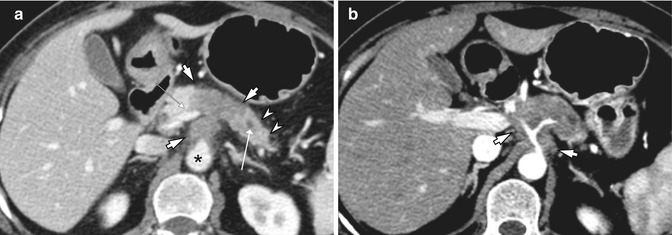

Fig. 7.4
A 58-year-old woman with cancer of the pancreatic body. (a) At MDCT, Approximately 4.1 cm hypovascular soft tissue mass is seen in the pancreatic body and tail (arrows) which extends to the aorta (asterisk) and main portal vein (small arrow). Upstream pancreatic duct is dilated (open arrow) and the parenchyma is atrophied (arrowheads). (b) Soft tissue density tumor encases the celiac trunk and the proximal common hepatic artery (arrows) on arterial phase, which often hampers curative resection of the pancreatic body cancer
On MRI, pancreatic cancer typically shows the appearance of an ill-defined solid hypointense mass on fat-suppressed, T1-weighted imaging and on pancreatic parenchymal phase, dynamically enhanced, fat-suppressed, T1-weighted sequences and shows progressive delayed enhancement [54] (Figs. 7.1 and 7.3). Pancreatic cancers are best detected using unenhanced and early gadolinium-enhanced fat-suppressed T1-weighted images [66]. However, the relative signal intensity of the pancreatic cancer in comparison with pancreatic parenchyma on unenhanced fat-suppressed T1-weighted images can differ depending on the location of pancreatic tumor. If the mass is located within the pancreatic head, there can sometimes be loss of the normal high T1 signal of the pancreatic body and tail secondary to obstruction of the main pancreatic duct, leading to inflammation, fibrosis, and atrophy. In this situation, the early contrast-enhanced images may show a hypoenhancing mass with peripheral rim enhancement superimposed on a background of slightly greater enhancing pancreatic parenchyma [66]. If the pancreatic cancer is located within the pancreatic tail, it is usually well shown on the unenhanced fat-suppressed T1-weighted images. In addition, pancreatic cancers have a variable appearance on T2-weighted images. Pancreatic cancers frequently show increased signal on high b-value DWI and relatively low ADC values, because of fibrosis associated with the tumor [69, 73, 82] (Fig. 7.1). In addition, DWI is also valuable for detecting liver and lymph node metastases, as DWI can provide higher contrast than other imaging sequences. However, both benign and malignant lymph nodes can show restricted diffusion; overstaging for lymph node metastases should be avoided by knowing that not every lymph node seen on DWI is malignant [69]. Peritoneal metastases are usually best shown on the delayed postgadolinium images but can also be detected on DWI [83, 84].
7.3.2 Vascular Evaluation
Pancreatic cancer is a very aggressive malignant neoplasm with a high mortality rate, and adequate determination of the extent of the tumor on cross-sectional imaging studies at the time of staging is one of the most important steps in optimal patient management [4]. Pancreatic cancer staging is based on the determination of tumor size, location within the pancreas, local extent which may involve surrounding vessels, and the presence of metastatic disease. In the absence of distant metastasis, the presence of degree of contact between the tumor and the peripancreatic vessels is of paramount importance in determining surgical resectability. In addition, it is important to recognize variants of vascular anatomy such as celiac and mesenteric arterial variants and variants of SMV-PV in the preoperative planning of extended pancreatic resection [22] (Table 7.3).
Table 7.3
Essential imaging features for evaluation of pancreatic cancer
Parameter | Findings | Comment |
|---|---|---|
Morphologic features | ||
1. Main tumor | ||
Relative enhancement of tumor | Hypo-, iso-, or hyperenhancing | Preferably determine in pancreatic phase |
Size of tumor | Measurable or nonmeasurable | Maximum axial dimension in centimeter |
Location of tumor | Head/uncinate process or body/tail | SMV is a landmark to divide tumor location |
2. Secondary findings | ||
Pancreatic duct | Narrowing or abrupt cutoff (±) | Measuring MPD diameter (> 2 mm) |
Upstream dilation (±) | ||
Bile duct | Narrowing or abrupt cutoff (±) | |
Upstream dilation (±) | ||
Proximal parenchymal atrophy | Present or absent | |
Peripancreatic stranding | Present or absent | |
Vascular evaluation | ||
1. Arterial evaluation | ||
Mandatory vessels to evaluate | SMA, celiac axis, CHA | Accessory RHA, replaced RHA, replaced CHA, others |
Arterial variant | ||
Degree of solid soft tissue contact | Present or absent or occlusion | Abutment: ≤ 180° |
If present, ≤ 180° or > 180° | Encasement: > 180° | |
Degree of increased hazy attenuation or stranding contact | Present or absent | |
If present, ≤ 180° or > 180° | ||
Focal vessel narrowing or contour irregularity | Present or absent | |
2. Venous evaluation | ||
Mandatory vessels to evaluate | MPV, SMV | |
Degree of solid soft tissue contact | Present or absent or occlusion | Abutment: ≤ 180° Encasement: > 180° |
If present, ≤ 180° or > 180° | ||
Degree of increased hazy attenuation or stranding contact | Present or absent | |
If present, ≤ 180° or > 180° | ||
Focal vessel narrowing or contour irregularity | Present or absent
Stay updated, free articles. Join our Telegram channel
Full access? Get Clinical Tree
 Get Clinical Tree app for offline access

| |

