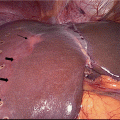
Ultrasound
CT
MRI
Angiography
– Hepatomegaly (early)
– Irregular contour
– Right lobe and medial left lobe atrophy; lateral left lobe and caudate lobe enlargement
– Coarsened echotexture
– Arteriovenous shunts
– Hepatic arteries: increased or decreased resistive index; dilation and tortuosity
– Portal veins: slow flow, stagnancy, or hepatofugal flow
– Hepatic veins: loss of phasicity
– Splenomegaly
– Ascites
– Portovenous collaterals
– Hepatomegaly (early)
– Irregular contour
– Right lobe and medial left lobe atrophy; lateral left lobe and caudate lobe enlargement
– RN/SN/fibrosis
– Arteriovenous shunts
– Splenomegaly
– Ascites
– Hepatomegaly (early)
– Irregular contour
– Right lobe and medial left lobe atrophy; lateral left lobe and caudate lobe enlargement
– RN/SN/fibrosis
– Arteriovenous shunts
– Splenomegaly
– Ascites
– Early: mildly stretched hepatic arteries
– Advanced: tortuosity and “corkscrew” appearance of arteries with sudden loss in caliber; arteriovenous shunts
– Portosystemic collaterals
– Hepatofugal flow
On US examination, the liver contour may appear nodular with coarse echotexture. Flow dynamics of the hepatic vasculature may also be altered. These alterations are evaluated with Doppler sonography. In the hepatic artery, the resistive index is either increased due to compression by cirrhotic liver parenchyma, or decreased due to spontaneous arteriovenous shunt formation. The latter is more specific for cirrhosis [10]. Changes also occur in the portal flow in the setting of portal hypertension (see the next section). The portal flow slows down (velocity less than 15 cm/sec), becomes stagnant, or is reversed; this reversal is termed “hepatofugal flow” [23]. Finally, the hepatic venous circulation loses its phasicity and ceases to reflect right atrial pressure changes [10].
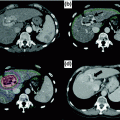
On CT imaging (Fig. 2.1), the cirrhotic liver appears enlarged in the early stages and shrunken in severe cirrhosis. As cirrhosis advances, the liver margins appear nodular, and the organ becomes diffusely heterogeneous because of the fibrotic changes in its parenchyma [24]. Regenerative nodules are difficult to see on non-contrast CT, unless they contain iron (siderotic nodules) which makes them hyperdense relative to the surrounding parenchyma. Enhanced CT may or may not reveal RNs since they do not typically enhance in the arterial phase [25]. Arterioportal shunts are often seen after contrast administration. They typically have a linear or wedge-shaped appearance and are subcapsular in location with no visible mass effect [26].
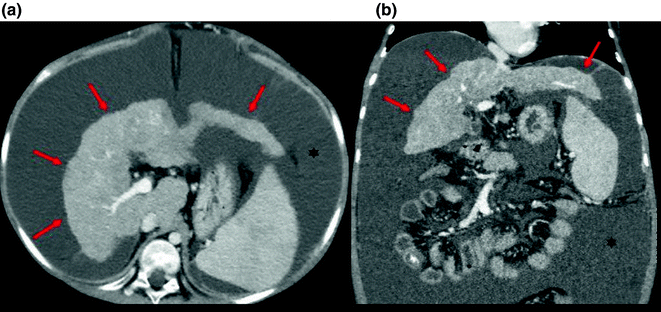

Fig. 2.1
Gross changes of liver cirrhosis seen on an axial (a) and coronal (b) images from an enhanced CT scan. The liver is shrunken with an irregular nodular contour (arrows) and surrounding ascitic fluid (asterisks)
Findings on MRI (Fig. 2.2) are similar to those of CT. Additionally, fibrosis is of high signal on T2W imaging [24], and RNs have a non-specific appearance on T1W and T2W images, but sometimes contain lipid or iron. The iron-containing (siderotic) nodules show low signal on both T1W and T2W images [27].
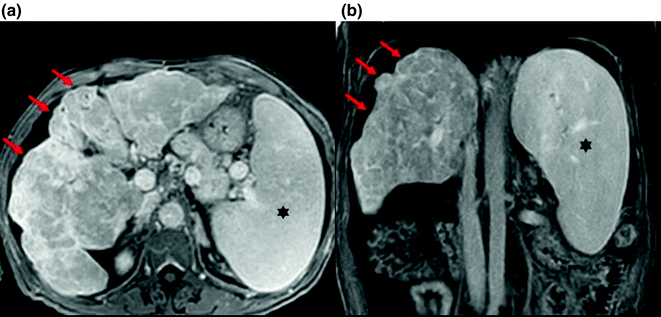

Fig. 2.2
Gross changes of liver cirrhosis seen on axial (a) and coronal (b) images from MR with gadolinium. The liver shows an irregular nodular contour (arrows). There is also splenomegaly secondary to portal hypertension (asterisks)
2.3.2 Imaging of the Effects of Portal Hypertension
The normal portal pressure measures between 4 and 11 mmHg [5]. PH is responsible for many extrahepatic manifestations of cirrhosis. It leads to splenomegaly (Fig. 2.2) with or without small nodular iron deposits within the spleen (Gamna-Gandy bodies). These deposits are related to foci of chronic hemorrhage in longstanding portal hypertension and are readily seen on MRI as foci of susceptibility artifact on GRE imaging [28]. The most specific finding of PH is the development of collateral portal venous anastomoses (varices) (Fig. 2.3). These occur in the gastroesophageal, perirectal, and retroperitoneal, with recanalization of the paraumbilical vein. When these varices develop, it is usually an indicator that the portal vein pressure exceeds 12 mm Hg. They may bleed, and the bleeding can be life-threatening. Noninvasive diagnostic imaging methods, such as color flow Doppler US, contrast-enhanced CT, and MRI can be used to identify collaterals. The major limitation of all imaging modalities is the inability to measure variceal pressure, which correlates directly with the risk of hemorrhage. Portal vein flow is altered by PH and may become stagnant. This stagnancy increases the risk of portal vein thrombosis. It is important to note that long-standing thrombosis may be associated with periportal collateral formation which re-establishes flow to the liver. This is also known as “cavernous transformation” and is a strong indication of bland thrombus in the portal vein [25]. Invasive imaging with angiography can also show the collateral flow as well as hepatofugal flow in the portal circulation [29].
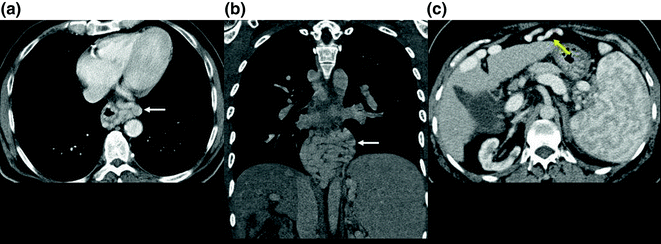

Fig. 2.3
Axial and coronal images from an enhanced CT scan (a, b) showing esophageal varices (white arrow). Axial image from an enhanced CT scan (c) showing a recanalized umbilical vein (yellow arrow)
2.4 Imaging of Liver Malignancies
2.4.1 Hepatocellular Carcinoma (Table 2.2)
2.4.1.1 Overview
Hepatocellular carcinoma (HCC) is the most common primary malignant neoplasm of the liver. Liver cirrhosis of any etiology is a major predisposing factor for development of HCC. HCC can be solitary, multifocal, or diffuse. The five-year survival of patients with HCC is approximately 30% [30].
Table 2.2
Imaging findings of hepatocellular carcinoma
Ultrasound | CT | MRI | Angiography |
|---|---|---|---|
• Lesion with increased or decreased reflexivitya • May show thin fibrous capsule with reduced reflexivity (target sign) • Tumor thrombus in portal vein | • Non-enhanced: Ill-defined hypoattenuating; may have focal internal calcifications • Enhanced: Arterial hyperenhancement; portal venous/delayed washout and capsular appearance; tumor thrombus in portal vein | • Non-enhanced: Low T1W signalb; heterogeneous hyperintense T2W signal • Enhanced: Arterial hyperenhancement; portal venous/delayed washout and capsular appearance; tumor thrombus in portal vein | • Dilated feeding arteries; abundant abnormal vessels (‘tumor stains’)c; arteriovenous shunting • Translucent rim (<10% of cases) • “Threads and streaks” appearance in portal vein invasion |
On ultrasound, small HCC (<3cm) may be of increased or decreased reflectivity in relation to the adjacent parenchyma. An outer margin with a reduced reflectivity is present in some cases and thought to represent the thin fibrous capsule. Larger lesions may show internal heterogeneity, due to hemorrhagic, necrotic, or fatty components [9]. HCC may also be associated with portal vein thrombosis or intravascular tumor. Doppler examination can help distinguish tumor thrombus from bland thrombus in the portal vein: the presence of arterial signal within the occluding material is indicative of tumor thrombus. This distinction is extremely important as tumor thrombus renders patients ineligible for liver transplantation [31]. High-velocity Doppler signals are often seen in HCC and are the result of arterioportal shunting, which is common in HCC [9].
On unenhanced CT, focal or multifocal HCC appears as ill-defined low-attenuation lesion(s). Focal areas of internal calcification have been described in up to 7.5% of lesions. Most HCCs hyperenhance relative to the liver parenchyma in the arterial phase, because they are supplied by the hepatic artery (Fig. 2.4). Some lesions enhance in a peripheral pattern around a central area of lower attenuation. Enhancement of HCC is better seen in the late arterial phase (i.e., when the portal vein becomes visible) than in the early arterial phase. The arterial phase also distinguishes tumor thrombus from bland thrombus (Fig. 2.5), because tumor thrombus enhances. In the portal venous or delayed phases, HCCs usually have lower attenuation than background liver tissue; this is known as the “washout appearance” [32]. Portal venous invasion and expansion is thought to be a specific feature of HCC. The CT features of portal venous invasion by HCC include arterioportal fistulae, periportal streaks of high attenuation, and dilatation of the main portal vein or its major branches [33].
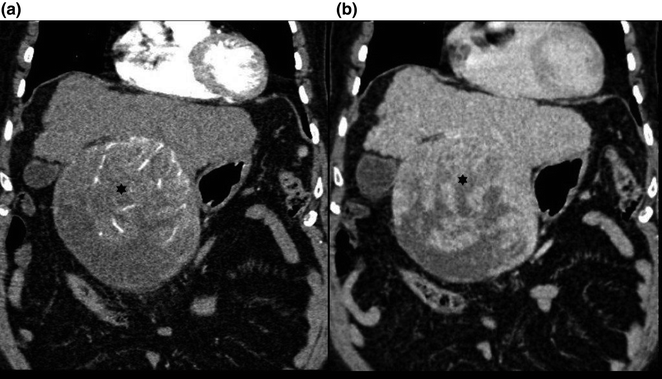
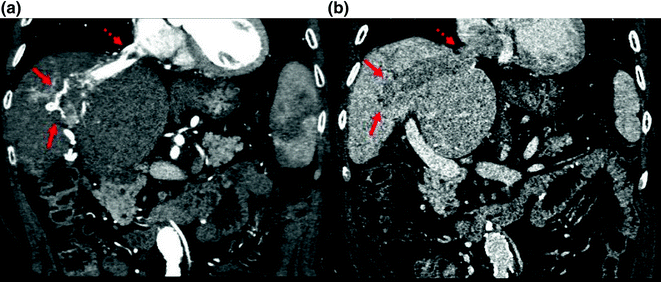

Fig. 2.4
Coronal images from a triphasic CT scan showing a large hepatocellular carcinoma (asterisks) with heterogeneous hyperenhancement in the arterial phase (a) and heterogeneous washout appearance in the portal venous phase (b)

Fig. 2.5
Coronal images from a triphasic CT scan showing an HCC (arrows) invading the hepatic vein and extending to the right atrium (dashed arrow). The invading tumor exhibits a classic “threads and streaks” appearance in the arterial phase (a) and washout appearance in the portal phase (b)
On non-contrast MRI, HCC is typically of decreased signal on T1W images and of increased to heterogeneous signal on T2W images, depending on the size [34]. However, some lesions are of increased signal on T1W probably due to fat or glycogen accumulation. On contrast-enhanced T1W images, the enhancement patterns with gadolinium parallel those for enhanced CT examination, with most lesions hyperenhancing in the arterial phase, and becoming hypointense or washing out in the portal venous and/or delayed phases (Fig. 2.6). A delayed enhancing rim (capsule or pseudocapsule) is often seen around HCCs. Atypical regenerative and dysplastic nodules can mimic the pattern of HCC enhancement in the arterial phase and prompt uncertainty in the diagnosis.
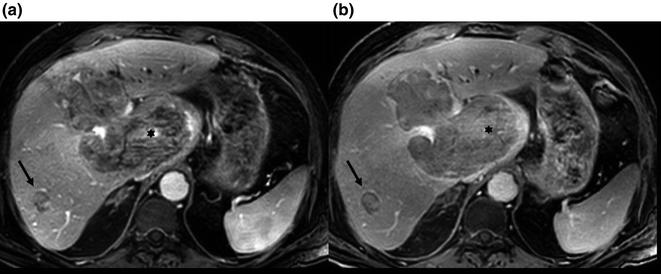

Fig. 2.6
Axial images from an MRI with gadolinium showing a large hepatocellular carcinoma (asterisks) and a small HCC (arrows) with enhancement in the arterial phase (a) and washout appearance in the portal venous phase (b)
Radionuclide imaging, including FDG-PET, is relatively non-specific for HCC and is not recommended for detecting or characterizing lesions but useful for the detection of metastatic HCC outside the liver.
Angiography shows dilated feeding arteries to the HCC, abundant abnormal vessels (“tumor stains”) (Fig. 2.7), and arteriovenous shunting. Some HCC may have a surrounding capsule, and some may appear hypo- or avascular portal vein invasion produces a “threads and streaks” appearance highly suggestive of but not specific for HCC (Fig. 2.5). Angiography is used infrequently for the diagnosis of HCC because of its invasive nature. However, it can be helpful for preoperative assessment by defining the arterial and venous anatomy and by evaluating the site and extent of portal or caval involvement when other techniques are unavailable or equivocal [35].
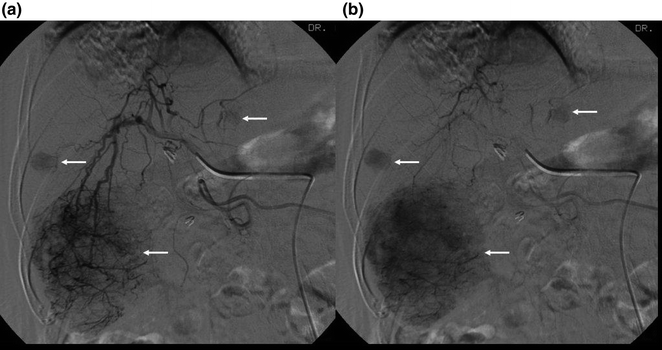

Fig. 2.7
Digital subtraction angiogram of the hepatic artery in the early (a) and late (b) arterial phases showing “tumor stains” (arrows) which represent multiple hepatocellular carcinomas
2.4.1.2 Detection of HCC in Cirrhotic Patients
Several guidelines and recommendations exist for this purpose. The American Association for the Study of Liver Diseases (AASLD) [36] recommends that patients with chronic hepatitis and/or biopsy-documented cirrhosis be screened for hepatocellular carcinoma (HCC) by ultrasound (US) at six-month intervals. CT and MRI, however, are not recommended for screening and are reserved for evaluation of certain lesions already detected on US or if an US study is equivocal or technically limited. Nodules smaller than 1 cm detected on US screening should be followed up with further US at three- to six-month intervals for two years. If no growth occurs during that interval, return to routine surveillance is recommended. However, nodules ≥1 cm should be investigated further with either four-phase multidetector CT or dynamic contrast-enhanced (MRI). Masses with appearances typical of HCC (e.g., hypervascular in the arterial phase with washout appearance in the portal venous or delayed phase) should be treated as such. However, if they display an atypical behavior, they should be biopsied or imaged again with a different modalities for confirmation. If a biopsy with tumor markers proves inconclusive, they should be followed up by imaging at three- to six-month intervals until the nodule disappears, enlarges, or displays diagnostic characteristics of HCC. If they enlarge, they should be biopsied again.
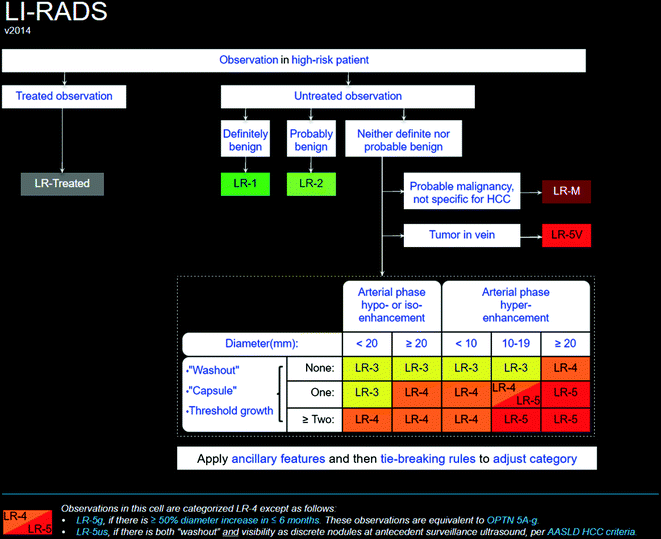
The American College of Radiology (ACR) has recently supported an initiative that has helped standardize imaging in end-stage liver disease. This is known as the Liver Imaging–Reporting and Data System (LI-RADS) (see Algorithm, Fig. 2.8). The LI-RADS relies on objective criteria that are based solely on enhanced CT and/or MR imaging findings and classifies lesions in at-high-risk individuals into categories according to probability of malignancy. The features that are suggestive of HCC and used in the categorization are the following: (1) Mass-like appearance, (2) Arterial phase hyperenhancement (3) Washout of contrast in later phases after hyperenhancement, (4) Presence of a capsule, (5) Size of at least one cm and/or increase in one cm within one year, and (6) Tumor invasion of the portal vein. At the extreme ends of the spectrum are LR-1 and LR-5. LR-1 is a lesion that is benign with 100% certainty, such as a cyst or a hemangioma. LR-5, on the other hand, is a lesion that has a 100% chance of being HCC and satisfies at least four of the above criteria. For the other categories, LR-2 means the lesion is most probably benign with an atypical form of lesions otherwise classified in LR-1. LR-3 and LR-4, respectively, indicate an intermediate probability of HCC and a high probability of HCC; they satisfy the stated criteria to different extents. Also to note, LI-RADS includes a LR-M category which suggests the presence of a malignancy other than HCC (e.g., intrahepatic cholangiocarcinoma) [37, 38].

