symptoms are particularly sensitive nor specific for pneumonia (Table 16-1).20 The most suggestive sign to rule out pneumonia is the absence of a new radiographic infiltrate on portable chest imaging, but even this sign only marginally lowers the probability of pneumonia. When infiltrates are found, air bronchograms are specific for pneumonia but rarely present. Conversely, alveolar infiltrates are sensitive but nonspecific.21 Computed tomography (CT) can sometimes reveal consolidations that were not apparent on portable chest radiographs.22
TABLE 16-1 Sensitivity, Specificity, and Positive and Negative Likelihood Ratios to Diagnose Ventilator-Associated Pneumonia Relative to Histopathology | ||||||||||||||||||||||||||||||
|---|---|---|---|---|---|---|---|---|---|---|---|---|---|---|---|---|---|---|---|---|---|---|---|---|---|---|---|---|---|---|
| ||||||||||||||||||||||||||||||
antibiotic-free days, duration of mechanical ventilation, ICU length-of-stay, or 28-day mortality.
TABLE 16-2 Accuracy of Pulmonary Culture Sampling Methods Relative to Histopathology | ||||||||||||||||||||||||||||||||||||
|---|---|---|---|---|---|---|---|---|---|---|---|---|---|---|---|---|---|---|---|---|---|---|---|---|---|---|---|---|---|---|---|---|---|---|---|---|
| ||||||||||||||||||||||||||||||||||||
TABLE 16-3 CDC’s Traditional Surveillance Criteria for Pneumonia (PNU1) | ||||||||
|---|---|---|---|---|---|---|---|---|
| ||||||||
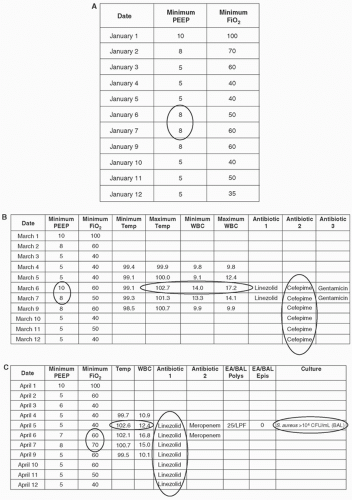
to ready patients for extubation and minimize the risks of barotrauma, hyperoxia, and other complications of mechanical ventilation. Usual practice is therefore to continually decrease patients’ ventilator settings to the lowest levels of ventilator support that can provide adequate oxygenation and ventilation. If a patient’s ventilator settings are stable or declining for a number of days but then rise and remain elevated for a sustained period, it is a signal that the patient may have suffered a respiratory complication. Two ventilator settings are used to identify VAEs in adults, the positive end-expiratory pressure (PEEP) and the fraction of inspired oxygen (FiO2), while mean airway pressure (MAP) and FiO2 are used to identify VAEs in children. VAEs are defined in adult patients as either (1) an increase in the daily minimum PEEP of ≥3 cm H2O sustained for ≥2 calendar days following ≥2 calendar days of stable or decreasing daily minimum PEEP values or (2) an increase in the daily minimum FiO2 of ≥20 points sustained for ≥2 calendar days following ≥2 calendars of stable or decreasing daily minimum FiO2 values. VAEs in pediatric patients (PedVAE) are defined as either (1) an increase in the daily minimum MAP of ≥4 cm H2O sustained for ≥2 calendar days following ≥2 calendar days of stable or decreasing daily minimum MAP or (2) an increase in the daily minimum FiO2 of ≥25 points sustained for ≥2 calendar days following ≥2 calendars of stable or decreasing daily minimum FiO2 values. Notably, neither adult nor pediatric VAE definitions include any radiographic criteria. The CDC elected to exclude radiographic criteria from VAE definitions given their subjectivity, complexity, and variable accuracy.21,27,56,57
Analyzing hourly settings recorded in nursing flow sheets will identify a different set of cases compared to analyzing an electronic feed of minute-to-minute ventilator settings.62 The CDC has tried to minimize this source of variability by requiring that a PEEP value must be maintained for at least 1 hour in order to be considered the daily minimum PEEP, but other variations in how ventilator settings are entered and captured may yet influence VAE rates.
NV-HAP.6 Studies that included non-ICU patients have reported lower crude mortality rates for NV-HAP. A retrospective chart review of 1300 patients with NV-HAP admitted to 21 hospitals, for example, reported a hospital mortality rate of 16%.4 Notably, however, mortality rates may be similar for NV-HAP and VAP when looking at both diagnoses within a common population using a common case finding strategy. The Pennsylvania Patient Safety Authority, for example, found that NV-HAP and VAP mortality rates statewide using PNU definitions were 18.7% and 18.9%, respectively.74 Likewise, the New York City health department reported mortality rates of 20.7% for NV-HAP and 21.6% for VAP using administrative claims data from all New York City hospitals.75 VAE mortality rates tend to be similar to or higher than VAP mortality rates. The overall mortality rate among 19 676 VAEs reported to CDC in 2014 was 31% for VAE, 27% for IVAC, and 34% for non-IVAC VAEs.73 A metaanalysis of five trials comparing VAP and VAE mortality rates estimated that VAEs were associated with a 50% higher odds of death compared to traditionally defined VAP.66
Stay updated, free articles. Join our Telegram channel

Full access? Get Clinical Tree


