The bone marrow, site of origin for blood cells, is the organ most at risk for collateral damage from the modalities of modern cancer therapy. Each of the constituent components of blood—granulocytes, erythrocytes, and platelets—is at risk for compromise. Reduction in quantity and/or function in any component can lead to profound consequences for the patient. Moreover, the bone marrow itself is a frequent site of metastases for many solid tumors and the primary site of many hematologic malignancies, rendering it particularly vulnerable to insult. Indeed, neutropenia, anemia, and thrombocytopenia are the most common complications of cancer and its treatment. Physicians caring for cancer patients must be fully versed in the consequences of cytopenias.
In the early decades of oncology, the armamentarium for hematologic support was limited to transfusions, antibiotics, and the passage of time. The development of growth factors was a technologic tour de force, which profoundly transformed hematologic supportive care. However, growth factors are expensive and are associated with real and theoretical complications. Clinicians should recognize the reasons to consider hematologic support for patients and carefully evaluate the risk-benefit ratio of growth factors and other available measures to maximize patient outcome. By utilizing appropriate supportive care, cancer patients can undergo more effective therapy with reduced morbidity and mortality.
ANEMIA
Anemia is defined as a reduction in the number of circulating red blood cells (RBCs) or by the hemoglobin (Hb) level and the hematocrit (Hct), all reported on a complete blood count. It is the most common hematologic abnormality in patients with cancer. Depending on the tumor type, between 32% and 49% of patients are anemic at the time of cancer diagnosis (1) and approximately 50% of all patients will develop anemia at some time during their treatment. Anemia is graded as mild, moderate, severe, or life threatening (Table 59.1).
When oxygen delivery to tissue is impaired by anemia, subtle or profound organ dysfunction occurs depending on the rapidity of the fall of RBCs, availability of compensatory mechanisms, absolute RBC levels, baseline functional state, and comorbid conditions. Signs of anemia include pallor in mucous membranes, conjunctiva, and nail beds, tachycardia, and increased respiratory rate and may progress to hypoxemia and orthostatic hypotension in patients with acute blood loss and hypovolemia. A widened pulse pressure, hyperdynamic precordium, and systolic flow murmur can be ascertained along with, in decompensated states, signs of high output cardiac failure, peripheral edema, S3 and S4 gallops, and pulmonary rales.
Symptoms of anemia can be insidious and include early decrease in exercise tolerance, shortness of breath on exertion, and fatigue that does not resolve with rest. Some patients describe muscle cramps, irritability, and other signs of neuropsychiatric dysfunction, including depression and confusion. Strain on the cardiovascular system is manifest by breathlessness and rapid heartbeat and can precipitate angina. While cancer-related fatigue itself has many etiologic causes, anemia is a common and contributing factor (2,3,4).
Anemia can have a direct impact on cancer responsiveness to radiation therapy and may impact the ability to deliver full doses of curative chemotherapy on schedule (5). Cancer-associated anemia is an independent risk factor for survival regardless of tumor type (6).
Etiologies of Anemia in Cancer Patients
There are a myriad of possible etiologies for anemia in cancer patients. The particular type of cancer, patient comorbidities, and the treatment itself may all act independently or together to result in anemia (7). Non-cancer-related causes include pre-existing nutritional deficiencies, renal dysfunction, bleeding, hemolysis, hemoglobinopathies, and infection (8). Malignancy itself can promote the development of anemia (anemia of cancer [AOC]) and anemia frequently develops as a consequence of cancer treatment (chemotherapy-induced anemia [CIA]).
Due to the numerous potential etiologies of anemia in patients with cancer, the evaluation may be complex. Thus, knowledge of the pathophysiology behind cancer and chemotherapy resulting in anemia is an important step in gaining a more thorough understanding of cancer-related anemia. The most common anemias in the world are nutritional, particularly those resulting from iron deficiency as well as deficiencies of folate and vitamin B12 (9). These are more often seen in noncancer populations but should always be considered in patients with cancer. In a study of anemic cancer patients receiving chemotherapy, 17% had ferritin levels <100 mg/L, 6% had low vitamin B12 levels, and 2% had high creatinine levels (10).
TABLE 59.1 Anemia grade
Grade
Scale (Hb g/dL)
1 (mild)
10 to lower limit of normal
2 (moderate)
8 to <10
3 (severe)
6.5 to <8
4 (life threatening)
<6.5
5 (death)
Death
Adapted from the Common Terminology Criteria for Adverse Events. http://evs.nci.nih.gov/ftp1/CTCAE/About.html.
It is critical for clinicians to recognize nutritional deficiency as a cause or component of multifactorial etiologies for anemia since it is easily and effectively treated. Patients with cancer may develop nutritional anemia secondary to decreased caloric intake in general or due to decreased ability of the gastrointestinal (GI) tract to absorb nutrients. Iron deficiency anemia due to blood loss or due to the inability to absorb iron often occurs in patients with malignancies of the GI tract, including gastric and colorectal cancers. Iron deficiency may also frequently occur in premenopausal women with heavy menses.
A useful framework for the assessment of anemia arises from evaluating three factors: the degree of RBC proliferation, the size of the RBCs, and the quality of hemoglobinization. Proliferation is estimated by the reticulocyte production index (RPI), which is calculated by multiplying the reticulocyte count by the actual Hct divided by the normal expected Hct and corrected for the longer life span of prematurely released reticulocytes (11). The RBC size is determined by the mean corpuscular volume and can be normal (normocytic), small (microcytic), or large (macrocytic). The degree of hemoglobinization is derived from the mean corpuscular hemoglobin concentration (MCHC). RBCs may have normal levels of Hb (normochromic), low amounts of Hb (hypochromic), or high amounts of Hb (hyperchromic). These simple tests, along with serum iron, total iron-binding capacity, ferritin, vitamin B12, folate, and creatinine levels, and a visual examination of the peripheral blood smear can help diagnose the majority of anemias quickly.
Iron deficiency leads to a microcytic, hypochromic anemia. Conversely, vitamin B12 or folate deficiencies typically lead to macrocytic and normochromic anemias. In the absence of therapy, anemia associated with myelodysplastic syndrome (MDS) will be normocytic to macrocytic and is often associated with other cytopenias. The RPI will be low in nutritional anemias, but it will be high in the setting of acute or chronic hemolysis and may also be high in occult or acute blood loss. A careful history is always a cost-effective tool in determining if there is a hereditary component to anemia such as a hemoglobinopathy or a prior GI surgical procedure that could lead to nutritional deficiency. Endocrine and metabolic deficiencies should be ruled out as well, as they frequently have anemia as a consequence.
Anemia of Cancer
RBCs developed from primitive bone marrow progenitor cells that are functionally defined as burst forming unitserythroid. These red cell precursors are simulated to proliferate and differentiate largely as a result of the actions of erythropoietin, a growth factor hormone synthesized and secreted by the kidney in response to sensing tissue hypoxemia. There is an inverse relationship between the Hb and Hct and erythropoietin levels, which begin to rise above normal when the Hb is <10 g/dL and/or the Hct is <30% (12). Erythropoietin production can be impaired in multiple ways and is frequently compromised in individuals with reduced renal function from any cause, including nephrotoxic chemotherapy, diabetes, and aging.
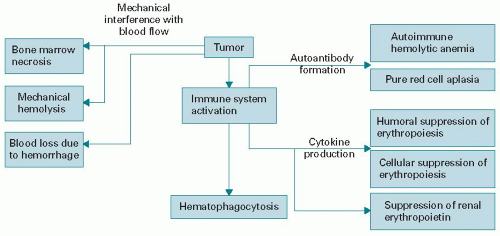
Many cancer patients experience activation of the immune system. At its most extreme, autoantibodies can destroy RBCs leading to autoimmune hemolytic anemia or even profound suppression of RBC production (RBC aplasia). More commonly, there appears to be a less-specific activation of the immune system in the bone marrow leading to increased cytokine production, reduction in erythropoietin production, and increased apoptosis of RBC precursors. Inflammatory cytokines are generated either by cancer cells directly or through tumor-stromal interactions leading to production of interferon gamma, interleukin-1 (IL-1), interleukin-6 (IL-6), and tumor necrosis factor, each of which can suppress erythropoietin production (13,14). These cytokines may also interact synergistically and perpetuate each other’s production leading to a chronically elevated cytokine state and reduction in erythropoietin (Fig. 59.1) (15,16).
Iron metabolism is intrinsically linked to RBC production as iron is incorporated into the functioning Hb molecule through a complex physiology. There is abundant evidence that abnormalities of iron metabolism play a significant role in etiology of AOC. Hepcidin, a small peptide, serves a critical regulatory role in the transfer of iron to RBC precursors. Hepcidin is upregulated by IL-6, acts principally to decrease both iron absorption in the GI tract and macrophage iron release, and decreases erythropoietin levels (17) with a net effect of decreased iron available for erythropoiesis (18).
RBC life span, typically around 90 days in normal individuals, is reduced by cytokines and shortened survival cannot be overcome by compensatory increase in production. Finally, AOC can occur due to myelophthisis, which is replacement of the marrow-forming elements by cancer, a situation frequently seen in prostate cancer, breast cancer, and small cell lung cancer.
The clinical manifestations of AOC are a hypoproliferative state with normocytic to microcytic RBCs, normal to mildly reduced MCHC, and a low reticulocyte count. Serum ferritin levels are typically normal to increased while both serum iron and serum transferrin may be low. These studies help to differentiate AOC from iron deficiency anemia. Severe AOC with an Hb <8 g/dL is rare. Other etiologies should be entertained in this circumstance.
Figure 59.1. Causes of anemia of cancer. Solid tumors can cause anemia by a range of mechanisms. Immune system activation with direct and indirect inhibition of red blood cell (RBC) production is most common, but other factors as described are also operant. Hematopoietic tumors involve similar mechanisms with the addition of intrinsic genetic abnormalities in the erythroid progenitor cells as the most common cause of reduced RBCs.
Chemotherapy-Induced Anemia
The use of chemotherapy significantly increases the proportion of cancer patients with anemia. Myelosuppressive effects of cytotoxic chemotherapy on erythropoiesis are generally cumulative in nature and up to 50% of patients with cancer may develop CIA over the course of treatment (19). A steady increase in the rate of anemia occurs with additional cycles of chemotherapy as demonstrated by the European Cancer Anemia Survey (ECAS), which followed 15,367 patients in 24 countries (20). This study showed that the rate of anemia, defined as an Hb <12 g/dL, increased from 19.5% in cycle 1 to 46.7% by cycle 5. The percentage of patients with more severe, grade 2/3 anemia also increased with greater number of chemotherapy cycles.
Patients frequently become anemic within the first two cycles of chemotherapy as evidenced from a separate analysis of ECAS data in patients who were not anemic (Hb > 12 g/dL) prior to initiating chemotherapy (21). In this analysis, 62% of patients experienced an Hb decline of 1.5 g/dL within a median time of 6.1 to 7.2 weeks and 51% experienced an Hb reduction of ≥2 g/dL within a median time of 7.3 to 8.9 weeks. Over a 6-month period of observation, 67% of surveyed patients became anemic.
A more recent, retrospective study of US communitybased oncology practices shed additional light on the variations and prevalence of anemia by cancer type (22). In this observational cohort study of adult patients with cancer conducted between 2001 and 2007, anemia was defined by an Hb <11 g/dL at any time during chemotherapy. At baseline, 20.9% of the 42,923 patients evaluated were anemic. Fifty-six percent of ovarian cancer patients were anemic during chemotherapy representing the most common group. The next highest prevalences were breast cancer at 53.3% and nonsmall cell lung cancer at 50.9%.
Type of chemotherapy and the length and intensity of treatment can affect the prevalence of anemia. The commonly used platinum-based agents can cause anemia through a variety of mechanisms, including direct effect on renal function as well as occasionally causing hemolytic anemia (23). Patients who received gemcitabine-based regimens (59%), platinum-based regimens (50.7%), and anthracycline-based regimens (50.8%) were the most likely to develop anemia (22).
Additionally as we move into the era of biologic agents, there may be a greater risk for the development of anemia with the newer drugs. For example, imatinib therapy for GI stromal tumors resulted in almost 90% of patients developing anemia, with 10% developing grade 3 or 4 anemia (24). Patients with metastatic renal cell carcinoma receiving temsirolimus as monotherapy experienced an increased rate of clinically significant anemia compared with patients receiving sunitinib or sorafenib (25,26,27).
Erythropoiesis-stimulating agents to Treat Anemia
The use of blood transfusions to ameliorate anemia dates back to the early 20th century and this method was the only treatment available to increase circulating RBCs until the 1980s. The discovery of erythropoietin as the hormone responsible for RBC production led to the purification, cloning, and manufacture of recombinant human erythropoietin (rHuEPO) in quantities useful as a therapeutic agent. First approved to treat anemia associated with chronic renal disease, in 1993 rHuEPO was approved to treat CIA. Several varieties of rHuEPO are available commercially including epoetin alfa (Procrit, Ortho Biotech) and darbepoetin alfa (Aranesp, Amgen) in North America and epoetin beta (NeoRecormon, Roche) in Europe. Together, they are termed erythropoiesis-stimulating agents (ESAs).
The use of ESAs rapidly increased through the 1990s and early 2000s, based on randomized trials that demonstrated improvement in Hb levels, reduction in the need for blood transfusions, and improvement in quality of life (28,29,30). In the mid-2000s, safety concerns were raised with ESA use, leading to a series of US Food and Drug Administration (FDA) advisory boards examining the issue and ultimately to several FDA label changes and a black box warning. As a result, ESA usage dropped very substantially in patients with CIA. It is now likely that once again anemia remains an undertreated problem in the clinical oncology setting.
Large community-based prospective trials of rHuEPO were completed and reported in the late 1990s. The first trial enrolled 2,370 patients with a variety of nonmyeloid malignancies with Hb levels <11 g/dL (31). Patients received 10,000 units (U) of epoetin alfa subcutaneously (SQ) every 3 weeks. Sixty-three percent of patients had a >1 g/dL rise in Hb after 4 weeks and after 16 weeks, 61% had a 2 g/dL rise or Hb >12 g/dL and a mean rise of Hb of 2 g/dL. A weekly fixed dosing schedule of 40,000 U fixed (32) demonstrated an Hb response of 68%, mean Hb rise of 1.8 g/dL, and reduction in transfusion requirement. Given the convenience of weekly compared with thrice a week dosing, 40,000 U weekly of epoetin alfa quickly became the community standard dosage.
Darbepoetin alfa is a modified recombinant form of erythropoietin with a slightly different amino acid structure that adds additional glycosylation to the native glycoprotein (33). Due to these changes, darbepoetin alfa has a prolonged half-life and altered receptor affinity. Darbepoetin alfa was FDA approved for treatment of CIA in 2002. Randomized clinical trials (RCTs) showed a reduction in transfusion requirements, an increase in Hb levels, and an improvement in quality of life in patients with solid tumors and nonmyeloid hematologic malignancies (27,34,35).
A 2005 meta-analysis of 27 randomized trials examining treatment with epoetin alfa or beta demonstrated a reduction in transfusion rate by 33% over untreated patients (relative risk [RR] 0.67 [0.62 to 0.73]) (36). A sub-analysis of 14 trials demonstrated that 48% of patients receiving epoetin alfa had an Hb response, defined as a 2 g/dL rise or achievement of Hb >12 g/dL. Subsequent RCTs and systemic reviews have reinforced the value of ESAs in reducing transfusion requirements (37).
Several clinical trials have compared weekly epoetin alpha with darbepoetin alfa given less frequently (every 2 to 3 wk) and have demonstrated similar efficacy end points (38,39). Therefore, the decision of the agent to be used should be based on scheduling and economic considerations. Darbepoetin alfa was initially FDA approved on a weightbased weekly dosage. More recent trials have demonstrated that a fixed dosage given as infrequently as every 3 weeks retains efficacy with far greater patient convenience (40,41,42). The American Society of Clinical Oncology (ASCO) and the American Society of Hematology (ASH) 2010 guidelines state that epoetin alfa and darbepoetin alfa are therapeutically equivalent with regard to both efficacy and safety (37).
Risks of ESAs
Initial studies with ESAs suggested a potential survival advantage for patients treated for CIA. There was rationale for this signal; anemic patients in many different settings including cancer have an inferior survival over non-anemic-matched controls, and hypoxia can potentially reduce the effectiveness of radiotherapy and even chemotherapy. This hypothesis led to the conduct of several trials in non-anemic patients designed either to prevent significant anemia from occurring or to increase Hb levels to supranormal values. However, a trial in non-anemic head and neck cancer patients receiving radiation therapy and a study in metastatic breast cancer receiving first-line chemotherapy showed higher mortality rates with this strategy (43,44).
Overall, inferior outcomes were demonstrated in 8 of 59 controlled phase III trials of ESAs in a variety of cancers. Only four of these eight trials included patients with CIA, the FDA label indication for ESAs, and all four targeted higher than normal Hb levels as the end point for stopping the ESA. A cervical cancer trial was terminated early in 2003 before the primary end point could be assessed (45). In another breast cancer trial with intent of ESA to increase Hb in nonanemic patients, the event-free survival and overall survival were unplanned analyses (46). No difference in survival was detected in a more mature analysis (47).
An individual patient-level data meta-analysis was published in 2009 (48). This involved 53 studies with 13,933 cancer patients receiving ESAs and included both concurrently chemotherapy-treated patients and those not receiving chemotherapy while on study with the ESA. A significantly increased RR for mortality on study Hazard Ratio (HR 1.17, P = 0.003) and for overall survival duration (HR 1.06, P= 0.005) was noted. When analysis was restricted to 10,441 patients receiving chemotherapy, there was a nonsignificant increase in on-study mortality (HR 1.10, P=0.12) and shortened survival (HR 1.04, P= 0.26). Other meta-analyses published subsequently have reached conflicting conclusions (49).
Based on these results, the consensus of expert opinion concurs that ESAs should not be administered to patients with AOC not receiving chemotherapy. However, it is important to keep in mind that there are no trials published to date that suggest that ESAs given in accordance with guidelines and as per FDA label for CIA result in inferior survival. A number of clinical trials involving ESAs in CIA with survival at the end point are currently in progress.
In contrast to the still unclear signal of survival in CIA patients treated with ESAs, there is substantial evidence that ESAs are associated with an increased risk of thrombovascular events in cancer patients. Venous thromboembolism (VTE) is a frequent complication of cancer in the absence of ESA therapy. Multiple risk factors for VTE in cancer patients include cancer type, stage, chemotherapy regimen, comorbidities, and immobilization (50).
Several recent meta-analyses have evaluated the risk of VTE in patients receiving ESAs with chemotherapy, radiotherapy, or without additional treatment, and each showed a significant increase in the RR for VTE events. The Agency for Healthcare Research and Quality (AHRQ) comparative effectiveness review of 30 RCTs published in 2006 revealed an RR of 1.69 (95% CI 1.36 to 2.10, P < 0.001) (51). The event rate for VTE was 7% (range 0% to 30%) in patients treated with epoetin alfa versus 4% in controls (range 1% to 23%) and 5% in patients treated with darbepoetin alfa versus 3% in controls. A pooled analysis of individual patientlevel data from RCTs comparing darbepoetin with placebo showed an increased risk for VTE (HR 1.5, 95% CI 1.10 to 2.26) (52). No increase was observed in mortality in progression-free survival (HR 0.93, 95% CI 0.84 to 1.04) or disease progression. A meta-analysis of long-term follow-up in 18 RCTs utilizing ESAs in CIA demonstrated an odds ratio of 1.47 and 95% CI of 1.24 to 1.74 for VTE (49).
TABLE 59.2 Common dosing options for epoetin alfa and darbepoetin alfa
Starting Dose
Escalation
Epoetin alfa (Procrit, Ortho Biotech)
FDA label doses
Epoetin alfa 150 U/kg t.i.w.
OR
Epoetin alfa 40,000 U qwk
Increase to 300 U/kg 3 t.i.w.
Increase to 60,000 U qwk
Darbepoetin alfa (Aranesp, Amgen)
FDA label doses
Darbepoetin alfa 2.25 µg/kg qwk
OR
Darbepoetin alfa 500 µg q3wk
Increase Darbepoetin alfa to up to 4.5 µg/kg qwk
NONE
Alternative regimens
Evaluated in RCTs
Darbepoetin alfa 100 µg fixed dose qwk
OR
Darbepoetin alfa 200 µg fixed dose q2wk
OR
Darbepoetin alfa 300 µg fixed dose q3wk
OR
Epoetin alfa 80,000 U q2wk
OR
Epoetin alfa 120,000 U q3wk
Increase darbepoetin alfa to up to 150-200 µg fixed dose qwk
Increase darbepoetin alfa to up to 300 µg fixed dose q2wk
Increase darbepoetin alfa to up to 500 µg fixed dose q3wk
NONE
NONE
All doses developed subcutaneously. Escalation at weeks 6-9 if <1 g/dL rise in Hb from baseline. FDA, Food and Drug Administration; RCT, randomized clinical trial.
The relative rate for VTE appears to be dependent on target Hb, increasing as Hb rises to ≥13 g/dL. The actual dose or schedule of ESAs utilized does not seem to play a role in the RR of VTEs. None of the trials evaluated specific factors that might impact VTE risk. It is reasonable to weigh the risks and benefits of ESAs carefully in patients judged to be at increased risk for VTE based on history or clinical findings.
ESAs Dosing
Table 59.2 summarizes dosing of ESAs. Epoetin alfa can be initiated at doses of 150 U/kg SQ three times per week (t.i.w) or 40,000 U weekly in patients with CIA as per the FDA label. The dose should be increased to 300 U/kg t.i.w or 60,000 U weekly, respectively, if no response in Hb or no reduction in transfusion requirement is noted after 4 to 6 weeks of therapy. Doses can be reduced or held once target Hb levels are obtained with careful monitoring, reinitiating when Hb levels begin to drop toward a level where transfusion might be contemplated. Extended dosing with epoetin alfa at 80,000 U every 2 weeks or 120,000 U every 3 weeks has also been evaluated (53,54).
Darbepoetin alfa can be initiated at 2.25 µ/kg SQ weekly or 500 µg every 3 weeks as per the FDA-approved dose. In addition, randomized trials support starting doses of darbepoetin at 200 µg every 2 weeks or 300 µg every 3 weeks (39,55). The weekly dose of darbepoetin should be doubled to 4.5 µg/kg, the biweekly dose increased to 300 µg, and a starting dose of 300 µg every 3 weeks can be escalated to 500 µg if inadequate response by week 6. There is no evidence to support doses of darbepoetin >500 µg every 3 weeks.
ESAs should be discontinued following completion of chemotherapy or if there is no response after 8 to 9 weeks of therapy as measured by Hb levels or continued need for transfusions. Overall, approximately 50% to 70% of patients will achieve an Hb response, and unfortunately no pretreatment factors predictive of response or nonresponsiveness have yet been identified (56).
Attempts to improve the response to ESAs have focused on providing additional iron, given the functional iron deficiency that occurs in both AOC and CIA. Nine prospective RCTs of intravenous (IV) iron supplementation to oral iron or no iron in CIA patients receiving ESAs have been conducted (57). Eight of these trials showed benefit from the addition of IV iron as measured by Hb response, decrease in blood transfusions, or less ESA requirement (58,59,60,61). Patients had ferritin levels from 160 to 460 mg/L and transferrin saturations from 19% to 36%.
Only one trial, the largest so far conducted, detected no benefit of oral or IV iron (62). A possible explanation for the discordant results in this study is that the rate of IV iron delivery was far lower in this trial than in other studies of IV iron. Given the weight of the data, all patients initiating ESA therapy should be screened for iron deficiency and functional iron deficiency. Concurrent IV iron should be strongly considered for those with evidence of functional iron deficiency.
The FDA labels for epoetin alfa and darbepoetin state that ESA should be initiated when the Hb level falls below 10 g/dL. Additionally, the labels recommend using the lowest dose necessary to avoid transfusion. In contrast, clinical trials in CIA establishing the worth of ESAs generally initiated therapy at a starting Hb of <11 g/dL and discontinued when the Hb rose to the 11 to 12 g/dL range. In the RCTs, significant improvement in quality of life and transfusion reduction were established based on those parameters. It is not clear that utilizing <10 g/dL as an arbitrary starting point and discontinuing when Hb is >10 g/dL as mandated by the Centers for Medicare and Medicaid Services National Coverage Determination will lead to the benefits documented by the RCTs in CIA.
Only gold members can continue reading. Log In or Register to continue