Fig. 1
a CT scan of the brain. b MR scan of the brain. There are two small metastatic lesions clearly visible in the MR scan that are invisible in the CT scan
When MRI was first developed, it was clear that it could be employed for radiation therapy treatment planning of the brain. Treatments were universally conducted employing invasive immobilization, where a metal ring was attached to the patient skull using pins (Fig. 2a). The tumor localization was conducted by attaching a fiducial frame to the ring. The frame (Fig. 2b) typically had rods that were visible on MR and CT. The rod geometry was known to the treatment planning system and the rod images were localized in the CT and MRI scans. The treatment planning software used the imaged rod positions to determine the stereotactic coordinate system with in the patient’s skull. In the early MRI days, the spatial fidelity of the imagers was relatively poor, so the digitized frame positions also served as quality assurance that the MRI image spatial fidelity was adequate for treatment planning.
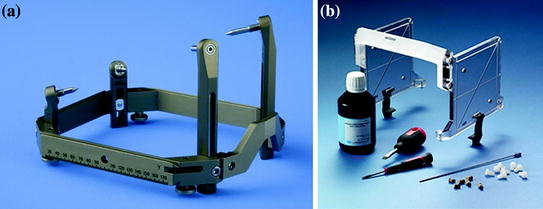

Fig. 2
a Invasive immobilization system frame (Leksell). b Jig used for MR alignment of immobilization frame coordinate system. Location of tubes, filled with contrast agent, are known to the treatment planning system. Contrast agent is localized in the images to align them to the frame coordinate system. This is used to accurately target the tumor at the radiation producing machine (GammaKnife). Images from the Elekta Leksell sales website
As 3D conformal therapy was developed in the 1990s, use of MRI to segment tumors became more practical. Tools such as fusion were developed to overlay the CT and MRI images to enable the use of CT for electron density and DRR generation while taking advantage of MRI’s soft tissue contrast. If invasive immobilization was not employed, a rigid coordinate system could not be straightforwardly generated. The fusion process in the brain typically aligned the bony anatomy, visible as high HU values and low image values (due to the very rapid T1 times in the bone) in the CT and MR images, respectively. Often, structures other than the bones, such as the ventricles, were used to align, guide, or verify registration. The potential for image distortion in the MR images was managed by comparing the locations of structures visible in both image datasets.
Fusion in other parts of the body was more challenging. The MR and CT images were taken at different sessions, and often with different patient setups. Often, the MR image was a diagnostic image that was acquired for diagnostic purposes, so the patient position differed from that used for treatment. In these cases, fusion was made more difficult by the internal tissue distortions caused by patient posture differences. These differences were exacerbated because diagnostic MR couches tended to be more rounded than therapy couches, which were and are flat. Many clinics elected to develop their own flat couch inserts, and vendors began to provide professionally produced flat couch inserts for their MR scanners, to make the MR patient positioning more consistent with the CT simulation positioning.
2 MR Simulation
More recently, the concept of MR simulation has been developed. MR simulation, as defined here, is the use of MR images as the primary image dataset for treatment planning. This does not preclude other images, such as PET, but it would exclude processes that also acquire CT simulation images, processes that can be more accurately described as MR + CT simulation.
Why would one employ MR simulation (also called MR-only simulation)? The benefits include the improved soft tissue contrast and the ability to acquire multiple image datasets that highlight the tissue boundaries, and differentiate different tissue types, even within a specific tumor (Fig. 3). The benefit of MR simulation is that only one simulation process is needed. In the MR + CT simulation workflow, two simulations are scheduled and conducted, requiring that the patient appear for two sessions. The images themselves must be fused, involving further clinical effort and providing additional opportunities for error.
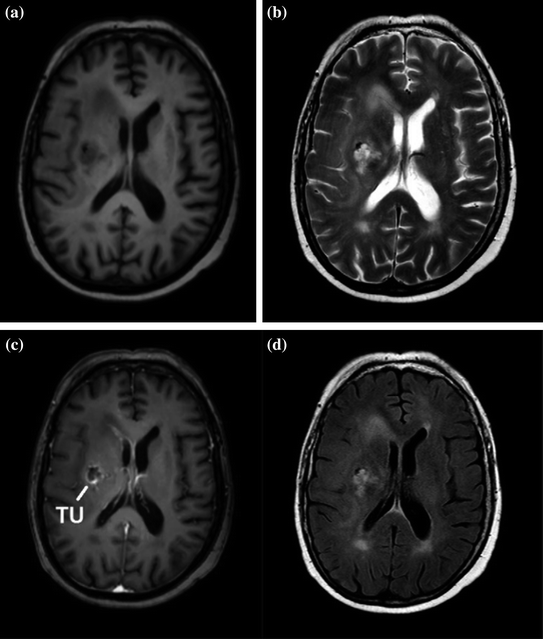

Fig. 3
Patient with Glioblastoma scanned using 4 different MR protocols. a T1 weighted. b T2 weighted. This shows fluids as very bright. The tumor is readily visualized in this image. c Contrast-enhanced T1. The tumor contrast has improved. d T2 weighted with fluid-attenuated inversion recovery (FLAIR). Images are from Schmidt and Payne (2015)
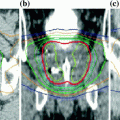
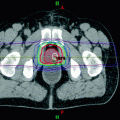
Because of these potential benefits, a number of clinics are expanding their use of MR simulation. Figures 4 and 5 show examples of different sites employing MR simulation from Devic (2012).
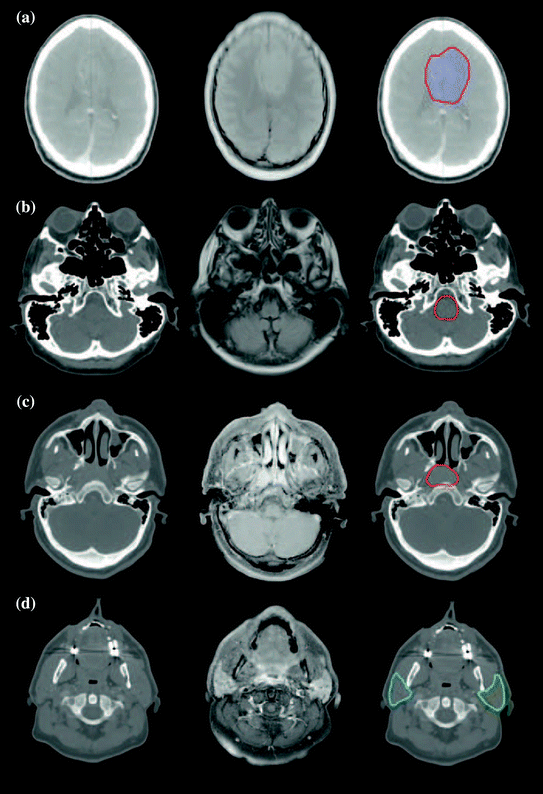
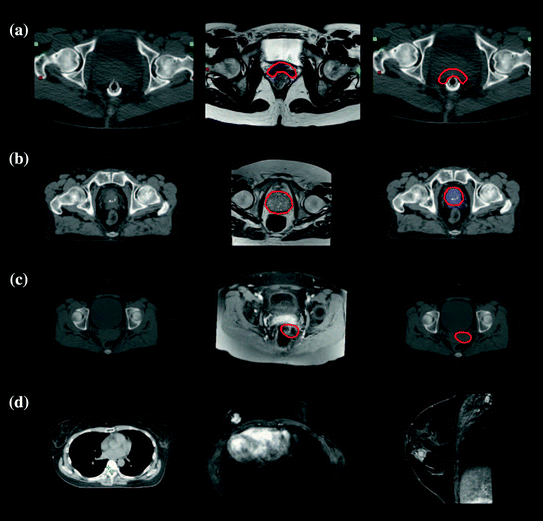

Fig. 4
Examples of the use of MR images for supplementing CT simulation images for radiation therapy treatment planning. a Glioblastoma. b Brainstem. c Nasopharynx. d Parotid glands. The first column is the CT simulation, the second the MR scan, and the third shows the superposition of the segmented structure on the CT simulation. Images from Devic (2012)

Fig. 5
Examples of the use of MR images for supplementing CT simulation images for radiation therapy treatment planning. a Rectal. b Prostate. c GYN. d Breast. The first column is the CT simulation, the second the MR scan, and the third shows the superposition of the segmented structure on the CT simulation. Images from Devic (2012)
There are a number of challenges inherent in employing MR simulation. The MRI scanner bore is generally smaller than a CT simulator. CT simulators started out as slightly modified diagnostic CT scanners, but the CT manufacturers realized early that increasing the bore size was critical for radiation oncology. Unlike most diagnostic CT applications, the patient position was specified by the ideal position during treatment, which often employed extended arm postures. The first wide bore CT scanner had an 85 cm diameter bore and some current units have 90 cm diameter bores. This contrasts with MRI scanners, which have bores only as large as 75 cm diameter. This constrains somewhat either the treatment position or the correspondence between the treatment and scanned positions.
MR scanners employ RF sensing coils. The signal intensity falls off rapidly with increasing distance between the RF sensing coils and the imaged tumor or organ. Therefore, most RF coils are in direct or immediate contact with the patient. Rigid coil systems such as head coils interfere with head immobilization systems, while flexible coils placed on the skin can distort the skin and deform the tumor and normal organ geometry. Figure 6 shows an example of an MR simulator patient with the necessary immobilization hardware and imaging coils.
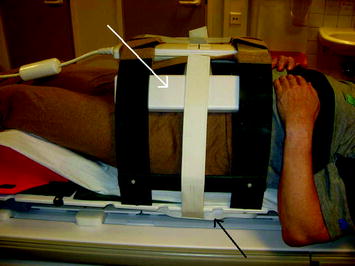

Fig. 6
Photograph of MR simulation patient showing immobilization system and suspended radiofrequency coils. Image from Kapanen et al. (2013)
The spatial integrity of CT is outstanding. The images are reconstructed from transmitted radiation beamlets whose geometry is defined by the relative positions of the X-ray source and the detector. With MR imaging, on the other hand, the tissue locations are determined by the acquisition sequence. Positions may be determined by the relationship between a magnetic field gradient and applied RF frequency, or from a relationship between received RF frequency or phase and magnetic field gradient. In general, it is the absolute magnetic field that determines localization, and main magnetic field homogeneity and gradient field accuracy determine spatial accuracy. Main magnetic field homogeneity is typically specified within a spherical volume centered at the MR system center. Within this region, spatial accuracy will have a tighter specification than beyond the region. CT, on the other hand, is accurate within a cylindrical volume that encompasses the projected X-rays. This difference in accuracy specification, as well as the loss of the direct geometric relationship between the equipment hardware and the image voxel positions means that MR image quality assurance needs to include spatial accuracy evaluation.
Various methods for conducting quality assurance on MR simulators have been proposed. Kapanean et al. (2013) described the process of commissioning an MR-only simulation and treatment planning for prostate cancer. They employed a 70 cm diameter GE 1.5T MR scanner that had an indexed flat couch top and positioning lasers. Paulson et al. (2015) described the quality assurance procedures required for MR simulation. They employed a 3.0T Siemens MR Scanner with a 70 cm diameter bore. They described the patient-specific quality assurance techniques to assure fidelity and utility of the MR images (Table 1) as well as routine quality assurance procedures (Table 2). There have not yet been widely accepted protocols for patient-specific or routine quality assurance, but the American Association of Physicists in Medicine has a task group entitled “Use of MRI Data in Treatment Planning and Stereotactic Procedures—Spatial Accuracy and Quality Control Procedures” that is developing quality assurance recommendations.
Sim setup | Sim exam | Dosimetry |
|---|---|---|
• Target volumes centered within bore (to extent possible) during CT sim • Headphones molded into alpha cradles/vac-locs for abdomen MRI simulation exams • Immobilization devices fit within MRI bore template | • Coverage sufficient (10 cm past markers for sarcoma) • Images screened for artifacts • 3D distortion correction applied to all images • Off-resonance correction applied (if necessary) • Subtractions performed • Reformats of coronal and sagittal slices to axial slices performed • Functional/physiological data integrity verified • Functional/physiological parameter maps generated | • Distortion-corrected MR images loaded and labeled according to MR Sim Reference Guide (Table II) • CT-MR image registration accuracy verified |
Weekly QA (MRI technologists) | Monthly QA (therapy physicists) | Annual QA (MRI physicists) |
|---|---|---|
• Transmitter gain constancy • Center frequency constancy • Signal-to-noise ratio constancy • Slice thickness accuracy • Slice position accuracy | • Patient safety (monitors, intercom, panic ball, emergency offs, and signage) • Patient comfort (bore lights, and bore fan) • Percent signal ghosting • Percent image uniformity • High/low contrast constancy • Laser alignment • Couch position accuracy • Image artifacts | • RF coil integrity check • BO constancy • B1 + constancy • Gradient linearity constancy |
MRI voxel intensities are related to the RF signal strength acquired during the imaging sequence. Therefore, the voxel values for a specific piece of tissue will depend strongly on the sequence, coil design and coil position. Image guided radiation therapy couples the images used for treatment planning with those acquired during setup. Universally, setup images of internal tissues are acquired using kilovoltage X-rays. Transmission X-ray images such as radiographs display the integral attenuation coefficients of the tissues and hardware lying between the source and detector. Cone-beam CT is employed to acquire 3D images, and each voxel represents the linear attenuation coefficient of the tissue, albeit with decreased quantitative accuracy relative to diagnostic CT scans. When radiographic images are acquired to position the patient, they are compared against images created by projecting rays through the CT simulation scan and predicting the radiographs. These are termed digitally reconstructed radiographs. When radiographs are used for positioning, comparing the radiographs to digitally reconstructed radiographs is straightforward. The tissues that provide image contrast are bone, soft tissues, lungs, and air cavities, by virtue of their differing physical density and atomic number. With MR simulation, projection through the MR image will not provide a useful DRR. The proposed method for dealing with this is to use MR images to create a synthetic CT.
The principle challenge of using MR images to create kV X-ray DRRs is the lack of a functional relationship between the linear attenuation coefficient and MR image intensity. This is due mostly to the fact that air and bone both provide low MR signals for most sequences, air due to the lack of protons, and bone due to the rapid loss of magnetization of protons in solid materials.
The use of CT scans for both dose calculation and for the generation of patient positioning reference images is fortuitous and discussions about the generation of synthetic CT scans almost always convolves the two applications of CT. There is no reason why this needs to be so for MR simulation, an electron density map could be generated separately from an image used to generate reference setup images. This is true because the requirements for generating the two image datasets vary greatly and creating a single dataset that would fulfill both requirements adds unnecessary challenges to the MR simulation workflow. The electron density map used for treatment planning does not need voxel-by voxel spatial integrity. Rather, it needs to be accurate on average so that the photon attenuation and scatter properties are accurately computed. Megavoltage X-rays are relatively insensitive to electron density calculation errors, especially on the voxel level. The reference setup image dataset, on the other hand has to embody the spatial contrast behavior present in a CT scan. For example, the position of a bony edge needs to be correctly positioned (and distinguished from the edge of an air cavity). However, the voxel values themselves do not need to strictly speaking be accurate. When the image dataset is compared against a cone-beam CT or projections are used to create DRRs that are compared against radiographs, it is the bony (and less so air cavity) localization that needs to be accurate for the human or computerized registration to identify the patient’s position. Unfortunately, most publications have not made this distinction, so separating published approaches to separately overcoming these challenges is difficult.
There are two proposed methods for creating synthetic CT scans from MR images, including segmenting images and assigning CT numbers, and acquiring a series of MR images and computing the CT numbers.
Segmenting Approaches
Much of the early MR simulation work concerned the generation of electron density maps and the subsequent dose calculation accuracy. Prabhakar et al. (2007) evaluated the use of MR alone for 3D treatment planning in brain tumors. They evaluated treatment plans from 25 brain tumor patients scanned with a CT and 1.5T MRI scanner. The treatment plans comparing the use of CT with and without heterogeneity correction and the MR with a bulk density assignment showed no statistically significant difference in coverage. Ramsey and Oliver (1998) as early as 1998 developed a method for calculating dose distributions and generating DRRs using only one T1 MRI image dataset. They assumed a linear relationship between the MR voxel value and physical density to generate the synthetic CT. This provided the ability to differentiate between the skull and the brain, but not air cavities. They evaluated their technique using archived MR patient images and a RANDO phantom, generating DRRs and irradiating TLD chips in the phantom (comparing to homogeneous dose calculations) to evaluate dosimetric accuracy of their method. The MR plan underestimated dose by less than 2% of a CT-based plan for a single photon beam passing through the cranium. When the dose passed through air cavities, the dose discrepancy increased to 2–4%.
Like the head, the pelvis contains relatively homogeneous density tissues, exclusive of the pelvis and femurs. Evaluations of prostate treatment plans with a single water-equivalent density have shown differences as small as 1% (Petersch et al. 2004) and greater than 2% (Chen et al. 2004a, b; Lee et al. 2003). Assigning separate densities to bone and soft tissue have provided doses within 2% of the dose calculated using CT (Lee et al. 2003; Karlsson et al. 2009). Lambert et al. (2011) evaluated the dose distribution accuracy of prostate treatment plans, comparing bulk density assignment (soft tissue and bones separately assigned) with full heterogeneity assignments for 39 patients that had both CT and MRI images. They created three treatment plans using the CT simulation, one with the full heterogeneity, one with densities assigned to bone and water to other tissues, and one with just water density, and two plans based on MR images with the same bulk density assignments as the CT scans. They found that the tumor doses were equivalent between the MR and CT bulk density plans, with minor variations assumed to come from differences in external patient contours. Point doses differed by −1.4 ± 1.7% and −2.6 ± 1.7% for the CT and MR uniform density plans compared against the CT simulation based plans, respectively, and 0.1 ± 1.2% and −1.3 ± 1.6% for the CT and MR bone/soft tissue bulk density assigned plans compared against the CT simulation based plans, respectively.
Given that there are more than two tissue classes in the brain and pelvis, investigators have shown that contouring more classes of tissues improves the dosimetric accuracy to within 1% for intracranial targets (Jonsson et al. 2010; Kristensen et al. 2008) and between 1 and 2% for prostate (Chen et al. 2004a, b; Lee et al. 2003; Jonsson et al. 2010; Eilertsen et al. 2008). While the accuracy of bulk density assignments have been established, they have not become a popular treatment planning approach because of the effort required and the limited benefit of not acquiring a CT simulation in addition to the MR simulation.
Semi-automated and Automated Approaches
A relatively manual approach was proposed by Kim et al. (2015) to generate simulated CT scans. They used three typical MR sequences: a 3D T1 weighted fast field echo sequence, a 3D T2-weighted turbo spin echo sequence, and a 3D balanced turbo field echo sequence. To provide high-intensity values in bone, an inverse intensity volumetric image was derived by subtracting weighted intensity values from the 95th percentile intensity value. Bony anatomy was contoured using the T2-weighted images. Air was assigned a single density value, but other tissues were assigned an intensity based on a weighted sum of the acquired and derived MR image voxel values. The registered CT scans were used to train the weights. The technique produced synthetic CT scans that had HU errors of only 2.0 ± 8.0 HU and 11.9 ± 46.7 HU for soft tissue and femoral bones, respectively. The impact on treatment plans of using the synthetic CT were negligible except for differences associated with variations in organ positions between the MR and CT simulation sessions. Kim et al. conducted a qualitative assessment of synthetic DRRs and found them to be similar to the CT-sim generated DRRs.
Huan et al. (2014) evaluated a method for creating DRRs by segmenting airways from MR simulation images. They concentrated on the skull to create both simulated CT scans and simulated DRRs. They judged that inaccuracies in airway segmentation would impact DRR generation accuracy less than inaccuracies in bone segmentation. Airways were manually contoured on transverse scans at 6 anatomic levels to create an air mask. Compact bone, spongy bone, and soft tissue masks were then automatically generated using the MR voxel values and the air mask. The MR intensities within the masks were used to create the simulated CT scans and corresponding DRRs. They evaluated this process for 20 stereotactic radiosurgery patients. They evaluated their process for 20 patients undergoing stereotactic radiosurgery in the brain. The maximum geometric difference between MR-based and CT-based DRRS of the skull was less than 2 mm.
The biggest challenge for automating synthetic CT generation is the fact that for most MR sequences, neither high density bony tissues nor low density tissues emit RF signals, so both of these tissue types show up as black in MR images. The reason that MR images have poor signal in bone is that the coupling between protons and the rest of bony anatomy leads to very rapid realignment of the proton magnetic moments after excitation. Ultrashort echo time (UTE) imaging is one method to acquire signal from solid tissues (Robson et al. 2003).
Stay updated, free articles. Join our Telegram channel

Full access? Get Clinical Tree


