Abbreviations
- ACTH Adrenocorticotropin
- ALS Acid labile subunit
- cAMP Cyclic adenosine monophosphate
- CPHD Combined pituitary hormone deficiency
- EGF Epidermal growth factor
- EGF-R Epidermal growth factor receptor
- FGF Fibroblast growth factor
- FGF-R Fibroblast growth factor receptor
- GHGrowth hormone
- GHBP Growth hormone–binding protein
- GHRH Growth hormone–releasing hormone
- GnRH Gonadotropin-releasing hormone
- hCG Human chorionic gonadotropin
- hCS Human chorionic somatomammotropin
- HDL High-density lipoprotein
- HESX1 Hesx1 homeodomain
- hGH Human growth hormone
- IGHD Isolated growth hormone deficiency
- IGF-I Insulin-like growth factor I
- IGF-II Insulin-like growth factor II
- IGFBP Insulin-like growth factor–binding protein
- IUGR Intrauterine growth retardation or restriction
- JAK-STAT Janus kinase-signal transducers and activators of transcription
- LDL Low-density lipoptrotein
- LH Luteinizing hormone
- LS Lower segment
- MC4R Melanocortin 4 receptor
- NSD1 Nuclear receptor–binding SET domain protein 1
- Pit1/POU1F1 Pituitary-specific transcription factor 1 or POU class 1 homeobox 1
- PTH Parathyroid hormone
- PTPN11 Protein tyrosine phosphatase nonreceptor 11
- RTA Renal tubular acidosis
- SOD Septo-optic dysplasia
- SGA Small-for-gestational age
- SHOX Short stature homeobox
- TBG Thyroxine-binding globulin
- SRIF Somatostatin
- TRH Thyrotropin-releasing hormone
- TSH Thyrotropin
- US Upper segment
Growth: Introduction
Assessment of growth in stature is an essential part of the pediatric examination. Growth is an important index of physical and mental health and of the quality of the child’s psychosocial environment; chronic problems in any of these areas may be reflected in a decreased growth rate which may be a critical clue as to the onset of the condition. We shall consider influences on normal growth, the normal growth pattern, the measurement of growth, and conditions that lead to disorders of growth.
Normal Growth
The growth of a fetus begins with a single fertilized cell and ends with differentiation into more than 200 cell types, length increasing by 5000-fold, surface area by 6 × 10⁶-fold, and weight by 6 × 10¹²-fold. This all to leads to an approximately 7 lb newborn. Overall, the growth of the fetus is dependent on the availability of adequate oxygen and nutrition delivered by the placenta and is orchestrated by a group of growth factors, all overseen by a basic genetic plan. Genetic factors are more important early in gestation, whereas the maternal environment attains more importance late in gestation.
The classic definition of small-for-gestational age (SGA), although somewhat arbitrary, is a birth weight 2 standard deviations below the mean or below the fifth percentile for birth weight, or birth weight below 2500 g for a term infant in the United States. The term intrauterine growth retardation or intrauterine growth restriction (IUGR) is not synonymous with SGA, because IUGR refers to decreased intrauterine growth velocity noted on ultrasound. Statistics and charts showing various percentiles of weight for gestational age are available to determine which premature infants are SGA and what weights are appropriate for gestational age. About 20% of SGA infants remain short as children and adults, in contrast to appropriate-for-gestational-age premature infants, who are smaller at birth but generally experience catch-up growth in the first 2 years. Those SGA infants who do not experience catch-up growth by 2 years of age may be candidates for growth hormone therapy. Recent studies suggest that preterm, AGA babies who show poor growth in the first 3 postnatal months follow growth patterns similar to SGA infants; thus consideration of GH therapy may be warranted as this situation receives further study.
The placenta acting as an endocrine organ influences most aspects of fetal growth, including the supply of adequate nutrition and oxygen and regulation of hormones and growth factors. Aberrant delivery or control of any of these factors affects fetal growth; placental weight is usually directly related to birth weight.
The hormones that mediate postnatal growth do not necessarily play the same roles in fetal growth. Growth hormone (GH) is present in very high concentrations in the fetus, in contrast to the limited presence of GH receptors. Although this discrepancy suggests limited activity of GH in the fetus, GH does play a role in fetal growth as reflected in the average birth weight 1 standard deviation (SD) below the mean in GH-deficient infants. Infants with GH resistance due to abnormal, reduced or absent GH receptors (eg, Laron syndrome) have elevated GH and low serum insulin-like growth factor (IGF)-I levels; they also have decreased birth length and weight. Thyroid hormone deficiency does not directly affect human birth weight, but prolonged gestation can be a feature of congenital hypothyroidism, and this factor will itself increase weight. Placental lactogen exerts no effect on birth size in human beings. However, the concentration of placental-derived GH (from the GHV gene) is significantly decreased in the serum of a pregnant woman bearing a fetus with IUGR.
Oncogenes may be responsible for neoplastic growth in postnatal life, but expression of these genes is important in the normal development of many fetal organs. Remarkably, the same oncogenes that cause postnatal neoplasia are prevented from causing tumors in the normally differentiating fetus. For example, a mutation in the von Hippel-Lindau gene predisposes to retinal, cerebellar, and spinal hemangioblastomas, renal cell carcinomas, and pheochromocytomas, but the normal VHL gene is expressed in all three germ cell layers of the embryo and in the central nervous system, kidneys, testis, and lung of the fetus, suggesting a role in normal fetal development for this gene.
IGF-I in the fetus is regulated by metabolic factors other than GH, in contrast to the dependence of IGF-I generation upon GH in postnatal life. One explanation is that there are fewer GH receptors in the fetus than after birth. In the human fetus, serum GH falls during later gestation owing to maturation of central nervous system’s negative control, whereas serum IGF-I and IGF-binding protein (IGFBP)-3 rise during gestation, demonstrating their independence from GH stimulation.
Studies of knockout mice, which lack various growth factors or binding proteins, indicate a role for IGF-II in growth during early gestation and one for IGF-I during later gestation. Knockout of type 1 IGF receptors leads to a more profound growth failure than is found in IGF-I knockout mice alone, suggesting that factors other than IGF-I (eg, IGF-II) exert effects on fetal growth through the type 1 receptor.
Study of transgenic mice overexpressing IGFBPs supports the concepts that excess IGFBP-1 stunts fetal growth while excess IGFBP-3 leads to selective organomegaly. For example, overexpression of IGFBP-3 in mice led to organomegaly of the spleen, liver, and heart, although birth weight was not different from that of wild-type mice.
Although controversy remains over some of the data regarding IGFs and fetal growth, a summary of the complex IGF system in the fetus, based on the evidence from various species, appears to apply to the human being as follows.
IGFs are detectable in many fetal tissues from the first trimester onward.
Concentrations of IGFs in the fetal circulation increase during pregnancy, and at term the concentrations of IGF-I are directly related to birth weight.
In mice, disruption of the IGF genes leads to severe growth retardation.
There is a striking increase in IGFBP-1 and IGFBP-2 concentrations in amniotic fluid at the end of the first trimester.
The major binding proteins in the human fetus are IGFBP-1 and IGFBP-2.
From as early as 16 weeks, there is an inverse correlation between fetal concentrations of IGFBP-1 and birth weight.
In the mother, circulating concentrations of IGF-I and IGFBP-1 increase during pregnancy.
Maternal IGFBP-1 concentrations are elevated in severe pre-eclampsia and IUGR.
Fetal concentrations of IGFBP-1 are elevated in cases of IUGR, especially those associated with specific evidence of reduced uteroplacental blood flow. Production of IGFBP-1 appears to be a sensitive indicator of the short- or long-term response to reduced fetal nutrition.
Although insulin is a major regulatory factor for carbohydrate metabolism, many lines of evidence demonstrate that it is a growth factor as well and has importance in fetal growth. Macrosomia is a well-known effect of fetal hyperinsulinism as is found in the infant of the diabetic mother. Errors in the normal pattern of IGF-II gene expression from the paternal chromosome and type 2 IGF receptor (for IGF-II) from the maternally derived gene underlie the pathogenesis of Beckwith-Wiedemann syndrome. Affected infants are large and have elevated insulin concentrations. Increased weight gain in pregnant women over 40 lb leads to significantly increased risk of fetal macrosomia in gestational diabetes mellitus as well as in those with normal glucose tolerance test results.
Just as increased insulin stimulates fetal growth, syndromes of fetal insulin deficiency such as congenital diabetes mellitus, pancreatic dysgenesis, or fetal insulin resistance (eg, leprechaunism) are characterized by IUGR. Infants born to diabetic mothers with vascular disease, hypertension, and or eclampsia or preeclampsia also have IUGR and are born SGA. In that situation, it is clear that limited nutrient delivery compromises the growth of the infant.
Epidermal growth factor (EGF) is involved with fetal growth, and expression varies with disordered fetal growth. Microvilli purified from the placentas of infants with IUGR have decreased or absent placental epidermal growth factor receptor (EGF-R) phosphorylation and tyrosine kinase activity. Maternal smoking decreases birth weight by an average of 200 g, with the major effect occurring late in pregnancy; the placenta responds to smoking by significant changes in its vascularity, which leads to fetal hypoxia. There are decreased numbers of EGF-Rs and a reduced affinity of these receptors for EGF in the placentas of women who are smokers. Hypertensive patients also have decreased numbers of placental EGF-Rs, which may result in IUGR.
EGF levels in amniotic fluid are normally increased near term but decreased in pregnancies complicated by IUGR—although not, conversely, increased in infants who are large for gestational age. EGF levels in the first urines to be voided by IUGR and macrosomic infants are lower than in control infants.
EGF administered to fetal monkeys results in histologic and biochemical maturation of their lungs, leading to improved air exchange and a diminished requirement for respiratory support. Surfactant apoprotein A concentration and the lecithin-sphingomyelin ratio are both significantly higher in the amniotic fluid of EGF-treated fetuses. Whereas birth weight is not affected by EGF, adrenal and gut weights, standardized for body weight, are increased significantly. Furthermore, EGF stimulates gut muscle, gut enzyme maturation, and gut size and content, improving the ability of the infant to absorb nutrients. Lastly, EGF advances the maturation of the fetal adrenal cortex, increasing the expression of 3-beta-hydroxysteroid dehydrogenase. Because EGF can be absorbed orally, this raises a question as to whether EGF could be a useful treatment for premature infants or, postnatally, for causing more rapid maturation of the neonate and improving survival in premature infants.
Genetically engineered fibroblast growth factor receptor 2 (FGF-R)-deficient mice are severely growth-retarded and die before gastrulation. Aberrant FGF signaling during limb and skeletal development in the human being can lead to syndromes of dysmorphia. For example, achondroplasia is due to mutations in the transmembrane domain of the type 3 FGF-R.
Maternal factors, often expressed through the uterine environment, exert more influence on birth size than paternal factors. The height of the mother correlates better with fetal size than the height of the father. However, there is a genetic component to length at birth that is not sex specific. Firstborn infants are on the average 100 g heavier than subsequent infants; maternal age over 38 years leads to decreased birth weight; and male infants are heavier than female infants by an average of 150 to 200 g. Poor maternal nutrition is the most important condition leading to low birth weight and length on a worldwide basis. Chronic maternal disease and eclampsia can also lead to poor fetal growth. Maternal alcohol ingestion has severe adverse effects on fetal length and mental development and predisposes to other physical abnormalities seen in the fetal alcohol syndrome such as microcephaly, mental retardation, midfacial hypoplasia, short palpebral fissures, wide-bridged nose, long philtrum, and narrow vermilion border of the lips. Affected infants never recover from this loss of length but attain normal growth rates in the postnatal period. Abuse of other substances and chronic use of some medications (eg, phenytoin) can cause IUGR. Cigarette smoking causes not only retarded intrauterine growth but also decreased postnatal growth for as long as 5 years after parturition. Maternal infection—most commonly toxoplasmosis, rubella, cytomegalovirus infection, herpes simplex infection, and HIV infection—leads to many developmental abnormalities as well as short birth length. In multiple births, the weight of each fetus is usually less than that of the average singleton. Uterine tumors or malformations may decrease fetal growth.
Infant’s with abnormal karyotypes may have malformation syndromes and may also demonstrate poor fetal or postnatal growth. In most cases, endocrine abnormalities have not been noted. For further discussion of this extensive subject, the reader is referred to other sources listed in the references at the end of this chapter.
The metabolic syndrome, “syndrome X,” or the insulin resistance syndrome consists of (1) hypertension, (2) impaired glucose tolerance, and (3) elevated triglycerides among other features (see Chapter 17). Insulin resistance is a cardinal feature and might be the basis for most or all of these complications or may be just one feature of the syndrome, according to some. The metabolic syndrome is one of the long-lasting effects of abnormalities in fetal growth. Evidence from many international studies indicates a relationship between low birth weight or low weight at 1 year of age and chronic disease in adulthood. An opposing view is that catch-up growth, rather than low birth weight, is responsible for these defects long into the child’s future.
Inanition during the last two trimesters of pregnancy, which occurred during the famine in Holland during World War II, led to an 8% to 9% decrease in birth weight; however, female infants born under these conditions later gave birth to normal-sized infants. On the other hand, in the Dutch and Leningrad famines, infants born after early gestational starvation of their mothers, but with improved maternal nutrition in late gestation were of normal size at birth. However, the female infants, born of normal size after this early gestational maternal starvation themselves gave birth to small infants (SGA of 300-500 g decrease). In other populations, women with a history of SGA tend to have SGA infants themselves, and some studies show that generations of malnutrition must be followed by generations of normal nutrition before there is correction of the birth weight of subsequent infants. The sparse environment of the fetus early in gestation in a mother with various degrees of starvation programs the fetal metabolism for survival of the fetus but later in life these survival techniques become maladaptive in an environment of plenty. Insulin resistance in fetal life may spare nutrients from utilization in muscle, thus leaving them available for the brain; this mechanism would serve to minimize central nervous system damage in the fetus during periods of malnutrition. The complexity of the situation is not completely understood but is the target of extensive research in vivo, in vitro, and in long-term clinical studies.
Birth weight and rate of postnatal growth (ie, catch-up growth)—not prematurity alone—are inversely related to cardiovascular mortality and the prevalence of the metabolic syndrome. It is not yet clear what the optimal nutrition is for a premature or small-for-gestational-age infant to avoid this metabolic programming.
Studies of otherwise normal but thin children, who had a history of SGA, demonstrated insulin resistance before the teenage years, supporting the concept of early metabolic programming. Present-day adults, who were born in the Netherlands during the Dutch famine who had the lowest birth weights and the lowest maternal weights (those subjects whose mothers experienced malnutrition during the last two trimesters noted above), show a degree of insulin resistance that is directly related to their degree of SGA, further documenting the relationship between fetal undernutrition and adult insulin resistance as the etiology of poor growth.
On the other hand, large infants born to mothers with diabetes mellitus often develop childhood obesity and insulin resistance even if they have a period of normal weight between 1 and 5 years of age. Remarkably, studies of the offspring of Dutch mothers exposed to famine during World War II in the first two trimesters (the time in which birth weight is least affected by maternal starvation) demonstrated a two-fold increase in the incidence of obesity at 18 years of age, compared with a 40% decrease in the incidence of obesity if the individual was exposed to famine in the last trimester (the time in which birth weight is most negatively impacted by maternal starvation).
Individuals born SGA also have variations in pubertal development and reproductive hormones. SGA girls tend to have earlier puberty, or if puberty occurs at an average age, more rapid progression of puberty or polycystic ovarian syndrome (PCOS). Adult males born SGA have increased aromatase and increased 5-alpha reductase demonstrating effects on reproduction in the male as well as the female. In sum, prenatal and early postnatal growth affects the older child and adult in many ways.
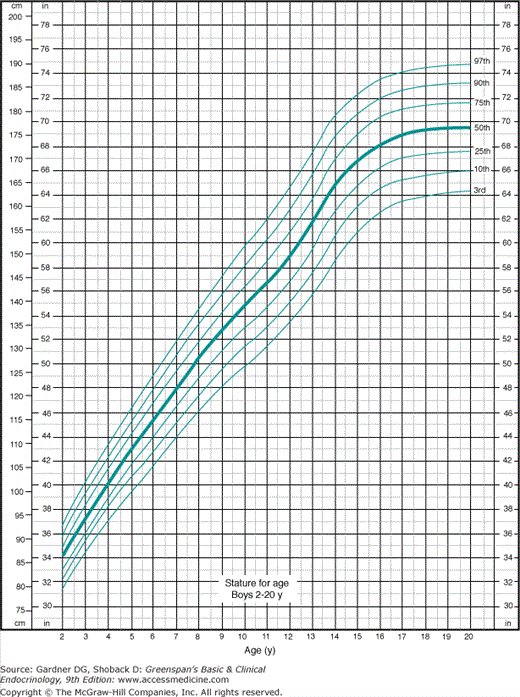
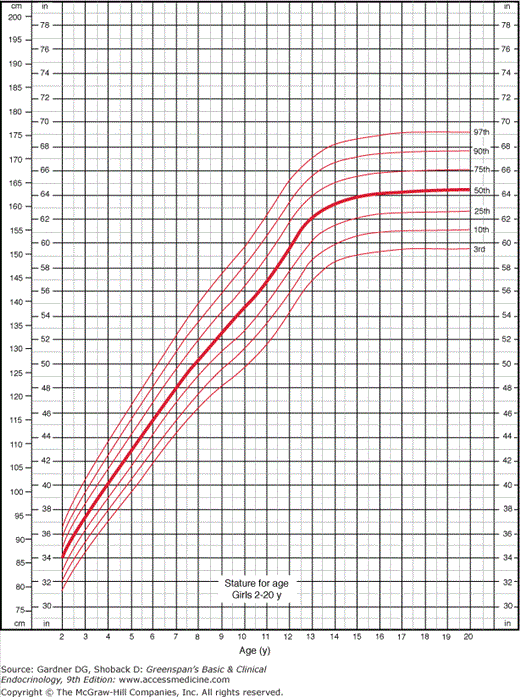
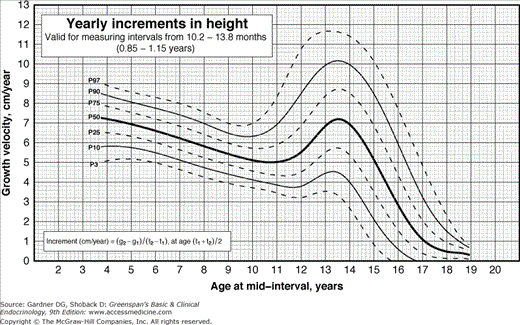
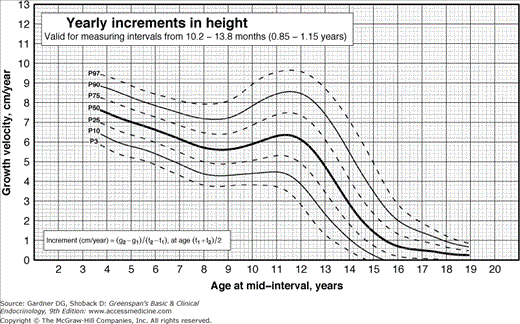
Postnatal growth in stature follows a characteristic pattern in normal children (Figures 6–1 and 6–2). The highest overall growth rate occurs in the fetus, the highest postnatal growth rate just after birth, and a slower growth rate follows in mid-childhood (Figures 6–3 and 6–4). There are two periods characterized by brief growth spurts in childhood: the infant-childhood growth spurt between 1½ years and 3 years and the mid-childhood growth spurt between 4 and 8 years. The mid-childhood growth spurt does not occur in all children, is more frequent in boys than girls, and its presence is hereditary. After another plateau, the striking increase in stature, the pubertal growth spurt follows, causing a second peak growth velocity. The final decrease in growth rate then ensues, until the epiphyses of the long bones fuse and growth ceases.
Figure 6–1
Growth chart for boys in most clinical situations showing the 3rd to the 97th percentiles. The lines for the 3rd and the 97th percentiles approximate those for −2.5 standard deviations and +2.5 standard deviations from the mean. (Redrawn from the original developed by the National Center for Health Statistics in collaboration with the National Center for Chronic Disease Prevention and Health Promotion. http://www.cdc.gov/growthcharts. Published May 30, 2000 [modified 11/21/00].)
Figure 6–2
Growth chart for girls in most clinical situations showing the 3rd to 97th percentiles. The lines for the 3rd and the 97th percentiles approximate those for −2.5 standard deviations and +2.5 standard deviations from the mean. (Redrawn from the original developed by the National Center for Health Statistics in collaboration with the National Center for Chronic Disease Prevention and Health Promotion. http://www.cdc.gov/growthcharts. Published May 30, 2000 [modified 11/21/00].)
Figure 6–3
Incremental growth charts for boys derived from Flemish children and generally applicable to the US population. Height velocity can be compared with the percentiles labeled on each curve. Increments in height are calculated over periods of no less than 10.2 months (0.85 years) and no more than 13.8 months (1.15 years) in order to avoid the effect of seasonal variation in growth and to reduce the effect of measurement error on the estimation of yearly increment in stature. The yearly increment in stature is calculated as the difference between measurements of height (g2 – g1) divided by the size of the interval (t2 – t1). This formula is also shown on the charts for yearly increments in height. It is important to plot the increments at an age which corresponds to the centre of the interval, i.e. at the age (t1 + t2)/2. (Modified from Flemish Growth Charts 2004. Accessed at http://www.vub.ac.be/groeicurven/files/2-20050604-EP2-20M.pdf)
Figure 6–4
Incremental growth charts for girls derived from Flemish children and generally applicable to the US population. Height velocity can be compared with the percentiles labeled on each curve. Increments in height are calculated over periods of no less than 10.2 months (0.85 years) and no more than 13.8 months (1.15 years) in order to avoid the effect of seasonal variation in growth and to reduce the effect of measurement error on the estimation of yearly increment in stature. The yearly increment in stature is calculated as the difference between measurements of height (g2 – g1) divided by the size of the interval (t2 – t1). This formula is also shown on the charts for yearly increments in height. It is important to plot the increments at an age which corresponds to the centre of the interval, i.e. at the age (t1 + t2)/2. (Modified from Flemish Growth Charts 2004. Accessed at http://www.vub.ac.be/groeicurven/files/2-20050604-EP2-20F.pdf.)
In addition, an adiposity rebound of accelerating weight gain and rising body mass index (BMI) occurs in early childhood after a period of relative stability of weight gain. An early adiposity rebound is a risk factor for the development of obesity later in childhood and thereafter.
As discussed in Chapter 4, somatotropin or GH is suppressed by hypothalamic GH release-inhibiting factor (somatostatin or SRIF) and stimulated by GH-releasing hormone (GHRH or GRF). The gene for GH is located on the long arm of chromosome 17 in a cluster of five genes: GHN codes for human GH (a single 191-amino-acid polypeptide chain with a molecular weight of 22 kD); GHV codes for a variant GH produced in the placenta; CSH1 and CSH2 code for prolactin; and CSHP1 codes for a variant prolactin molecule. A 20-kD variant of pituitary GH accounts for 5% to 10% of circulating GH and is derived from the same gene, GHN, but results from alternative splicing. The 22-kD variant is poorly characterized but when derived from the placental gene, GHV, in vitro it has less diabetogenic effect but similar growth-promoting and lipolytic activity.
The effects of GH are mainly mediated by the IGFs, but GH also directly stimulates lipolysis, increased amino acid transport into tissues, and increased protein and glucose synthesis in liver. It also has direct effect on cartilage growth. GH in excess causes insulin resistance and is diabetogenic. GH is secreted in a pulsatile manner, so that serum concentrations are low much of the day, but peak during short intervals. Values are higher in the immediate neonatal period, decrease through childhood, and rise again as a result of increased pulse amplitude (but not frequency) during puberty. GH secretion falls again during aging.
GH circulates in plasma bound to a protein, the GH-binding protein (GHBP), with a sequence equivalent to that of the extracellular membrane domain of the GH receptor. The physiology of the GHBP appears to reflect important interrelationships between GH and GHR in terms of effects on growth. For example, obese patients have lower plasma GH concentrations but higher GHBP levels, whereas starvation raises GH concentrations and lowers GHBP levels. Patients with abnormalities of the GH receptor (eg, Laron dwarfism) also have a defect reflected in the serum GHBP concentrations; those with decreased numbers of GH receptors have decreased serum GHBP concentrations. Patients who are unable to dimerize the GH receptors to allow activation of the complex or those who have intracellular defects in the JAK-STAT system have no alteration in GHBP concentration, but are short.
GH exerts its effects on growth mainly, but not solely, through the IGFs and their binding proteins. IGF-I and IGF-II have structures similar to that of the proinsulin molecule but differ from insulin in regulation, receptors, and biologic effects. The structure of the IGFs (originally called sulfation factor and then somatomedin), the genes responsible for their production, and information about their physiology have been elucidated. Recombinant IGF is available for clinical use and some recent studies compared the effect of a GH and IGF-I combination to see if it is more beneficial than GH treatment alone. The single copy gene for prepro-IGF-I is located on the long arm of chromosome 12. Posttranslational processing produces the 70-amino acid mature form; alternative splicing mechanisms produce structural variants of the molecule. The IGF-I cell membrane receptor (the type 1 receptor) resembles the insulin receptor in its structure consisting of two alpha and two beta chains. Binding of IGF-I to type 1 receptors stimulates tyrosine kinase activity and autophosphorylation of tyrosine residues in the receptor. This leads to cell differentiation or division (or both). IGF-I receptors are downregulated by increased IGF-I concentrations, whereas decreased IGF-I concentrations increase IGF-I receptors.
IGF molecules in the circulation are mostly bound to a 6 IGFBPs. IGFBP-1 and IGFBP-3 have been most extensively studied. IGFBP-1 is a 25-kD protein and mainly inhibits IGF-I action. Serum levels of IGFBP-1 are inversely proportional to insulin levels. This protein does not appear to be regulated by GH. It is present in high concentrations in fetal serum and amniotic fluid. Newborn serum concentrations of IGFBP-1 are inversely proportional to birth weight.
IGF-I circulates bound to IGFBP-3 and an acid labile subunit (ALS) in a 150-kD complex. Abnormalities of the ALS lead to decreased growth. Serum IGFBP-3 concentrations are directly proportional to GH concentrations but also to nutritional status. In malnutrition, IGFBP-3 and IGF-I levels fall while GH rises as does IGFBP-1. IGF-I directly regulates IGFBP-3 as well. IGFBP-3 rises with advancing age through childhood, with highest values achieved during puberty; however, the pattern of change of IGF-I at puberty is different from that of IGFBP-3. The molar ratio of IGF-I to IGFBP-3 rises at puberty, suggesting that more IGF-I is free to influence growth during this period.
IGF-I is produced in most tissues and is exported to neighboring cells to act on them in a paracrine manner or on the cell of origin in an autocrine manner. Thus, serum IGF-I concentrations may not reflect the most significant actions of this growth factor. The liver is a major site of IGF-I synthesis, and much of the circulating IGF-I probably originates in the liver; serum IGF-I concentrations vary in liver disease, falling with reductions in functional hepatic mass. IGF-I is a progression factor, so that a cell which has been exposed to a competence factor such as platelet-derived growth factor (PDGF) in stage G0 of the cell cycle and has progressed to G1 can, with IGF-I exposure in G1, undergo division in the S phase of the cell cycle. Aside from the stimulatory effects of IGF-I on cartilage growth, IGF-I has stimulatory effects on hematopoiesis, ovarian steroidogenesis, myoblast proliferation and differentiation, and differentiation of the lens.
IGF-I was in short supply until production by recombinant DNA technology became possible. IGF-I administration in clinical trials increased nitrogen retention and decreased blood urea nitrogen. In GH-resistant patients (Laron dwarfs), IGF-I stimulates growth in the absence of GH. IGF-I has recently been approved by the Food and Drug Administration (FDA) for use in short stature due to primary IGF-I deficiency. IGF-I may prove useful in treatment of various clinical conditions such as catabolic states, including the postoperative period and burns in addition to short stature, but experience is limited. GH is used in these situations by some authorities with some publications showing beneficial results.
IGF-II is a 67-amino acid peptide. The gene for prepro-IGF-II is located on the short arm of chromosome 11, close to the gene for preproinsulin. The type 2 IGF receptor preferentially binds IGF-II and is identical to the mannose 6-phosphate receptor, a single-chain transmembrane protein. Although most of the effects of IGF-II appear to be mediated by its interaction with the type 1 receptor, independent actions of IGF-II, via the type 2 receptor, have been described.
Plasma concentrations of the IGFs vary with age and physiologic condition. IGF-I concentrations are low at term in neonates and remain relatively low in childhood until a peak is reached during puberty, with values rising higher than at any other time in life. Serum IGF-I then decreases to adult levels, values higher than in childhood but lower than in puberty. With advancing age, serum GH and IGF-I levels decrease. IGF-I concentrations are more highly correlated in monozygotic twins than in same-sex dizygotic twins, indicating a genetic effect on regulation of IGF-I levels.
GH deficiency leads to lower serum IGF-I and IGF-II concentrations, whereas GH excess leads to elevated IGF-I but no rise in IGF-II above normal. Because serum IGF-I is lower during states of nutritional deficiency, IGF-I is not a perfect tool in the differential diagnosis of conditions of poor growth, which often include impaired nutritional state. IGF-I suppresses GH secretion by a negative feedback mechanism, so that patients who lack GH receptors (Laron dwarfs) or who are unable to produce IGF-I, have elevated GH concentrations but negligible IGF-I concentrations. Rare patients with poor growth who lack IGF-I receptors have elevated concentrations of IGF-I which exerts no biological activity.
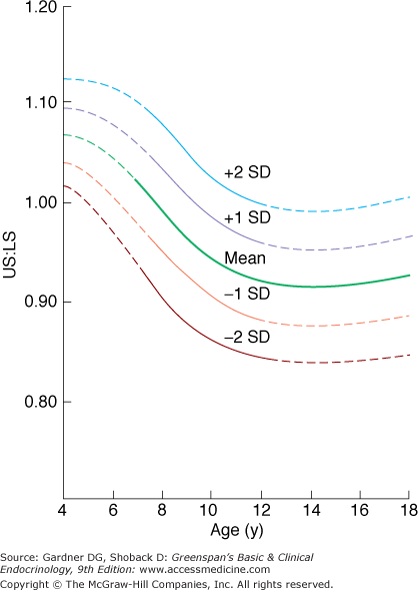
As noted above, newborns with congenital hypothyroidism are of normal length, but if untreated, they manifest exceedingly poor growth soon after birth. Infants with untreated congenital hypothyroidism suffer permanent developmental delay so early treatment is necessary. Newborn screening for congenital hypothyroidism is universal in the United States and most countries. Acquired hypothyroidism leads to a markedly decreased growth rate but no permanent intellectual defects. Bone age advancement is severely delayed in hypothyroidism, usually more so than in GH deficiency, and epiphyseal dysgenesis is seen as calcification of the epiphyses progresses. The normal decrease in the upper to lower segment ratio with age (Figure 6–5) is delayed, and therefore, the ratio is elevated, owing to poor lower limb growth in hypothyroidism.
Gonadal sex steroids exert an important influence on the pubertal growth spurt, whereas absence of these factors is not of major importance in prepubertal growth. Gonadal and adrenal sex steroids in excess can cause a sharp increase in growth rate as well as the premature appearance and progression of secondary sexual features. If unabated, increased sex steroids mediated by estrogen will cause advancement of skeletal age, premature epiphyseal fusion, and short adult stature. The pubertal rise in gonadal steroids exerts direct and indirect effects on IGF-I production. Estradiol (secreted or aromatized from testosterone) directly stimulates the production of IGF-I from cartilage and also increases GH secretion, which stimulates IGF-I production indirectly. Both actions appear important in the pubertal growth spurt.
Endogenous or exogenous glucocorticoids in excess quickly stop growth; this effect occurs more quickly than weight gain. The absence of glucocorticoids has little effect on growth if the individual is clinically well in other respects (eg, in the absence of hypotension or hypoglycemia).
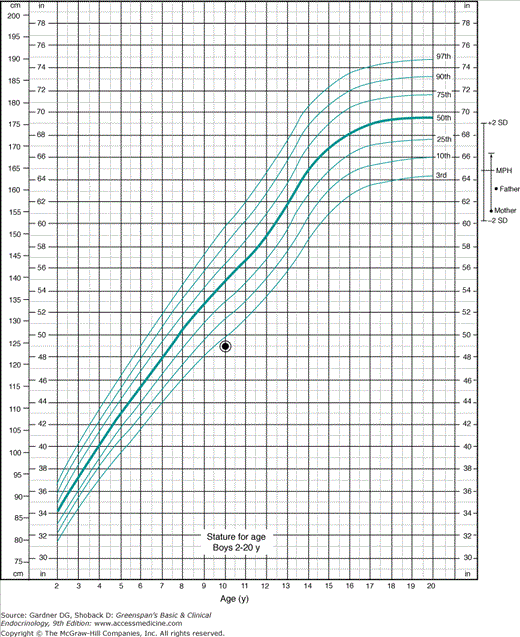
Genetic factors influence adult height. There is correlation between midparental height and the child’s height; appropriate methods to utilize this phenomenon and determine the target height for a child are presented in Figure 6–6. There is a change in growth. These effects are sex specific.
Figure 6–6
Determination of target height in a shorter family. This 10-year-old boy is 124 cm tall, his mother is 61 in tall (adults recall their heights in inches and feet but, if they are available, their height should be actually measured in centimeters), and the father is 63 in tall. Five inches are added to the mother’s height to convert her height percentile to the equivalent percentile on a boy’s chart. (If we were considering a daughter whose height is plotted on a girl’s chart, the mother’s height would be directly plotted and 5 in would be subtracted from the father’s height to correct his height percentile to the equivalent for an adult woman.) Her corrected height and that of the father are plotted at the far right of the chart where adult heights are displayed. The midparental height is calculated by adding the father’s height to the corrected mother’s height, and the sum is divided by two; the result is the target height. The limits of 2 standard deviations (SDs) above and below the target height are displayed by plotting 2 SDs (∼4 in above and below the target height). This process is equivalent to moving the 50th percentile for the US population to a conceptual 50th percentile for the family under consideration. It is evident that the height of the child, although below the third percentile for the United States, is within the bounds of the percentiles described by ±2 SD from the target height, and the child appears to fit within the genetic pattern of the family. The growth velocity and the degree of skeletal maturation are some of the factors necessary to evaluate this child in more detail.
Worldwide, the most common cause of short stature is poverty and its effects. Thus, poor nutrition, poor hygiene, and poor health influence growth both before and after birth. Parasitic infection by endemic worms is prevalent in less developed countries and severely stunts growth and depletes energy. In people of the same ethnic group and in the same geographic location, variations in stature are often attributable to socioeconomic factors. For example, Japanese individuals born and reared in North America after World War II were generally taller than Japanese-born immigrants to North America. Conversely, when factors are equal, the differences in average height between various ethnic groups are mainly genetic. The newest growth charts for children in the United States published by the Centers for Disease Control and Prevention (CDC) in 2001 are not ethnicity specific because it is believed that the major growth differences between ethnic groups are due to socioeconomic status and nutrition rather than genetic endowments. Indeed, the World Health Organization (WHO) has developed internationally relevant growth charts for all populations.
The influence of malnutrition accounts for much of the socioeconomic discrepancy in height noted above, but malnutrition may occur in the midst of plenty and must always be suspected in disorders of growth. Other factors may be blamed for poor growth when nutritional deficiencies are actually responsible. For example, Sherpas were thought to have short stature mainly because of genetic factors or the effects of high altitude living on the slopes of Mount Everest; however, nutritional supplementation increased stature in this group, demonstrating the effects of adequate nutrition. The developed world places a premium on appearance, and women portrayed as beautiful in the media are characteristically thin. Significant numbers of children, chiefly teenagers, voluntarily decrease their caloric intake even if they are not obese; this accounts for some cases of poor growth. Chronic disease, which hampers adequate nutrition, often leads to short stature. For example, bronchopulmonary dysplasia decreases growth to some degree because it increases metabolic demands, shifting nutrient usage away from growth; improved nutrition increases growth in these patients. Celiac disease is another common disorder that impairs growth, pubertal development, and bone acquisition.
Feeding problems in infants, resulting from inexperience of parents or poor child–parent interactions (maternal deprivation), may account for poor growth. Fad diets, such as poorly constructed vegan diets that put children at risk for vitamin B12 or iron deficiency, as well as major dietary manipulation, such as a severely low-fat diet, may place children at risk for deficiency of fat-soluble vitamins. Deliberate starvation of children by caregivers is an extreme form of child abuse that may be first discovered because of poor growth.
Remarkably, obesity increases IGF-I concentrations by increasing GH receptors even though GH secretion is suppressed to levels that might suggest GH deficiency. There are significant endocrine changes associated with malnutrition. Decreased GH receptors or postreceptor defects in GH action, leading to decreased production of IGF-I and decreased concentration of serum IGF-I are notable. The characteristic results of malnutrition are an elevation of serum GH and a decrease in IGF-I. IGFBP-1, a suppressor of IGF-I effects, is elevated in obesity.
Aberrant intrafamilial dynamics, psychologic stress, or psychiatric disease can inhibit growth either by altering endocrine function or by secondary effects on nutrition (psychosocial dwarfism or maternal deprivation). It is essential to diagnose those situations that might suggest organic disease states as the management approach is very different.
Many chronic systemic diseases interfere with growth independent of poor nutrition. For example, congestive heart failure and asthma, if uncontrolled, are associated with decreased stature; in some cases, adult height is in the normal range because growth continues over a longer period of time. Children of mothers with HIV infection are often small at birth and have an increased incidence of poor postnatal growth, delayed bone age development, and reduced IGF-I concentrations. In addition, thyroid dysfunction may develop, further complicating the growth pattern. Infants born of HIV-infected mothers, who are not infected themselves, may exhibit catch-up growth.
Correction of growth-retarding disorders may be temporarily followed by an abnormally high growth rate as the child approaches normal height for age. This catch-up growth occurs after initiation of therapy for hypothyroidism and GH deficiency, after correction of glucocorticoid excess, and after appropriate treatment of many chronic diseases such as celiac disease. Catch-up growth is usually short-lived and is followed by a more standard growth rate. Catch-up growth after small-for-gestational-age birth may not be beneficial as it is linked by some evidence to metabolic disease, particularly insulin resistance, in later life.
Accurate measurement of height is an essential part of the physical examination of children and adolescents. The onset of a chronic disease may often be determined by an inflection point in the growth chart. In other cases, a detailed growth chart indicates a normal constant growth rate in a child observed to be short for age. If careful growth records are kept, a diagnosis of constitutional delay in growth and adolescence or genetic short stature may be made in such a patient; without previous measurements, the child might be subjected to unnecessary diagnostic testing, or months of delay may occur as the child’s growth is finally carefully monitored. Poor measurement technique may suggest lack of growth in a child who is growing normally, subjecting the child to unnecessary testing as well.
The National Center for Health Statistics (NCHS) revised the growth charts for children in the United States in 2001 (see Figures 6–1 and 6–2). The new charts display the 3rd and 97th percentiles rather than the 5th and 95th percentiles, and SDs of height for age are also available. Charts displaying BMI by age contain data appropriate for the evaluation of obesity and underweight. All of these charts and are available online or from companies making GH or infant formulas.
But growth charts still leave 6 of 100 healthy children outside of their boundaries, with 3 of 100 below the more worrisome (to parents) lower limits of normal. It is both unnecessary and impractical to evaluate 3% of the population. Instead, the examining physician should determine which short children warrant further evaluation and which ones (and their parents) require only reassurance that they are healthy. When parents see that their child is below the third percentile and in a section of the chart colored differently from the normal area, they assume that there is a serious problem. Thus, the format of the chart can dictate parental reaction to height, because all parents want their children to be in the normal range. Figures 6–1 and 6–2 furnish data necessary to evaluate the height of children at various ages using percentiles or the SD method used by the WHO. SD determination is more useful in extremely short children below the second or first percentile.
Pathologic short stature is usually more than 3.5 SD below the mean, whereas the third percentile is only at 2 SD below the mean. However, a diagnosis of pathologic short stature should not be based on a single measurement. Serial measurements are required because they allow determination of growth velocity, which is a more sensitive index of the growth process than a single determination. A very tall child who develops a postnatal growth problem will not fall 3.5 SD below the mean in height for years but will fall below the mean in growth velocity soon after the onset of the disorder. As Figures 6–3 and 6–4 demonstrate, growth velocity varies at different ages, but as a rough guide, a growth rate of less than 5 cm/y between age 4 years and the onset of puberty is abnormal. In children under 4 years of age, normal growth velocity changes more strikingly with age. Healthy term newborns tend to be clustered in length measurements around 21 in (mostly owing to difficulties in obtaining accurate measurements).
In the ensuing 24 postnatal months, the healthy child’s height will enter a channel on the growth chart and remain there throughout childhood. Thus, a child with constitutional delay in growth or genetic short stature, whose height is at the mean at birth and gradually falls to the 10th percentile at 1 year of age and to the 5th percentile by 2 years of age, may in fact be healthy in spite of crossing percentile lines in the journey to a growth channel at the 5th percentile. Although the growth rate may decrease during these years, it should not be less than the fifth percentile for age. A steeper decrease in growth rate may be a sign of disease. Alternatively, catch-up growth after SGA birth may not be beneficial because, as stated before, it is linked by some evidence to metabolic disease, particularly insulin resistance later in life. When a question of abnormal growth arises, previous measurements are essential. Every physician treating children should record supine length (< 2 years of age) or standing height (>2 years of age) as well as weight at every office visit. As the child leaves infancy, height and growth velocity should be determined in relation to the standards for the child’s age on a graphic chart with indication of the child’s position (supine or standing) at measurement which is especially important at the time children switch from lying to standing. Failure to recognize a change in measurement technique as the child moves from lying to standing may falsely suggest a growth problem.
Patients who cannot be measured in the standing position (eg, because of cerebral palsy) require other approaches. The use of arm span is a possible surrogate for the measurement of height, and there are formulas available for the calculation of height based on the measurement of upper arm length, tibial length, and knee length (see below).
This discussion pre-supposes accuracy of measurements. However, it is reported that screening examinations in the real world fall short of that ideal. Forty-one percent of a presumably normal population screened at a school in England met the criteria for evaluation of abnormal growth (approximately two-thirds grew faster than the normal growth category and one-third were in the slower than normal category), leading to an unreasonable size of a referral population, all due to simple measuring error.
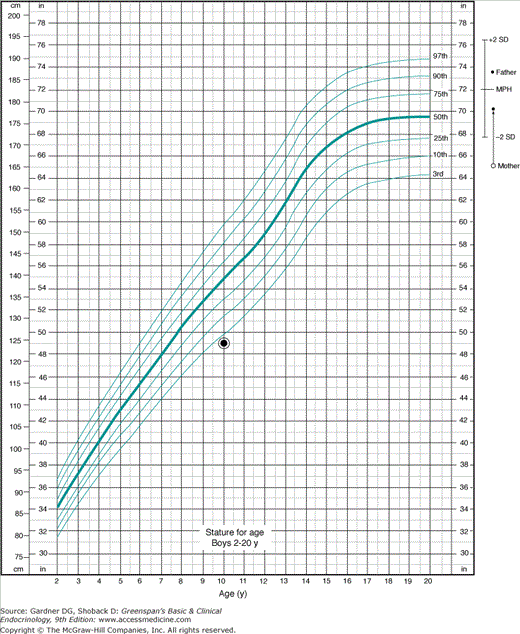
There is a positive correlation between midparental height (the average of the heights of both parents) and the stature of a child. One way to use this relationship of parents’ heights to the expected heights of children within a given family is to calculate target adult height range using parents’ heights, correcting these heights for the sex of the child and plotting the results on the child’s growth chart. There is an average 5-in difference between adult men and women in the United States. Thus, for boys, add 5 in to the mother’s height, add the result to the father’s height, and divide by 2. This is the target height, and it is expected that sons of these parents will reach a height within 2 SD of this target—or, for simplicity, within 4 in above or 4 in below the target height. (Two inches approximates 1 SD for adult stature.) For girls, subtract 5 in from the father’s height and add the result to the mother’s height and divide by 2, leading to the target height for the girl. The range for girls will also be within 4 in above and below this target. In effect, this corrects the North American growth charts for the particular family being considered. The calculated target height corresponds to the 50th percentile for the family, and the limits of the ±2 SD approximate the 5th to 95th percentile for the family. This method is useful only in the absence of disease affecting growth, and the prediction is more valid when the parents are of similar rather than of widely different heights. Figures 6–6 and 6–7 demonstrate the calculation of target height and the ranges. When there is a large discrepancy between the heights of the mother and the father, prediction of target height becomes difficult. A child may follow the growth pattern of the shorter parent more closely than the midparental height. A boy may, for example, follow the growth pattern of a short mother rather than a taller father.
Figure 6–7
Determination of target height in a taller family. This 10-year-old boy is 124 cm tall just as in Figure 6–6, his mother is 65 in tall, and the father is 73.5 in tall. Five inches are added to the mother’s height to convert her height percentile to the equivalent percentile on a boy’s chart. (If we were considering a daughter whose height is plotted on a girl’s chart, the mother’s height would be directly plotted and 5 in would be subtracted from the father’s height to correct his height percentile to the equivalent height percentile for an adult woman.) Her corrected height and that of the father are plotted at the far right of the chart where adult heights are displayed. The midparental height is calculated by adding the father’s height to the corrected mother’s height, and the sum is divided by 2; the result is the target height. The limits of 2 standard deviations (SDs) above and below the target heights are displayed by plotting 2 SDs (about 4 in. above and below the target height). This is equivalent to moving the 50th percentile for the United States population to a conceptual 50th percentile for the family under consideration. It is evident that the height of the child, which is below the third percentile for the United States, is even farther outside the bounds of the percentiles described by ±2 SD from the target height, and, thus, the child appears to fall far outside the genetic pattern of the family, and this is of clinical concern. The growth velocity and the degree of skeletal maturation are some of the other factors necessary to evaluate this analysis in more detail.
A parent who spent the growing years in poverty, with chronic disease, or in an area of political unrest might have shorter adult height, due to nutritional factors or disease, that may not be passed on to the children. Of course, the height of an adopted child will have no relationship to the adoptive parents’ heights. All of these factors must be determined by history.
Length and height must be measured accurately. Hasty measurements derived from marks made on paper at an infant’s foot and head while the infant is squirming on the paper on the examining table are useless. Infants must be measured on a firm horizontal surface with a permanently attached rule, a stationary plate perpendicular to the rule for the head, and a movable perpendicular plate for the feet. One person should hold the head stable while another makes sure the knees are straight and the feet are firm against the movable plate. Children over age 2 are measured standing up. Standing height is on the average 1.25 cm less than supine length, and it is essential to record the position of measurement each time during the change over from lying to standing height at 2 to 3 years of age; shifting from supine height at 2 years to standing height at 2½ years can falsely suggest an inadequate growth rate over that 6-month period.
These measurements cannot be accurately performed with the measuring rod that projects above the common weight scale; the rod is too flexible, and the scale footplate will in fact drop lower when the patient stands on it. Instead, height should be measured with the child standing back to the wall with heels at the wall, ankles together, and knees and spine straight against a vertical metal rule permanently attached to the wall or to a wide upright board. The child’s head is to be horizontal with the eyes looking ahead and the chin gently elevated if necessary. Height is measured at the top of the head by a sliding perpendicular plate (or square wooden block). A Harpenden stadiometer is a mechanical measuring device capable of such accurate measurement. It is preferable to measure in the metric system, because the smaller gradations make measurements more accurate by minimizing the effect of rounding off numbers.
Growth is not constant but is characterized by short spurts and periods of slowed growth. The interval between growth measurements should be adequate to allow an accurate evaluation of growth velocity. Appropriate sampling intervals vary with age but should not be less than 3 months in childhood, with a 6-month interval being optimal.
The problem of measuring the growth rate of children with orthopedic deformities or contractures is significant, because these patients may have nutritional and/or endocrine disorders as well. The measurement of knee height, tibial length, or upper arm length correlates well with standing height (r = 0.97); thus, these measurements may be translated, using special linear regression equations, into total height, which is then plotted on standard growth charts. Specialized laser-calibrated devices to measure tibial length (kneeometry) are reported to be accurate for assessment of short-term growth down to weekly intervals.
Stay updated, free articles. Join our Telegram channel

Full access? Get Clinical Tree


