Cheryl Davis and the Clinical Nutrition Department
The authors of the nutrition assessment chapters would like to acknowledge the contributions of the clinical nutrition staff over many years in developing standard guidelines.
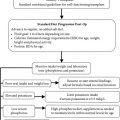
1.1.1 Weight
1. Weigh on digital or calibrated scale (infant scale: 0–36 months; standing scale >3 years).
2. Plot on age- and sex-appropriate World Health Organization (WHO) growth chart.
3. Weight-for-age: A measure for acute malnutrition.
4. Interpretation: Gómez classification (Gómez et al., 1956 ).
First-degree malnutrition
76–90% of theoretical weight for age
Second-degree malnutrition
61–75% theoretical weight for age
Third-degree malnutrition
≤60% theoretical weight for age
1.1.2 Height or Length
1. Recumbent length (up to 36 months): Measure on length board with one person at the head and one at the feet, and plot on a 0–36-month sex-appropriate WHO growth chart. Do not use a tape measure.
2. Stature (2–20 years): Measure with a stadiometer and plot on a 2–20-year sex-appropriate WHO growth chart.
3. Height-for-age: A measure for chronic malnutrition.
a. Weight at which weight-for-length is 50th percentile for age (0–36 months) or BMI is 50th-percentile BMI for age (2–20 years).
b. Weight at the 50th percentile at the age that matches the height-for-age.
2. % Ideal body weight (IBW) = Actual weight/IBW.
3. Interpretation: McLaren and Read, 1972.
Normal nutrition
90–109%
Mild malnutrition
85–89%
Moderate malnutrition
75–84%
Severe malnutrition
<75%
1.1.6 Growth Velocity or Incremental Growth
1. Detect abnormal rates of growth or weight gain before child is at extremes on growth chart; monitor efficacy of nutrition therapy.
2. Infants 0–24 months:
a. Calculate weight gain in g/day and compare to standards: See Appendix A.
b. Calculate linear growth in mm/day (cm/day × 100) and compare to standards. See Appendix B.
3. Children 2–10 years: Calculate weight gain in g/day and compare to standards listed here.
Expected Gain in Weight: >2 Years Old (Fomon et al., 1982 )
Age (years)
Weight (g/day)
Weight (g/day)
Boys
Girls
2–3
5.7
6.0
3–4
5.5
5.1
4–5
5.4
4.7
5–6
5.5
5.1
6–7
5.9
6.4
7–8
6.7
8.2
8–9
7.8
9.9
9–10
9.1
11.2
1.1.7 Specialty Growth Charts
1. Premature: Plot for gestational age until 50 weeks; then correct for prematurity on standard WHO growth charts until 24 months.
2. Charts for achondroplasia, cerebral palsy, Down syndrome, Noonan syndrome, Prader-Willi syndrome, Turner syndrome, and Williams syndrome are available. Use in conjunction with standard WHO growth charts.
a. Rapid increase in rate of growth may indicate hydrocephalus.
b. Decrease in rate of growth may indicate developmental delay; associated with malnutrition.
3. Note if patient has a shunt.
1.1.9 Arm Muscle and Fat Stores ( >12 months)
1. Use to detect serial changes in body composition; only valid when repeat measurements are made by the same observer and interpreted over time.
2. Measure mid-upper-arm circumference (AC) and triceps skin fold thickness (TSF) and calculate arm area (AA), arm muscle area (AMA), and arm fat area (AFA).
a. Calculations
AA (mm2): (AC [mm])2 ÷ 4π
AMA (mm2): (AC [mm] – πTSF)2 ÷ 4π
AFA (mm2): AA – AMA.
3. Compare to standards (limitation: data from whites only). See Frisancho (1981).
1.1.10 Clinical Evaluation
1. Nutritional status is affected not only by the nutritional intake but also by developmental status, disease states, medications, and surgical/medical procedures.
2. Symptoms that may affect adequacy of intake: Vomiting, diarrhea, constipation, dysphagia, abnormal sucking or chewing, abdominal pain/gas, respiratory distress, heart failure, renal failure, and almost any chronic disease.
3. Physical examination results:
a. Clinical signs in the malnourished child:
Marasmus: A form of severe malnutrition that occurs with total energy deficiency (i.e., “skin and bones”).
Kwashiorkor: A form of malnutrition that occurs when there is not enough protein in the diet.
Refer to Chapter 2, Section 2.10, for signs and symptoms of vitamin/ mineral deficiency or excess.
b. Hydration status:
Degrees and signs of dehydration in children (see table) (reference: Satter, 2000):
Many tests are affected by disease and fluid status, and they may not be useful for guiding nutrition therapy. Ask, “Will the results change the nutrition intervention strategy?” before requesting a test be ordered.
1. Protein indices:
a. Albumin: Affected by fluid status, infection, or inflammation; long half-life (~23 days).
b. Prealbumin, transferrin, retinal-binding protein: Depressed during stress, infection, and acute illness; shorter half-lives.
c. C-reactive protein (CRP): Elevated during stress, infection, and inflammation; may be used with other protein indices to help determine whether low protein level is due to stress or nutritional status.
2. Iron status:
a. Hemoglobin and/or hematocrit: Low only in later stages of iron deficiency anemia. May be low due to other disease states (renal failure, B12, or folate deficiency, hematologic or cancer diagnoses) even with normal iron status.
b. Ferritin: Indicative of iron status but elevated during infection or chronic inflammation.
c. Total iron-binding capacity (TIBC); percentage saturation, serum iron: Use with ferritin to assess iron status.
3. Immunologic function:
a. Total lymphocyte count: Depressed in malnutrition but also altered due to immunosuppressant drug therapy, chemotherapy or radiation, and/or trauma.
4. Vitamin/mineral/trace element status:
a. Zinc: May be low secondary to inadequate intake, increased losses, or malabsorption.
b. Vitamin A: May be low secondary to inadequate intake or fat malabsorption.
c. Vitamin D: May be low secondary to inadequate intake, inadequate supplementation of high-risk patients, and/or fat malabsorption.
5. Examples of disease or condition-specific labs in pediatric assessment:
a. Antiseizure medications: Serum calcium, phosphorus, alkaline phosphatase, and vitamin D.
b. Poor growth in infants and young children: Serum bicarbonate.
c. Phenylketonuria (PKU): Serum phenylalanine.
d. Renal failure: Serum electrolytes, calcium, phosphorus, intact parathyroid hormone.
e. Low energy needs: Selenium (to ensure adequate provision).
6. Very low-fat diet (intestinal lymphangiectasia/chylothorax) or significantly elevated triglycerides preventing adequate parenteral fat provision:
a. Check essential fatty acid profile after 2 weeks and update every 1–3 months as indicated. Interpretation provided by Mayo Clinic with lab results.
7. See total parenteral nutrition (TPN) guidelines for recommendations regarding lab monitoring for TPN patients.
1.1.12 Dietary Evaluation
1. Feeding problem history: Chronological from birth or onset of current problem.
2. Current intake:
a. Typical daily intake, food frequency, and/or food records.
b. Breast-feeding infants: Frequency and duration of feedings, how much mother obtains if/when pumps, fullness of breasts pre-and postfeedings; for hospitalized infants, use pre-and postfeeding weights.
3. Special diets:
a. Religious or cultural diet restrictions.
b. Physician-or dietitian-prescribed therapeutic diets.
c. Self-chosen lifestyle (e.g., vegetarian, milk free, etc.).
4. Food allergies.
5. Nutrient supplements.
6. Complementary medicine (self-prescribed or by alternative provider):
a. Diet
b. Herbal remedies
c. Supplements
d. Over-the-counter (OTC) products.
1.1.13 Physical Activity
1. Usual activity or exercise.
2. “Inactivity” (time spent with TV, video games, computer, reading, studying).
3. Changes in activity due to disease/condition.
1.1.14 Estimation of Nutrient Needs
1. Energy (reassess frequently to avoid over-or underfeeding):
a. Estimated energy requirement (EER) for age, sex, weight, and physical activity coefficient. EER (kcal/day) = total energy expenditure + energy deposition.
b. Basal metabolic rate × factor:
World Health Organization (WHO).
c. Basal energy expenditure (BEE) × factor (>18 years):
Harris -Benedict equation:
2. Protein (Recommended Daily Allowance [RDA] + increase or decrease for condition):
3. Fluid (start with maintenance fluid requirements and increase or decrease based on clinical condition):
4. Vitamins and minerals:
a. DRI (Dietary Reference Intake): Adequate intake or RDA + increase or decrease for condition.
b. Upper limit (UL) (tolerable upper intake levels) for safe UL.
Cheryl Davis and the Clinical Nutrition Department
1.2.1 Anthropometrics and Growth Assessment
1. Compare rate of weight gain and linear growth to expected rates for age. See the growth assessment tables in the General Pediatric Nutrition Assessment section.
a. Measure weight daily and length weekly.
2. Former premature : Correct on growth chart for prematurity until 24 months.
1.2.2 Dietary Assessment
1. 24-recall, 3-day food record or direct observation.
2. Eating behavior history:
a. Initial form of nourishment.
b. Who feeds infant?
c. Does infant feed differently for different feeders?
d. Any formula changes? What formulas specifically used, how long and why changed?
e. How long does a feeding take? How much per feeding?
f. Formula preparation?
g. Symptoms: Any diarrhea, vomiting, or constipation?
h. Any arching back during or after feeding?
i. Does milk or formula drip out of mouth while infant is feeding?
j. Is infant or mother on Women, Infants and Children (Nutritional Program) (WIC)? Does family run out of formula before next WIC appointment?
k. Have solid foods been introduced? If so, at what age?
3. Vitamin D supplementation: Per American Academy of Pediatrics (AAP) recommendations, all infants should have a supplement of 400 IU/day beginning during the first 2 months of life through childhood and adolescence unless ingesting at least 500 mL/day of vitamin D–fortified formula or milk.
4. Fluoride supplementation: Per AAP recommendations, infants ≥6 months should supplement with 0.25 mg/day in areas with <0.3 ppm fluoride concentration in community drinking supplies.
5. Expected feeding capabilities for age (see table).
6. Reference: Satter, 2000 (see table).
Only gold members can continue reading. Log In or Register to continue