Highlights
- •
Combination systemic therapies (STs) including immuno-oncologic (IO) and VEGF-inhibiting (VEGFi) agents, predominantly tyrosine kinase inhibitors (TKI), have become the standard of care for metastatic clear cell carcinoma.
- •
Treatment outcomes vary between patients treated with different STs, with no biomarkers available to help tailor treatment regimens.
- •
We investigate Prostate Specific Membrane Antigen (PSMA), a known biomarker in prostate cancer, and marker of tumor neovasculature in several cancers including ccRCC, as a predictor of ccRCC response to TKI and IO/VEGFi
- •
We found that the expression of FOLH1, the gene underlying PSMA, correlates with neoangiogenesis in m-ccRCC. FOLH1 expression was also significantly associated with progression-free survival in m-ccRCC patients treated with sunitinib TKI.
- •
Our findings suggest that PSMA PET could be explored as a noninvasive biomarker for guiding CST choice (IO/IO or IO/VEGFi combination) as well as prediction of treatment response to TKI monotherapy in m-ccRCC patients.
Abstract
Purpose
Combination systemic therapies (CSTs) of immuno-oncologic (IO) and VEGF-inhibiting agents (VEGFi) have become the standard of care for management of metastatic clear cell renal cell carcinoma (m-ccRCC). However, treatment outcomes vary between patients, with no established biomarkers to determine optimal CST regimens (IO/IO or IO/VEGFi). Prostate Specific Membrane Antigen (PSMA), encoded by the FOLH1 gene, is a marker of tumor neovasculature in ccRCC, the downstream target of VEGFi. We evaluated the relation between FOLH1 expression and angiogenesis, as well as clinical outcomes, in 5 m-ccRCC ST trials.
Materials and Methods
using Spearman’s rank correlation (SPRC) test, we assessed the correlation between FOLH1 expression and gene expression signature (GES) scores corresponding to angiogenic and immunologic features of the tumor microenvironment (TME) of m-ccRCC in our trial cohorts. Using Cox proportional hazard regression (Cox-PHR), we assessed the association between FOLH1 expression level, summarized by within-study quantiles (qFOLH1), and progression-free and overall survival (PFS, OS).
Results
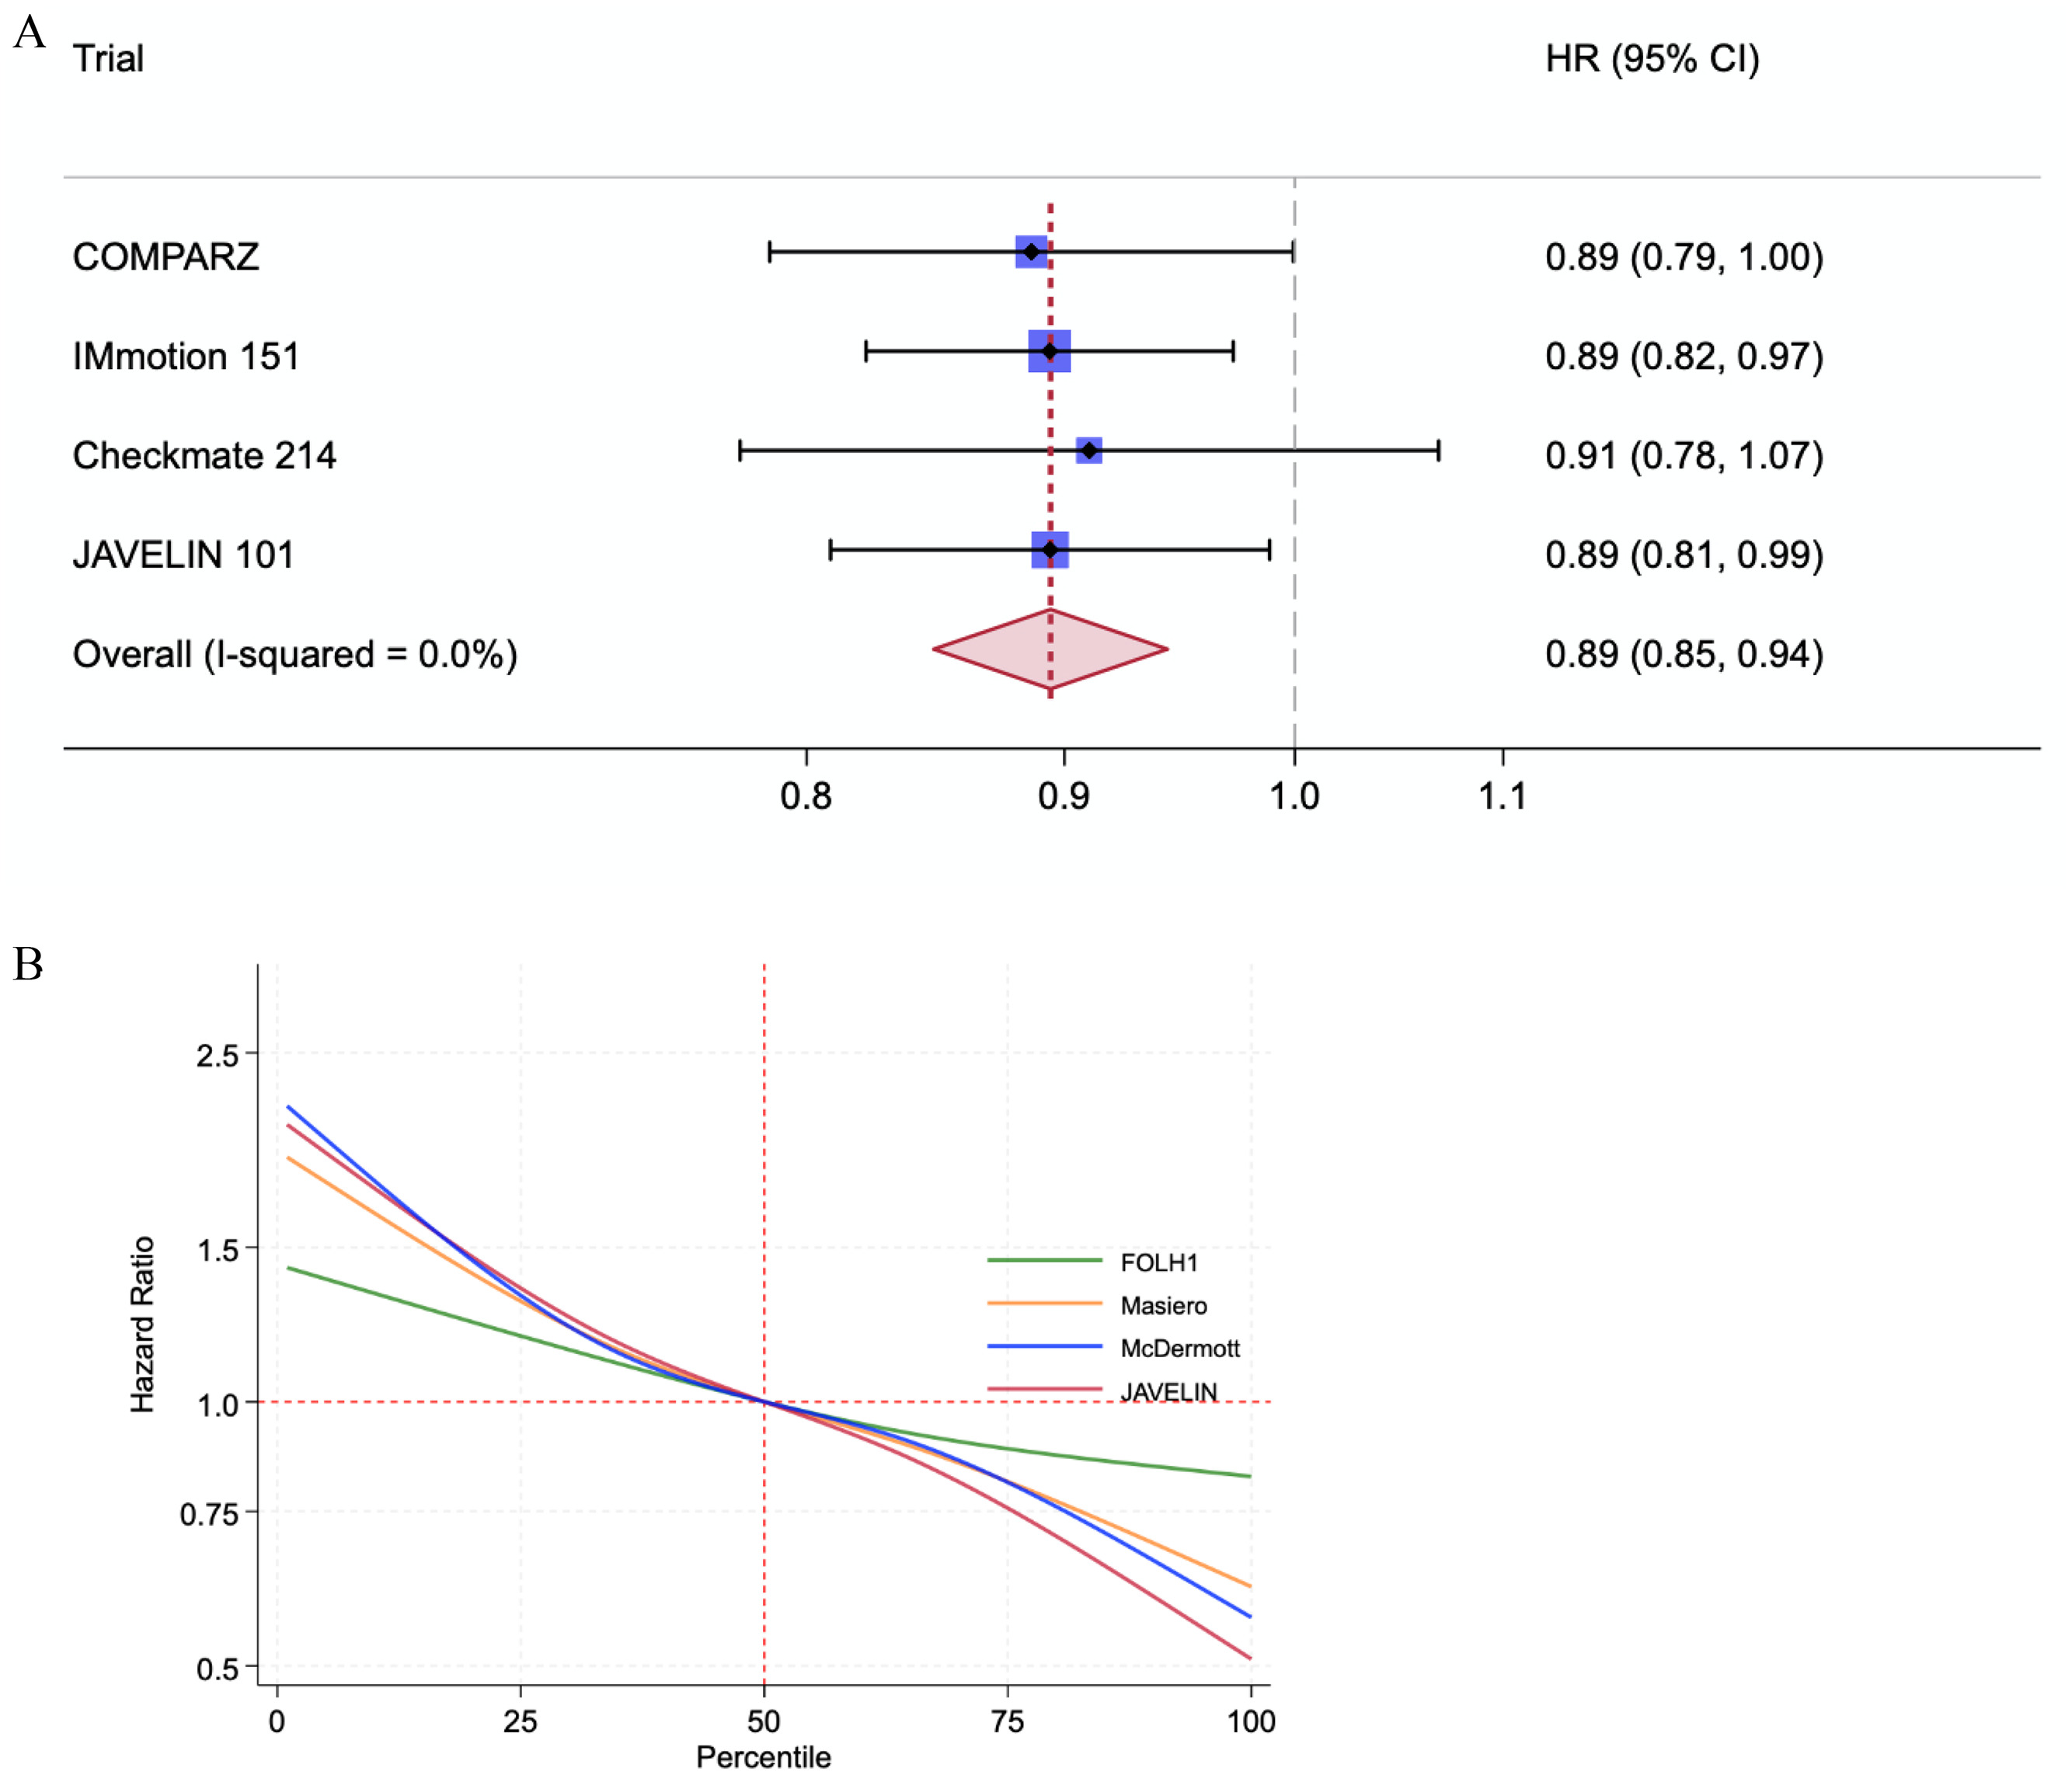
Increased FOLH1 expression was significantly associated with higher TME angiogenesis GES scores (SPRC +0.5, P < 0.001), but did not consistently correlate with immune feature GES scores. Meta-analysis of PFS in the sunitinib TKI arm of trial cohorts showed an overall positive association with qFOLH1 (HR = 0.89; 95% CI = 0.85-0.94, P < 0.0001). qFOLH1 was not significantly associated with OS in the sunitinib arms of the two trials with OS data (COMPARZ, HR 0.87, 95% CI 0.71–1.07, P = 0.17; and Checkmate-214, HR 0.89, 95% CI 0.67–1.17, P = 0.70).
Conclusions
PSMA – encoding FOLH1 gene expression correlates with neoangiogenesis and predicts PFS in m-ccRCC patients treated with sunitinib TKI, suggesting that PSMA PET could be explored as a noninvasive biomarker for guiding CST choice (IO/IO or IO/VEGFi) as well as prediction of treatment response to VEGFi in m-ccRCC patients.
1
Introduction
Combination systemic therapies (STs) have become the standard of care for management of metastatic clear cell renal cell carcinoma (ccRCC) [ ], consisting of an immuno-oncologic agent (IO) backbone with either (1) a targeted VEGF-inhibiting agent (VEGFi), usually tyrosine kinase inhibitors (TKI), or (2) another IO agent [ ]. While these regimens have shown objective response rates >50% in IO/VEGFi trials and durable response rates in IO/IO trials [ ] , individual patient response may vary considerably, and no biomarkers currently exist to identify the optimal treatment regimen (IO/IO or IO/VEGFi) that would maximize efficacy for the individual patient while minimizing the adverse effects associated with these regimens [ , ]. The same issue is encountered with IO and TKI monotherapy [ ].
In this regard, recent research has highlighted the role of tumor microenvironment (TME) features, such as immune infiltration and angiogenesis, as a potential biomarker for therapeutic response in Mrcc [ ]. TME features can be predicted through gene expression signature scores (GESs), calculated from transcriptomic microarray or RNA-sequencing analyses of tumor tissue [ , , ]. However, GESs are inherently invasive biomarkers that require tissue sampling and complex translational infrastructures, limiting their applicability in clinical practice.
A well-studied, noninvasive, clinically available biomarker that has recently garnered interest as a potential diagnostic target in RCC is prostate-specific membrane antigen (PSMA), a transmembrane protein coded by the FOLH1 gene [ ]. While PSMA is mostly known and studied in the field of advanced prostate cancer, it is expressed in tumor neovasculature of several cancers, including RCC, where PSMA is most expressed by the clear-cell subtype [ ]. Given this association with neoangiogenesis in ccRCC, a target of VEGFi-based STs, we sought to evaluate the relationship between PSMA FOLH1 gene expression and TME behavior, particularly angiogenesis, as well as survival outcomes in m-ccRCC, using data from several published large-scale ST trials in ccRCC. We hypothesized that tumors with high FOLH1 expression exhibit a highly angiogenic TME, which may predict a better response to antiangiogenic therapies.
2
Methods
We analyzed data from published molecular analyses [ , ] of patients enrolled in the COMPARZ [ ], IMmotion 150 (IM-150) [ ], IMmotion 151 (IM-151) [ ], Checkmate 214 (CM-214) [ ], and JAVELIN RENAL 101 (JR-101) [ ] trials ( Table 1 ); Only patients with corresponding transcriptomic profiling through micro-array or bulk RNA-sequencing were included. In addition, we analyzed data from an institutional cohort of 28 surgically resected ccRCC tumors that had undergone multi-regional sampling followed by bulk RNA sequencing as previously described (MRS cohort) [ ].
| Patient Demographic and Clinical Features in Transcriptomic Dataset | ||||||
|---|---|---|---|---|---|---|
| Trial | Therapeutic Agents | Main Clinical Outcomes | Transcriptomics Dataset Size and Original Trial Dataset Size | Median Age and IQR | % Female Gender | Risk Group at Time of Diagnosis |
| COMPARZ | Pazopanib vs. Sunitinib | OS, PFS | 412 of 1,110 a | 62 (55.0–77.0) | 25% | IMDC Favorable: 26% Intermediate: 55% Poor: 17% Unknown: 2.4% |
| IMmotion 150⊺ | Atezolizumab/Bevacizumab vs. Atezolizumab vs. Sunitinib | ORR, PFS b in PDL1 Positive and ITT Population | 263 of 305 | Not Available | Not Available | MSKCC Favorable: 22% Intermediate: 69% Poor: 8.7% Unknown 0.3% |
| IMmotion 151 | Atezo/Bev vs. Sunitinib | PFS in PDL1-Positive patients, OS in ITT Population b | 823 of 915 | 61 (55–67) | 28% | IMDC Favorable: 21% Intermediate: 62% Poor: 16% Unknown: 1% |
| Checkmate 214 | Nivo/ipi vs. Sunitinib | OS, ORR b , PFS | 167 of 941 | 63.5 (57–68) | 26% | IMDC Favorable: 22% Intermediate: 56% Poor: 22% |
| JAVELIN RENAL 101 | Avelumab/Axitinib vs. Sunitinib | OS b , ORR b , PFS | 726 of 886 | 61 (54–67) | 25% | Not available |
b Outcome not available for analysis in this study; ⊺ Phase II trial.
2.1
TME deconvolution and GES calculation
Expression levels of FOLH1 and other genes were calculated from log2-normalized gene levels for micro-array data for the COMPARZ trial; or as transcripts per kilobase million (TPM) values, computed from gene-level counts for the other 4 trials and the MRS cohort. Deconvolution analyses for TME profiling of tumor samples from gene expression data in the trial and MRS cohorts were performed using the GSVA [ ] implementation of the single-sample gene-set enrichment analysis (ssGSEA) method [ ] in the R statistical package [ ], utilizing an assortment of published GESs and composite GES scores for TME deconvolution in ccRCC, including 3 angiogenesis GESs [ , , ]. The ESTIMATE [ ] algorithm R implementation was used to infer immune and stromal cell scores within tumor tissue. Calculated GES and ESTIMATE scores were z-score–normalized across the samples for each dataset.
2.2
Statistical analysis
Spearman’s rank correlation was used to correlate FOLH1 expression levels with immune and angiogenesis TME GES scores in the trial datasets, and with CD31 level on immunofluorescence (IF) staining in the IM-150 cohort. Correlation of FOLH1 expression and angiogenesis GES scores with oncologic outcomes across trial datasets was assessed using univariable Cox proportional hazard regression (Cox-PHR) within-study quantile FOLH1 level (qFOLH1) and angiogenesis GES score quantiles.
All statistical analyses were performed using R statistical package v 4.2 19 and Stata v16.0MP [ ].
Meta-analysis of hazard ratios across the 4 studies describing the association between qFOLH1 and progression-free survival (PFS) was derived by a two-stage fixed-effects meta-analysis of individual patient data, using the ipdmetan command in Stata v16.0MP. Correlation between the Cox-PHR hazard ratio for PFS and percentile of FOLH1 and angiogenesis GES levels was explored by entering the FOLH1 and GES level percentile into a Cox regression as a restricted cubic spline for all patients. This was combined using the xblc command in Stata v16.0MP.
3
Results
3.1
FOLH1 expression is associated with angiogenesis gene expression signature
We analyzed transcriptomic data from 5 trials of TKI monotherapies or combination STs with sunitinib as the standard-of-care comparator arm in patients with ST-naïve advanced ccRCC [ , , ]. Each trial had corresponding and subsequently published transcriptomic analyses [ , , , , , ]. Table 1 highlights the original study protocols and key clinical features of each study. Specifically, using Spearman’s rank correlation, we examined the correlation between FOLH1 expression and TME features inferred through GES scores calculated using the ssGSEA method [ ] as well as the ESTIMATE algorithm [ ]. Examined GESs included 3 published angiogenesis GESs in advanced ccRCC: Masiero_angio, McDermott_angio, and JAVELIN_angio.
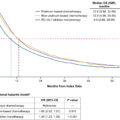
We noted a robust and moderate to strong positive correlation (Spearman coefficient 0.3–0.72) between FOLH1 expression and angiogenesis GES scores across all studies, a finding that consistently reached statistical significance ( P < 0.001 for all signatures across the 5 trial datasets; Fig. 1 ). FOLH1 expression was also significantly associated with surface expression of the endothelial marker CD31 (PECAM-1) on IF staining in the IM-150 cohort (Spearman coefficient: 0.26, P < 0.001).
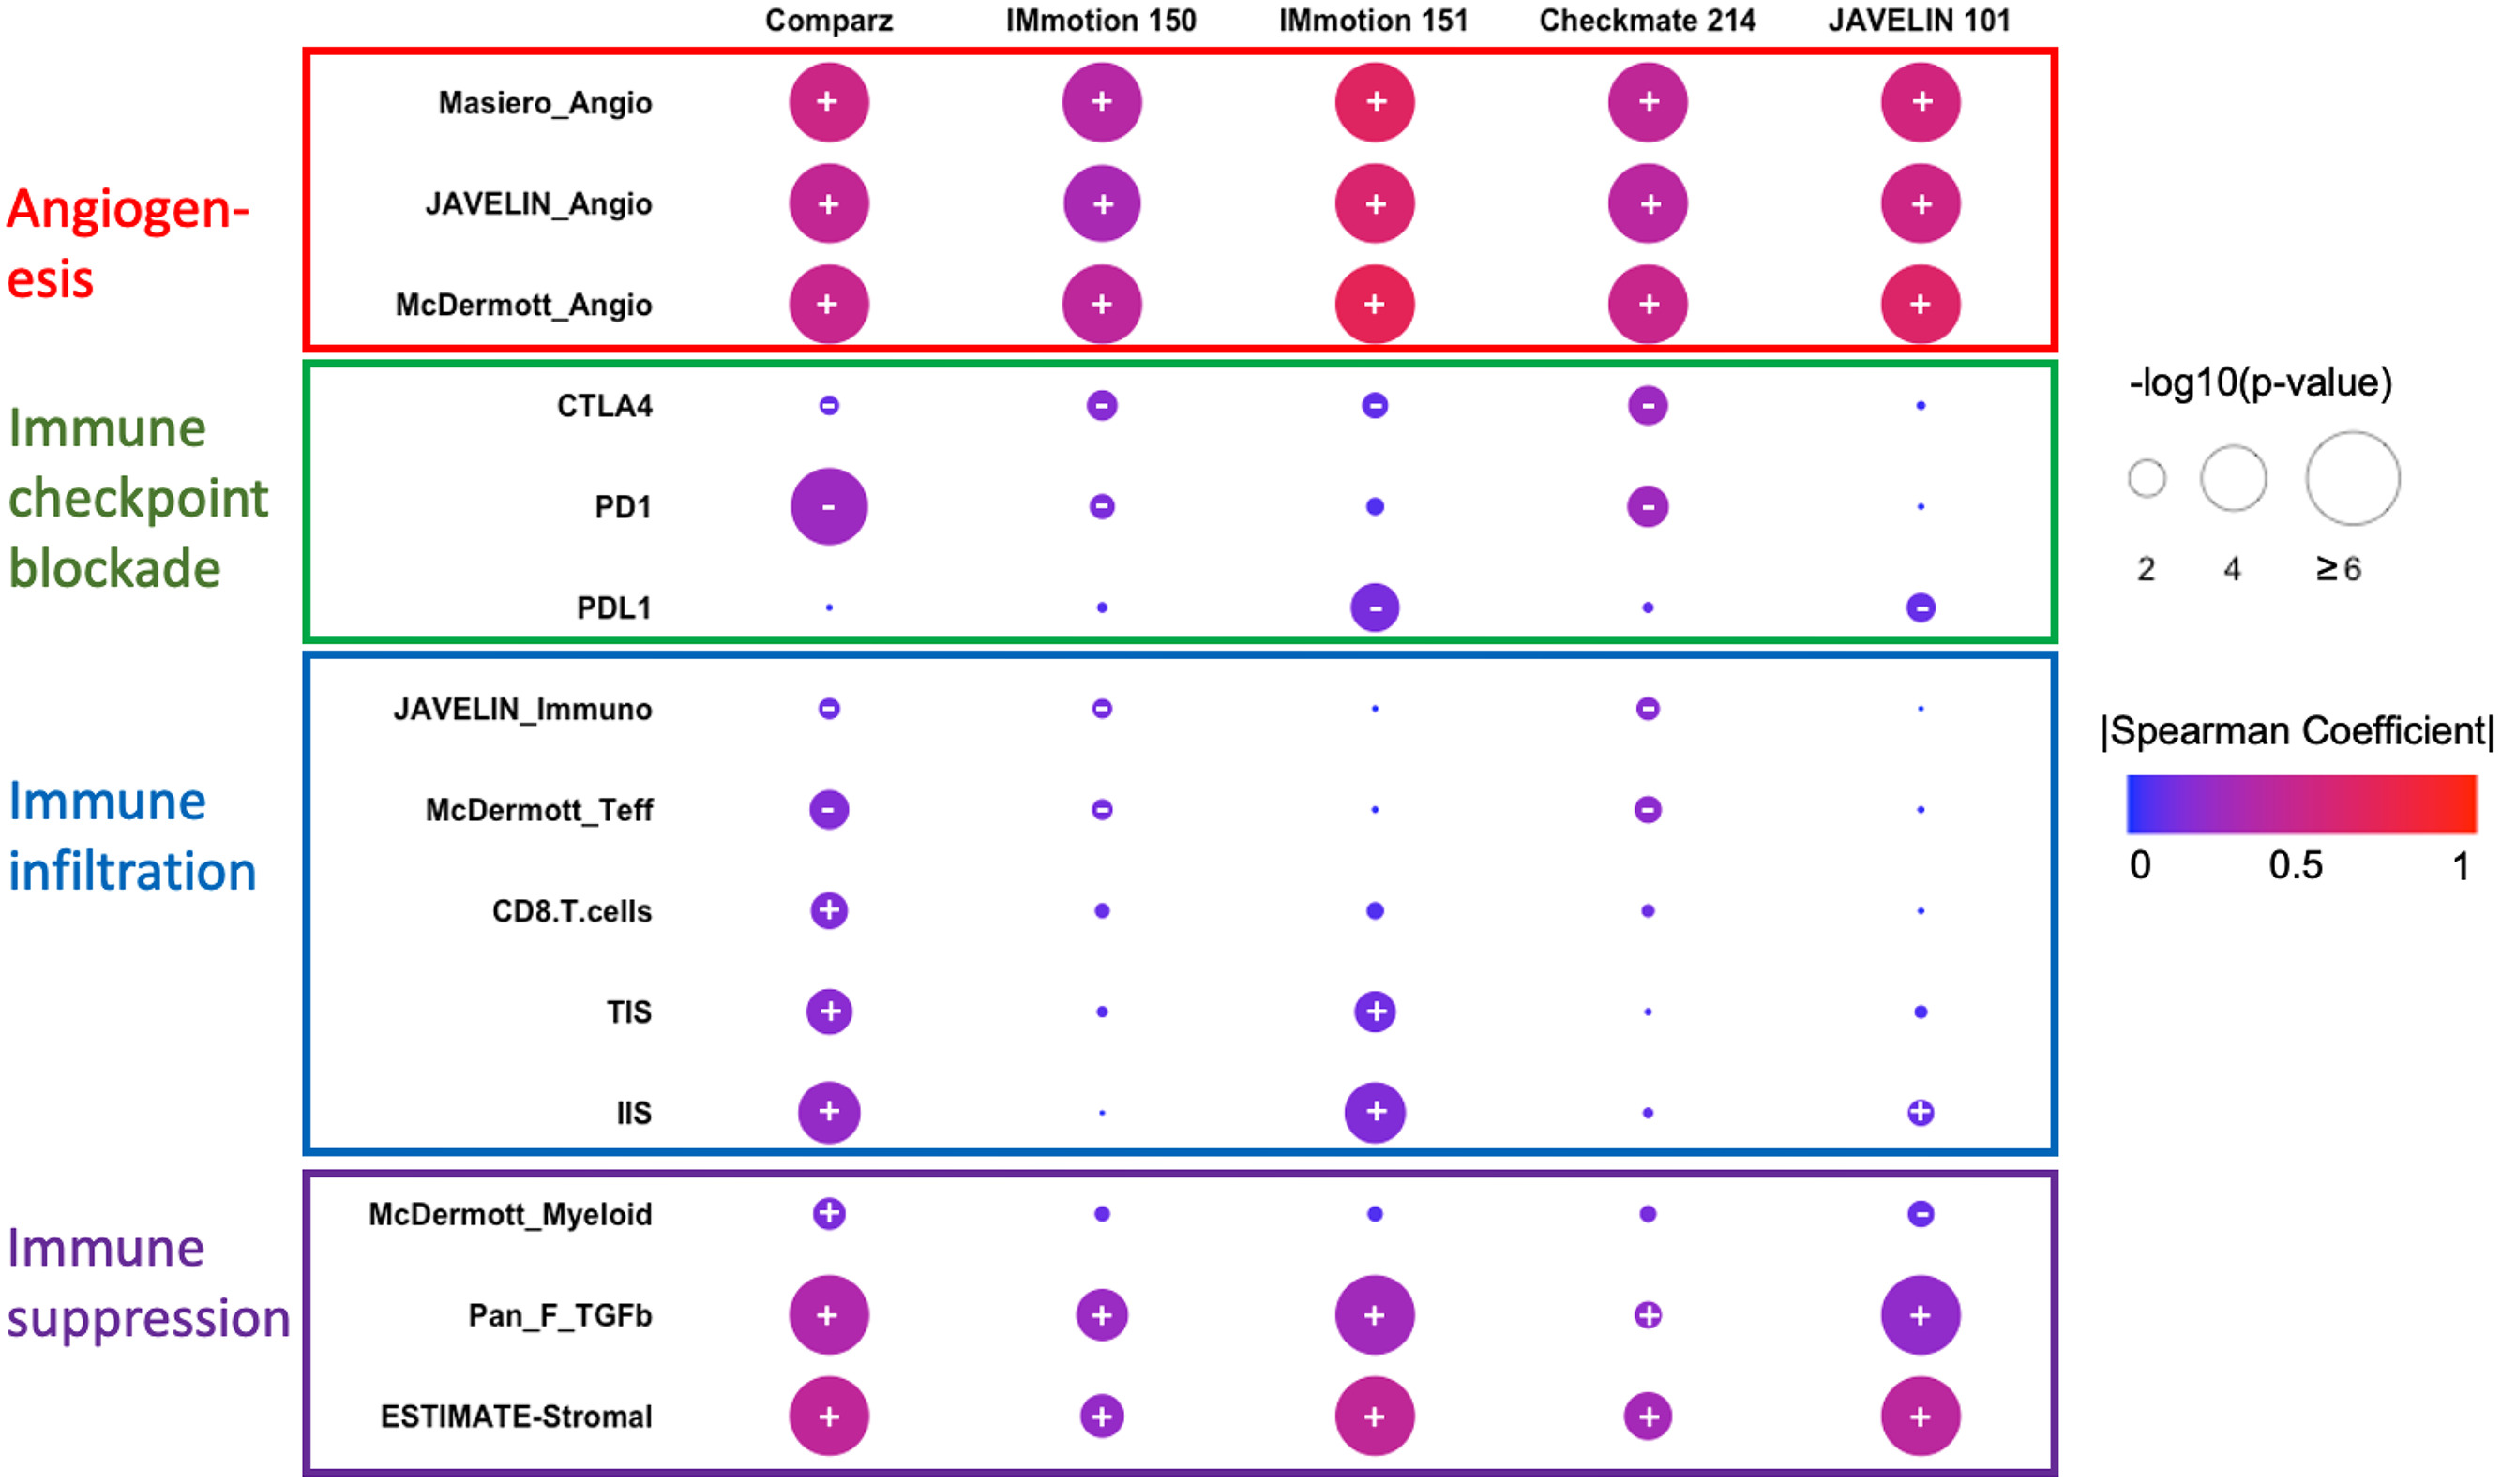
In contrast, a weak and inconsistent correlation (Spearman coefficient < 0.2, P = 0.01–1.0) was identified between FOLH1 and immune-checkpoint molecule expression (PD1, PDL1, CTLA4), as well as immune-infiltration GES scores ( Fig. 1 ) such as McDermott_Teff [ ], CD8.T.cells [ ], JAVELIN_immune [ ], and TIS/IIS [ ]. However, we noted a consistent weak-moderate but positive correlation (Spearman coefficient 0.2–0.4, P < 0.01) with Pan_F_TGFB [ ] and ESTIMATE-stromal [ ] signatures, which have been associated with tumor-associated macrophage (TAM)–mediated immunosuppression and worse outcomes in ccRCC [ , ].
3.2
FOLH1 expression is associated with response to tyrosine-kinase inhibitors in ccRCC
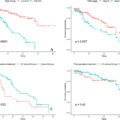
High TME angiogenesis levels inferred by the above angiogenesis GESs have been associated with improved survival outcomes in the sunitinib arms of COMPARZ, IM-151, and JR-101, respectively [ , , ]. We asked whether FOLH1 expression, measured by within-study quantile FOLH1 expression level (qFOLH1), could also predict PFS and/or OS in the 4 cohorts for which survival outcome data was available (COMPARZ, IM-151, CM-214, and JR-101). On univariable Cox-PHR, we found qFOLH1 levels to be associated with improved PFS in 4 of 4 cohorts and improved OS in 2 of 2 cohorts. This association met the conventional P ≤ 0.05 cutoff for statistical significance for PFS in COMPARZ (HR = 0.88, 95% CI = 0.78–1, P = 0.05), IM-151 (HR = 0.89; 95% CI = 0.82–0.97, P = 0.004) and JR-101 (HR = 0.89; 95% CI = 0.81–0.99, P = 0.03) but not CM-214 (HR = 0.92, 95% CI = 0.78–1.1, P = 0.34). Meta-analysis of qFOLH1 correlation with PFS in all 4 cohorts showed an overall association with improved PFS (HR = 0.89; 95% CI = 0.85–0.94, P < 0.0001; Fig. 2 A). The association between 3 angiogenesis GESs and PFS in these cohorts mirrored those of FOLH1 expression, with significant association between within-study quantile scores for GES and PFS in the sunitinib arms of COMPARZ, IM-151, and JR-101 ( P < 0.05), but not for PFS in the CM-214 cohort, except for JAVELIN_angio (HR = 0.82, 95% CI 0.70–0.97, P = 0.02 for PFS in CM-214). Overall associations between FOLH1 expression and angiogenesis scores with PFS in the sunitinib arms of the combined cohorts are shown in Fig. 2 B and Fig. 1 , showing a similar overall trend of improved PFS with higher FOLH1 expression and GES scores.
Related posts:
 Optimal imaging techniques across the spectrum of testicular cancer
 Defining the genetic profile of prostate cancer
 Real-world survival and economic burden among patients with locally advanced or metastatic urothelial carcinoma in the United States
 The value of a postoperative nomogram based on the primary tumor score for overall survival of patients with renal cell carcinoma and inferior vena cava tumor thrombus
 Germline genetic testing for prostate cancer: Ordering trends in the era of expanded hereditary cancer screening recommendations
 Navigating the gray zone: Machine learning can differentiate malignancy in PI-RADS 3 lesions
Stay updated, free articles. Join our Telegram channel

Full access? Get Clinical Tree


