Frequency


Frequency


Here, it is necessary to count.

—P.C.A. Louis 1787-1872*


Chapter 1 outlined the questions that clinicians need to answer as they care for patients. Answers are usually in the form of probabilities and only rarely as certainties. Frequencies obtained from clinical research are the basis for probability estimates for the purposes of patient care. This chapter describes basic expressions of frequency, how they are obtained from clinical research, and how to recognize threats to their validity.


Decisions such as the one this patient and clinician face have traditionally relied on clinical judgment based on experience at the bedside and in the clinics. In modern times, clinical research has become sufficiently strong and extensive that it is possible to ground clinical judgment in research-based probabilities—frequencies. Probabilities of disease, improvement, deterioration, cure, side effects, and death are the basis for answering most clinical questions. For this
patient, sound clinical decision making requires accurate estimates of how his symptoms and complications of treatment will change over time according to which treatment is chosen.


ARE WORDS SUITABLE SUBSTITUTES FOR NUMBERS?

Clinicians often communicate probabilities as words (e.g., usually, sometimes, rarely) rather than as numbers. Substituting words for numbers is convenient and avoids making a precise statement when one is uncertain about a probability. However, words are a poor substitute for numbers because there is little agreement about the meanings of commonly used adjectives describing probabilities.


Patients also assign widely varying probabilities to word descriptions. In another study, highly skilled and professional workers outside of medicine thought “usually” referred to probabilities of 35% to 100%; “rarely” meant to them a probability of 0% to 15% (3).

Thus, substituting words for numbers diminishes the information conveyed. We advocate using numbers whenever possible.


PREVALENCE AND INCIDENCE

In general, clinically relevant measures of frequency are expressed as proportions, in which the numerator is the number of patients experiencing an event (cases) and the denominator is the number of people in whom the event could have occurred (population). The two basic measures of frequency are prevalence and incidence.


Prevalence

Prevalence is the fraction (proportion or percent) of a group of people possessing a clinical condition or outcome at a given point in time. Prevalence is measured by surveying a defined population and counting the number of people with and without the condition of interest. Point prevalence is measured at a single point in time for each person (although actual measurements need not necessarily be made at the same point in calendar time for all the people in the population). Period prevalence describes cases that were present at any time during a specified period of time.


Incidence

Incidence is the fraction or proportion of a group of people initially free of the outcome of interest that develops the condition over a given period of time. Incidence refers then to new cases of disease occurring in a population initially free of the disease or new outcomes such as symptoms or complications occurring in patients with a disease who are initially free of these problems.

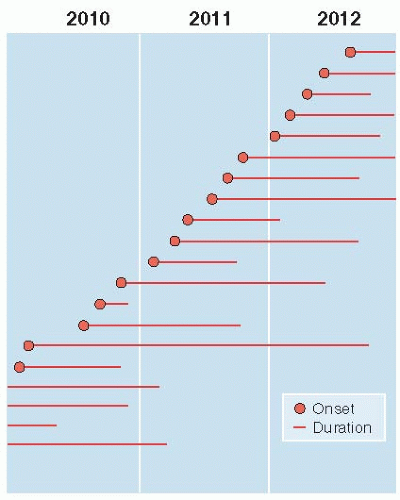
Figure 2.1 illustrates the differences between incidence and prevalence. It shows the occurrence of
lung cancer in a population of 10,000 people over the course of 3 years (2010-2012). As time passes, individuals in the population develop the disease. They remain in this state until they either recover or die—in the case of lung cancer, they usually die. Four people already had lung cancer before 2010, and 16 people developed it during the 3 years of observation. The rest of the original 10,000 people have not had lung cancer during these 3 years and do not appear in the figure.


Figure 2.1 ▪ Incidence and prevalence. Occurrence of disease in 10,000 people at risk for lung cancer, 2010 to 2012.

To calculate prevalence of lung cancer at the beginning of 2010, four cases already existed, so the prevalence at that point in time is 4/10,000. If all surviving people are examined at the beginning of each year, one can compute the prevalence at those points in time. At the beginning of 2011, the prevalence is 5/9,996 because two of the pre-2010 patients are still alive, as are three other people who developed lung cancer in 2010; the denominator is reduced by the 4 patients who died before 2011. Prevalence can be computed for each of the other two annual examinations and is 7/9,992 at the beginning of 2011 and 5/9,986 at the beginning of 2012.

To calculate the incidence of new cases developing in the population, we consider only the 9,996 people free of the disease at the beginning of 2010 and what happens to them over the next 3 years. Five new lung cancers developed in 2010, six developed in 2011, and five additional lung cancers developed in 2012. The 3-year incidence of the disease is all new cases developing in the 3 years (16) divided by the number of susceptible individuals at the beginning of the follow-up period (9,996), or 16/9,996 in 3 years. What are the annual incidences for 2010, 2011, and 2012? Remembering to remove the previous cases from the denominator (they are no longer at risk of developing lung cancer), we would calculate the annual incidences as 5/9,996 in 2010, 6/9,991 in 2011, and 5/9,985 in 2012.


Table 2.1 Characteristics of Incidence and Prevalence


a. Characteristic


b. Incidence


c. Prevalence


Numerator


New cases occurring during a period of time among a group initially free of disease


Existing cases at a point or period of time


Denominator


All susceptible people without disease at the beginning of the period


All people examined, including cases and non-cases


Time


Duration of the period


Single point or period


How measured


Cohort study (see Chapter 5)


Prevalence (cross-sectional) study


Prevalence and Incidence in Relation to Time

Every measure of disease frequency necessarily contains some indication of time. With measures of prevalence, time is assumed to be instantaneous, as in a single frame from a motion picture film. Prevalence depicts the situation at that point in time for each patient, even though it may, in reality, have taken several months to collect observations on the various people in the population. However, for incidence, time is the interval during which susceptible people were observed for the emergence of the event of interest. Table 2.1 summarizes the characteristics of incidence and prevalence.

Why is it important to know the difference between prevalence and incidence? Because they answer two entirely different questions: on the one hand, “What proportion of a group of people has a condition?”; and on the other, “At what rate do new cases arise in a defined population as time passes?” The answer to one question cannot be obtained directly from the answer to the other.

RELATIONSHIPS AMONG PREVALENCE, INCIDENCE, AND DURATION OF DISEASE

Anything that increases the duration of disease increases the chances that the patient will be identified in a prevalence study. Another look at Figure 2.1 will confirm this. Prevalent cases are those that remain affected, to the extent that patients are cured, die of their disease, or leave the population under study, they are no longer a case in a prevalence survey. As a result, diseases of brief duration will be more likely to be missed by a prevalence study. For example, 15% of all deaths from coronary heart disease occur outside the hospital within an hour of onset and without prior symptoms of heart disease. A prevalence
study would, therefore, miss nearly all these events and underestimate the true burden of coronary heart disease in the community. In contrast, diseases of long duration are well represented in prevalence surveys, even when their incidence is low. The incidence of inflammatory bowel disease in North America is only about 2 to 14 per 100,000/year, but its prevalence is much higher, 37 to 246/100,000, reflecting the chronic nature of the disease (4).

The relationship among incidence, prevalence and duration of disease in a steady state, in which none of the variables is changing much over time, is approximated by the following expression:

Prevalence = Incidence × Average

duration of the disease

Alternatively,

Prevalence/Incidence = Duration


Table 2.2 Some Commonly Used Rates


Case fatality rates


Proportion of patients who die of a disease


Complication rate


Proportions of patients who suffer a complication of a disease or its treatment


Infant mortality rate


Number of deaths in a year of children <1 year of age Number of live births in the same year


Perinatal mortality rate (World Health Organization definition)


Number of stillbirths and deaths in the first week of life per 1,000 live births


Maternal mortality rate


Number of maternal deaths related to childbirth in a given year Number of live births in the same population during the same year


Similarly, the prevalence of prostate cancer on autopsy is so much higher than its incidence that the majority of these cancers must never become symptomatic enough to be diagnosed during life.


SOME OTHER RATES

Table 2.2 summarizes some rates used in health care. Most of them are expressions of events over time. For example, a case fatality rate (or alternatively, the survival rate) is the proportion of people having a disease who die of it (or who survive it). For acute diseases such as Ebola virus infection, follow-up time may be implicit, assuming that deaths are counted over a long enough period of time (in this case, a few weeks) to account for all of them that might have occurred. For chronic diseases such as cardiovascular disease or cancer, it is more usual to specify the period of observation (e.g., the 5-year survival rate). Similarly, complication rate, the proportion of people with a disease or treatment who experience complications, assumes that enough time has passed for the complications to have occurred. These kinds of measures can be underestimations if follow-up is not really long enough. For example, surgical site infection rates have been underreported because they have been counted up to the time of hospital discharge, whereas some wound infections are first apparent after discharge (6).

Other rates, such as infant mortality rate and perinatal mortality rate (defined in Table 2.2) are approximations of incidence because the children in the numerator are not necessarily those in the denominator. In the case of infant mortality rate for a given year, some of the children who die in that year were born in the previous year; similarly, the last children to be born in that year may die in the following year. These rates are constructed in this way to make measurement more feasible, while providing a useful approximation of a true rate in a given year.


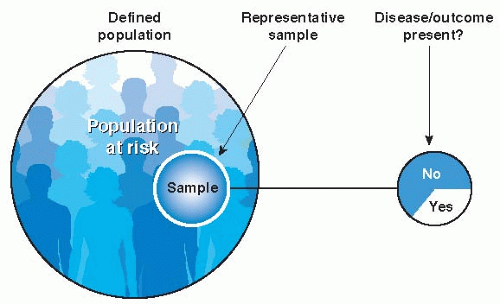
Figure 2.2 ▪ The design of a prevalence study.


STUDIES OF PREVALENCE AND INCIDENCE

Prevalence and incidence are measured by entirely different kinds of studies.


Prevalence Studies

In prevalence studies, people in a population are examined for the presence of the condition of interest. Some members of the population have the condition at that point in time, whereas others do not (Fig. 2.2). The fraction or proportion of the population that has the condition (i.e., cases) constitutes the prevalence of the disease.

Another term for prevalence studies is cross-sectional studies because people are studied at a “cross-section” of time. Prevalence studies are also called surveys if the main measurement is a questionnaire.

The following is an example of a typical prevalence study.

Jul 5, 2016 | Posted by in INFECTIOUS DISEASE | Comments Off on Frequency

Full access? Get Clinical Tree

Get Clinical Tree app for offline access