Highlights
- •
FOXP3/TLS elevation is a good prognostic and predictive marker in all non-muscle invasive bladder cancer cases and in the subgroup receiving BCG.
- •
Elevation of FOXP3-TLS, TIM-3-TLS, and TIM-3/TLS is associated with longer RFS in patients receiving BCG.
- •
Combined TIM-3 and FOXP3 elevation is indicative of a low recurrence rate in NMIBC.
Abstract
Objective
Bladder carcinoma (BC) is a common type of cancer. Approximately 20% of BC patients have non-muscle invasive bladder cancer (NMIBC). Despite adequate BCG treatment, recurrence occurs in approximately 40% of the patients. There is no adequate prognostic marker for recurrence in a group of patients. Forkhead box P3 (FOXP3) is a regulatory T cell marker that sometimes exhibits anti-tumoral effects and can be used as a tumor marker. T-cell immunoglobulin and mucin domain 3 (TIM-3) is an immune checkpoint inhibitor of T cells. Tertiary lymphoid structures (TLS) increase malignancy and inflammation in non-lymphoid organs. Therefore, we aimed to evaluate the prognostic value of FOXP3, TIM-3, and TLS in patients with NMIBC.
Methods
Patients with pathologically confirmed NMIBC were included in this study. Stromal and intraepithelial cells were evaluated separately using immunohistochemistry, and FOXP3, TIM-3, TLS, FOXP3/TLS, and TIM-3/TLS were calculated and noted. The cutoff value was determined using ROC analysis. Recurrence-free survival (RFS) and overall survival (OS) were evaluated using univariate and multivariate Cox proportional hazard analyses.
Results
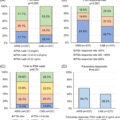
The study included ninety-six patients. FOXP3/TLS high group had a better RFS than FOXP3/TLS low group (P = 0.001; HR, 0.079; 95% CI, 0.019–0.337). This was also significant in the multivariate analysis (P = 0.018; HR, 0.125; 95% CI, 0.022–0.705). In the group receiving BCG, FOXP3/TLS, FOXP3-TLS, TIM-3-TLS and TIM-3/TLS elevation were lower in patients with relapse than in patients without relapse and were statistically significant. Combined TIM-3 and FOXP3 elevation was found to be good prognostic regardless of whether it was found in intraepithelial, stromal or TLS.
Conclusion
FOXP3/TLS elevation is a good prognostic and predictive marker in all non-muscle invasive bladder cancer cases and in the subgroup receiving BCG. Elevation of FOXP3-TLS, TIM-3-TLS, and TIM-3/TLS is associated with longer RFS in patients receiving BCG. Combined TIM-3 and FOXP3 elevation is indicative of a low recurrence rate in NMIBC.
1
Introduction
Urothelial carcinoma (UC) is the sixth most common cancer in Western countries worldwide. The most common urothelial cancers are bladder carcinoma (BC) (90%–95%) and upper urothelial carcinoma [ ]. BC is a cancer in which the prognosis and survival rates vary significantly depending on factors such as stage, grade and recurrence. Non-metastatic BC is classified as bladder cancer without muscle invasion (NMIBC) or bladder cancer with muscle invasion (MIBC), according to the depth of invasion into the bladder wall [ ]. NMIBC accounts for approximately 20% of patients with BC [ ].
After NMIBC diagnosis, risk scoring is performed according to the American Urological Association (AUA) or European Association of Urology (EUA). In this risk scoring, grade, tumor stage, tumor number, recurrence history and presence of carcinoma in situ (CIS) were evaluated, and treatment decision is made accordingly [ ]. Intravesical Bacillus Calmette-Guerin (BCG) is still the standard treatment [ ]. Despite adequate BCG treatment, recurrence and MIBC occur in approximately 40% and 15% of patients, respectively. There are no adequate predictive and prognostic markers for recurrence in a group of patients. It is very important to determine the prognostic factors of BC, which is a highly immune tumor. New therapies to be developed against targets affecting the immune system may favorably affect the prognosis.
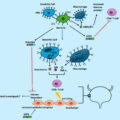
Understanding the interactions between cancer and the immune system is advancing. With the discovery of immune checkpoints (IC), tumor microenvironment (TME), cell surface receptors, and drugs can be created against them will be new hope in treatment [ ]. Therapies primarily based on blockade of IC inhibitors, such as cytotoxic T-lymphocyte-associated protein 4 (CTLA4) and programmed cell death protein 1 (PD1), have made a significant difference in non-small cell lung cancer (NSCLC) and malignant melanoma (MM) [ ]. Although known ICI inhibitors seem to be advantageous, the development of resistance due to these pathways may decrease treatment success [ , ]. Therefore, new biomarkers are always of interest and needed in this field. Therefore, we aimed to analyze the prognostic value of forkhead box P3 (FOXP3), tertiary lymphoid structure (TLS), T-cell immunoglobulin domain and mucin domain 3 (TIM-3) in NMIBC.
1.1
FOXP3
Regulatory T cell (Treg) are a subset of CD4+ T lymphocytes that inhibit anti-tumor immune response. FOXP3 activation occurs after T cell receptor (TCR) and CD28 binding. FOXP3 interacts with activated T lymphocytes and increases CTLA-4 expression while decreasing cytokines that help lymphocyte growth by secreting inhibitory cytokines, such as interleukin (IL)-4, IL-10 and transforming growth factor (TGF)-beta. Therefore, it has an inhibitory effect on T cell proliferation and differentiation. FOXP3 is a transcription factor that is present in a large proportion of Tregs and is more specific than CD25. FOXP3 positive Tregs block attacks against their antigens. They also inhibit antitumoral responses [ ]. FOXP3 is also present in tumors and has different roles, which may even be opposite to each other [ ]. In an in vitro study, FOXP3 inhibited cell growth by controlling the human epidermal growth factor receptor 2 (HER2/neu) oncogene in breast cancer patients [ ]. In a study of gastric cell culture, FOXP3 was found to be associated with a good prognosis [ ]. In another study, it was identified as an X-linked tumor suppressor gene in prostate cancer [ ]. It has also been found as a tumor marker in some studies, NSCLC, 15 MM. 16 Literature data on the correlation between FOXP3 and prognosis are confusing and it is not possible to draw a standardized conclusion.
1.2
TIM-3
TIM-3 is a regulator of both innate and acquired immunity and is found mostly intratumorally but also to a lesser extent in many cells, including effector T cells, monocytes, natural killer (NK) cells, and dendritic cells (DC). Activation of the TIM-3 signaling pathway leads to T cell death and inhibits the immune system response by limiting the cytokines that drive T cell proliferation. T helper(Th)-1 cells can secrete cytokines, such as IL-2, interferon-gamma (IFN-γ), and tumor necrosis factor-α (TNF-α), which promote cellular immunity by directly or indirectly activating macrophage, cytotoxic T lymphocyte (CTL), and NK cell cytotoxicity and phagocytosis. TIM-3 binds to galectin-9 ligand, suppresses Th1, and shifts the Th1/Th2 balance in favor of Th2 cell. TIM-3 also regulates FOXP3+CD4 T lymphocytes through Th1 suppression [ ], thereby promoting tumor growth [ ]. In a study of 175 operated patients with upper urinary tract cancer, TIM-3 showed positive staining in 49% of patients and was found to have no prognostic effect [ ]. A study in patients with breast cancer found that intratumoral and peritumoral TIM-3 expression was associated with a good prognosis [ ]. A study of 137 patients with renal cell carcinoma (RCC) found higher TIM-3 levels in tumor tissue than in normal kidney tissue and correlated with poor prognosis. 23 In 27 patients with NMIBC. Intratumoral PD1+CD38+TIM-3+CD8+ T Cells Associated with Weak Response to BCG Immunotherapy in the evaluation performed before receiving BCG [ ]. In an analysis of 3992 patients, TIM-3+ was associated with increased survival in patients with intraepithelial early stage breast cancer [ ]. High TIM-3 levels were associated with a good prognosis in a study of 139 patients with metastatic castration-resistant prostate cancer [ ]. In a study of 100 operated BC patients undergoing radical cystectomy, TIM-3 was found to have a poor prognosis [ ].
1.3
TLS
TLS are structures formed by T and B lymphocytes that increase malignancy and inflammation in nonlymphoid organs [ ]. Secondary lymphoid organs (SLOs) are physiologic structures formed during embryologic development, whereas TLS arises in pathological events such as inflammation and malignancy. At the same time, while SLO are formed in specific anatomical positions, there is no specific location for TLS and they are heterogeneous [ ]. Stromal cells express chemokine (C-X-C-motif) ligand 13 (CXCL13), chemokine (C-C motif) ligand (CCL)-19, and CCL21, recruiting B cells with CXCR4/CXCR5 expression and T cells with increased IL-4 and IL-12 expression to form TLS [ ].
Studies have shown that T cell activation and infiltration are increased by TLS and play a role in anti-tumoral responses [ ]. There are many studies showing the prognostic value of TLS. In a study of operated lung cancer patients, TLS was found to be lower in stage 3 than in stage 2 [ ]. In a study of Epstein-Barr Virus-associated gastric cancers, intratumoral TLS was found to be a good prognostic independent of stage [ ]. A study in patients with breast cancer revealed that stromal TLS was a good prognostic factor [ ]. On the contrary, in a study of patients with breast cancer, the presence of TLS was associated with poor prognosis [ ]. A study of patients with NSCLC revealed that TLS is predictive of immunotherapy response [ ]. A study in patients with MM showed that TLS correlated with immunotherapy response [ ]. In a study of patients with high-grade serous ovarian cancer, TLS was shown to be associated with good prognosis by increasing T cell.
We designed this study to examine the prognostic effect of immune markers in NMIBC.
2
Material and method
2.1
Patient selection
Patients older than 18 years whose pathology evaluation results were reported as NMIBC between 2018 and 2022 at Mardin Training and Research Hospital were identified, paraffin blocks and slides of biopsy specimens were reviewed, and those with material adequacy and clinical information were included in the study. None of the patients had received radiotherapy, chemotherapy, or immunotherapy before transurethral resection of the bladder (TUR-M). Clinicopathological information such as age, sex, Eastern Cooperative Oncology Group (ECOG) performance scale at the time of diagnosis, comorbidities, tumor location, tumor size, grade, presence of necrosis, presence of in situ component, AUA risk scoring, year of diagnosis, progression times, and recurrence times were recorded using IBM SPSS 25. We also noted the treatments that patients with NMIBC received after TUR-B. Demographic, laboratory, treatment, and follow-up data will be obtained from the hospital automation system, Medical Pathology laboratory, and Medical Oncology department archives, respectively. We aimed to show the effects of immunotherapy and other treatments on the median survival and time to progression.
This study was conducted in accordance with the Declaration of Helsinki and Good Clinical Practice, and was approved by the ethics committee of Gazi Yasargil Training and Research Hospital (Acceptance Date-No: 23.06.2023-2023/445).
2.2
Immunohistochemical staining method
Hematoxylin Eosin-stained sections of the cases included in the study were examined and 4 micron thick sections were prepared from the paraffin blocks that best represented the tumor and incubated in a 60°C oven for 1 h. After deparaffinization, FOXP3 (rabbit monoclonal antibody, clone: EP340; dilution: 1/150) and TIM-3 (rabbit monoclonal antibody, clone: RM448; dilution: 1/150) antibodies were applied with an automatic immunohistochemical (IHC) staining device (Ventana BanchMark). Tonsil tissue was used as a positive control.
2.3
Evaluation of immunohistochemical results
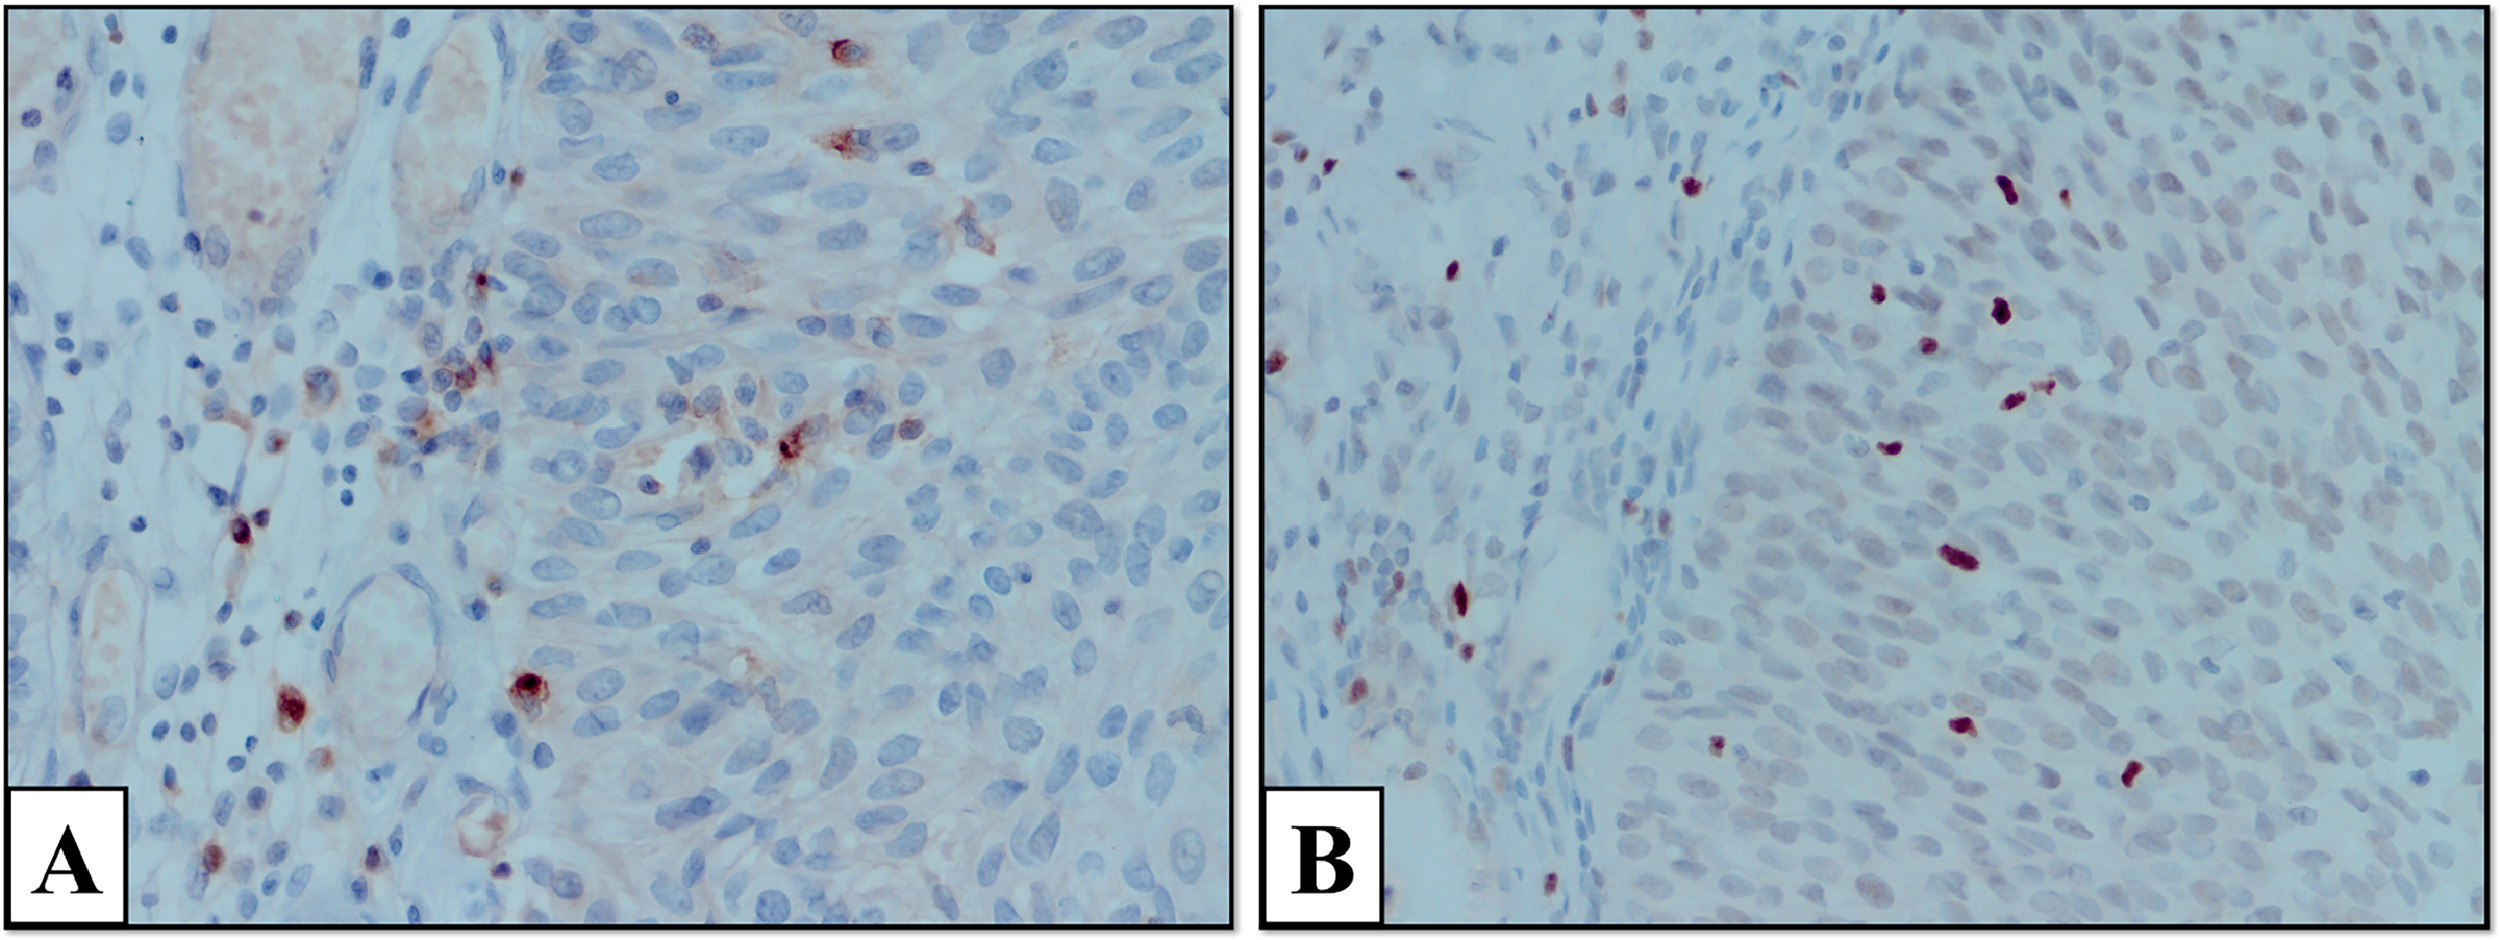
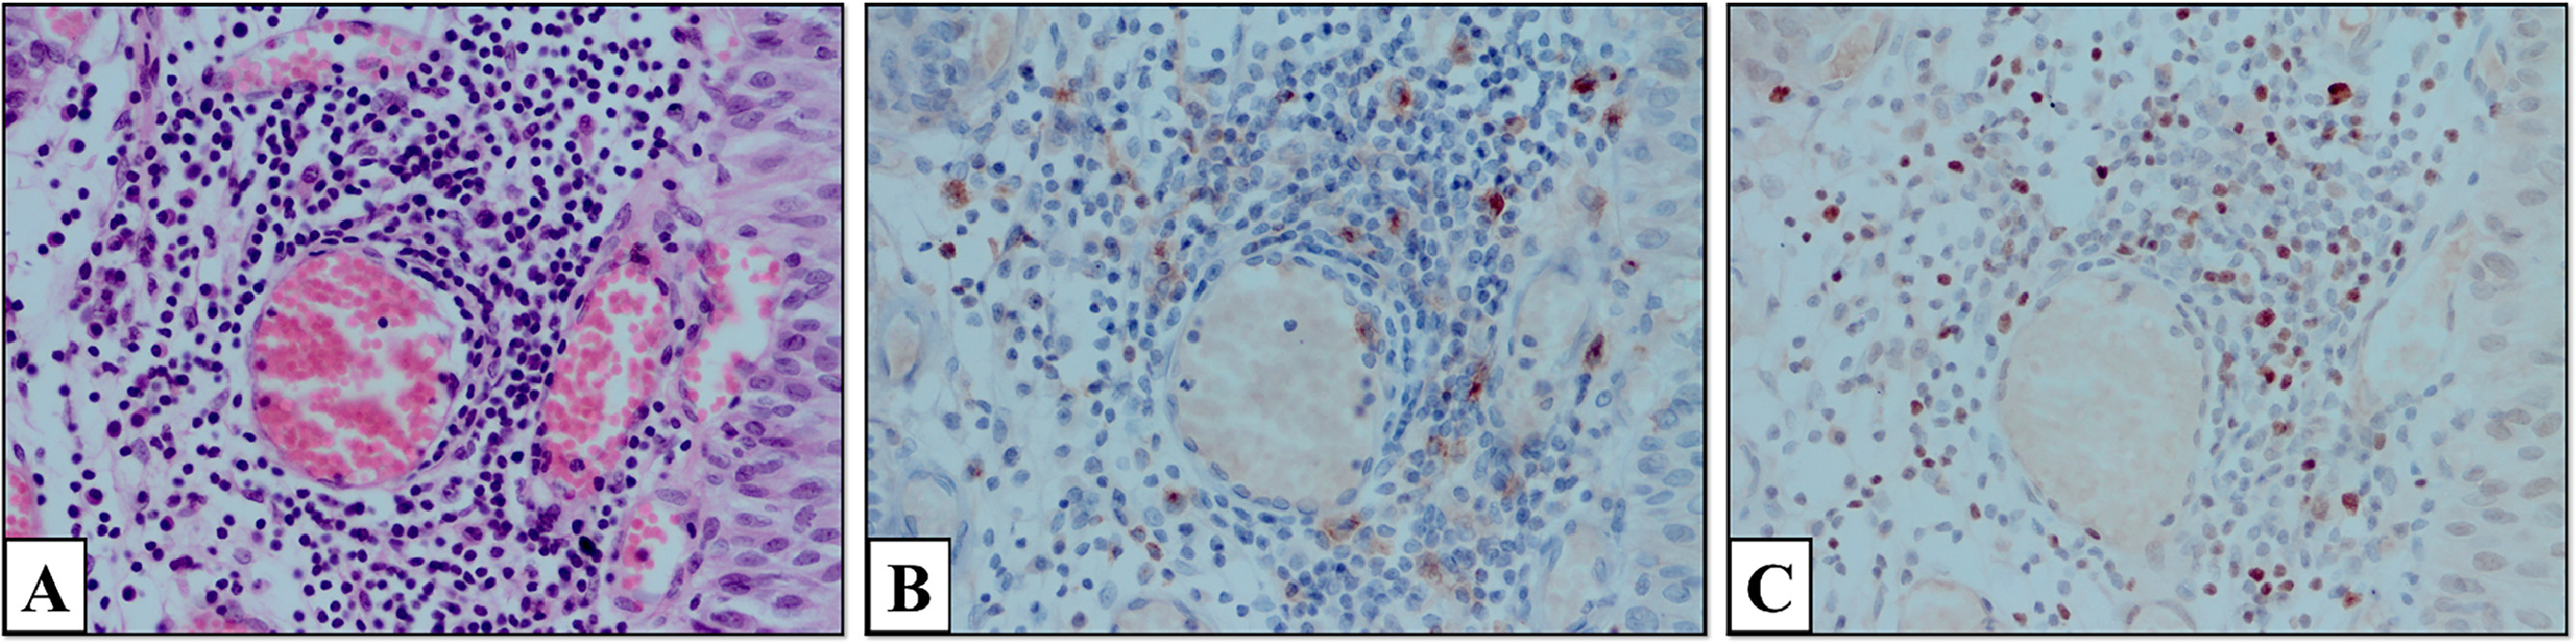
Slides were examined under a microscope (Olympus CX41, Japan). The number of positively stained cells in 5 large-magnification fields (1 mm2, 1 HPF diameter, 0.5 mm) was counted. Areas with the highest expression of inflammatory cells and the most intense staining were determined. FOXP3-intraepithelial (FOXP3-I), FOXP3-stromal (FOXP3-S), total FOXP3 in TLS (FOXP3-TLS), TIM-3-intraepithelial (TIM-3-I), TIM3-stromal [TIM-3-S]), total TIM-3 in TLS (TIM-3-TLS), total TLS, FOXP3 amount per unit TLS (FOXP3/TLS), and TIM-3 per unit TLS (TIM3/TLS) were calculated. The appearance of TIM-3 and FOXP3 cells stained in the stromal and intraepithelial areas at 400 × magnification is shown in Fig. 1 . TLS formation in the tumor stroma is shown at 400x magnification. In addition, images of TIM-3 and FOXP3 positive stained cells in the TLS are shown at 400x magnification.
Positive cell counts will be grouped according to the threshold value that predicts the best correlation with clinical and prognostic data, using cut-off values used in the literature or receiver operating characteristic (ROC) analysis.
2.4
Statistical analysis
Statistical analyses were performed using “IBM SPSS Statistics for Windows. Version 25.0 (Statistical Package for the Social Sciences, IBM Corp., Armonk, NY, USA).” Descriptive statistics are presented as n and % for categorical variables and median (IQR) for continuous variables. Normality assumption was evaluated using the Kolmogorov-Smirnov test (P < 0.05), and the Mann-Whitney U test, a nonparametric test, was used for pairwise group comparisons. Various clinical parameter groups were analyzed using ROC analysis for progression. Kaplan-Meier method was used to compare recurrence-free survival (RFS) and overall survival (OS) times between the various clinical parameter groups. The time from complete clearance of the primary tumor to the time of tumor formation was calculated as RFS. OS was defined as the time from diagnosis to death or the last visit. Multivariate Cox regression results for various clinical variables are presented. Pearson’s chi-square test and Fisher’s exact test were used to compare categorical variables. Statistical significance was set at P < 0.05.
2.5
Acquisition of ribonucleic acid (RNA)-Sequencing (Seq) data of FOXP3 and TIM-3 in human bladder cancer
Focusing on RNA-Seq data of FOXP3 and Tim-3 in the human bladder cancer cohort, expression data for 405 tumor tissues included in The Cancer Genome Atlas (TCGA) ( https://portal.gdc.cancer.gov/ ) were obtained. The prognostic implications of FOXP3 and Tim-3 gene expressions were evaluated utilizing the Kaplan-Meier plotter ( www.kmplot.com ). Based on expression data, patients were divided into 2 groups, high and low expression, and their effects on OS and RFS were analyzed.
3
Results
3.1
Optimal cutoff values of parameters
ROC analysis was performed to determine the optimal value for progression. This cut-off value was 104 for TIM-3-TLS (AUC = 0.64; 95% CI 0.52–0.74, P = 0.044, sensitivity 85.2%, specificity 42.6%). This cut-off value was 21 for TIM-3/TLS (AUC = 0.614; 95% CI 0.49–0.73, P = 0.084; sensitivity, 88.9%; specificity, 36.2%). This cut-off value was 295 for FOXP3-S (AUC = 0.654; 95% CI 0.55–0.75, P = 0.006; sensitivity 86%, specificity 45%). This cut-off value was 128 for TLS-FOXP3 (AUC = 0.74; 95% CI 0.626–0.836, P = 0.0001, sensitivity 81.5%, specificity 68.1%). This cut-off value was found to be 32 for FOXP3/TLS (AUC = 0.805; 95% CI 0.696–0.888, P:0,001 sensitivity 92.6%, specificity 59.6%).
3.2
Population characteristics
There were 96 patients in our study. Median patient age was 64 years. 84 (87%) patients were male and 12 (13%) were female. ECOG performance scale; 0 patients were 11 (11%), 1 patient was 69 (71%), 2 patients were 16 (18%). The pathological tumor stage was Ta in 55 patients (57%) and T1 in 41 (43%). The number of high-grade patients was 90 (93%), whereas the number of low-grade patients was 6 (7%). The AUA risk classification indicated that there were 7% low-risk, 31% intermediate-risk, and 62% high-risk cases. There were 74 (77%) had measurable TLS.
Nine of the 36 patients developed muscle invasion during the follow-up and underwent cystectomy, and then distant metastasis developed during the follow-up. 52 (54%) of 96 patients received intravesical BCG, 9 patients (9%) received intravesical Epirubicin, 3 patients (3%) received intravesical mitomycin. Median RFS and OS were not achieved.
We found that FOXP3/TLS expression levels measured in patients with NMIBC is good prognostic marker. Although our study was retrospective and included a limited number of patients, the results were significant. If FOXP3/TLS is supported as prognostic and predictive for immunotherapy by prospective studies including more patients, it can be used for predictive purposes such as PDL-1 in our daily practice.
3.3
Characteristics of groups according to univariate analysis
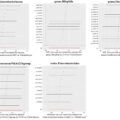
The number of patients in the FOXP3 intraepithelial ≤6.00 (FOXP3-I low) group was 49 and 47 in the FOXP3 intraepithelial >6.00 (FOXP3-I high) group. The number of T1 patients in the FOXP3-I high group was 29(61.7%) and 12(24.5%), then the FOXP3-I was statistically significant (P < 0.001). According to the AUA risk scoring, the number of high-risk patients was 35(74.5%) in the FOXP3-I high group and 24(49%) in the FOXP3-I low group. The number of high-risk patients with AUA was significantly higher in the FOXP3-I high group than in the FOXP3-I low group (P = 0.006). There were 7 (14.9%) patients in the FOXP3-I-high group who did not receive local treatment and 26 (53.1%) patients in the FOXP3-I-low group who did not receive local treatment, which was statistically significant (p 0.001). While the number of patients receiving BCG in the FOXP3-I high group was 37(92.5%), it was 15(62.5%) more than that in the FOXP3-I low group and was statistically significant (P = 0.011).
There were 64 patients in the FOXP3 stromal ≤295 (FOXP3-S low) group and 32 patients in the FOXP3 stromal >295 (FOXP3-S high) group. There were 5 (15.6%) patients in the FOXP3-S-high group who did not receive local treatment and 28 (43.8%) patients in the FOXP3-S-low group who did not receive local treatment, which was statistically significant (P = 0.006).
The number of patients was 37 in the FOXP3-TLS≤128.0 (FOXP3-TLS low) group and 37 in the FOXP3-TLS >128.0 (FOXP3-TLS high) group. While there were 6 (16.2%) patients in the FOXP3-TLS high group who did not receive local treatment, 16 (43.2%) patients in the FOXP3-TLS-low group did not receive local treatment, which was statistically significant (P = 0.011). No significant differences were observed between the groups. The demographic data of the patients according to FOXP3-I, FOXP3-S, and FOXP3-TLS are shown in detail in Supplementary Table I .
There were 48 patients in the TIM-3 intraepital ≤7.5 (TIM-3-I low) group. There were 48 patients in the TIM-3 intraepithelial >7.5 (TIM-3-I high) group. The number of T1 patients was 28 (58.3%) in the TIM-3-I high group and 13 (27.1%) in the TIM-3-I low group. The number of T1 patients was significantly higher in the TIM-3-I high group than in the TIM-3-I low group (P = 0.004). There were 7 (14.9%) patients in the TIM-3-I high group who did not receive local treatment and 26 (53.1%) patients in the TIM-3-I low group who did not receive local treatment, which was statistically significant (P < 0.001).
There were 49 patients in the TIM-3 stromal ≤88 (TIM-3-S low) group. The TIM-3 stromal >88 (TIM-3 -S high) group was 47. The number of high-grade tumors was 47(100%) in the TIM-3-S high group and 43(87.8%) in the TIM-3-S low group, which was statistically significant (P = 0.027). The number of T1 patients was 29(61.7%) in the TIM-3-S high group and 12(24.5%) in the TIM-3-S low group, which was statistically significant (P < 0.001). According to the AUA risk scoring, the number of high-risk patients was 37(78.7%) in the TIM-3 -S-high group, 22(44.9%) in the TIM-3 -S-low group and the difference was statistically significant (P < 0.001). There were 7 (14.9%) patients in the TIM-3-S high group who did not receive local treatment and 26 (53.1%) patients in the TIM-3-S low group who did not receive local treatment, which was statistically significant (P < 0.001). While there were 8 (17%) patients in the TIM-3-S high group who did not receive local treatment, there were 25 (51%) patients in the TIM-3-S low group who did not receive local treatment, which was statistically significant (P < 0.001).
There were 50 patients in the TIM-3-TLS ≤104 (TIM-3-TLS low) group and 24 patients in the TIM-3-TLS >104 (TIM-3-TLS high) group. There were 16 T1 patients (66.7%) in the TIM-3-TLS high group and 21 (42%) in the TIM-3-TLS low group, which was statistically significant (P = 0.047). The TIM-3-TLS high group had a lower proportion of patients who did not receive local treatment than the TIM-3-TLS low group. Specifically, out of the 3 patients in the high group, 1 did not receive local treatment, while out of the 19 patients in the low group, 18 did not receive local treatment. This difference was statistically significant (P < 0.001).
No significant differences were observed between the groups. Demographic data of patients according to TIM3-I, TIM3-S, and TIM3-TLS are shown in detail in Supplementary Table II .
The number of patients in the TLS ≤4.00 (TLS – low) group was 55. TLS >4.00 (TLS – high) group had 41. The number of T1 patients was 25(61%) in the TLS-high group and 16(29.1%) in the TLS-low group, which was statistically significant (P = 0.003). According to AUA risk scoring, the number of high-risk patients was 32(78%) in the TLS-high group and 27(49.1%) in the TLS-low group, which was statistically significant (P = 0.004). The number of high-grade patients was 41(100%) in the TLS-high group and 49(89.1%) in the TLS-low group, which was statistically significant (P = 0.036). The number of patients who did not receive local treatment was 8 (19.5%) in the TLS-high group and 25 (45.5%) in the TLS-low group, which was statistically significant (P = 0.008).
There were 44 patients in the FOXP3/TLS ≤ 32 (FOXP3/TLS-low) group and 30 patients in the FOXP3/TLS >32 (FOXP3/TLS-high) group. No significant differences were observed between the groups.
The number of patients in the TIM-3/TLS ≤ 21.2 (TIM-3/TLS-low) group was 53, while the number of patients in the TIM-3/TLS >21.2 (TIM-3/TLS-high) group was 21. The number of T1 patients was 16(76.2%) in the TIM-3/TLS-high group and 5 (23.8%) in the TIM-3/TLS-low group, and the difference was statistically significant (P = 0.005). The number of patients who did not receive local treatment was 2 (9.5%) in the TIM-3/TLS-high group and 20 (37.7%) in the TIM-3/TLS-low group, which was statistically significant (P = 0.017).
The demographic data of the patients according to TLS, TIM-3/TLS, and FOXP3/TLS are shown in Supplementary Table III .
3.4
Progression-free survival analyzes
3.4.1
Univariate analyses
According to the ECOG 0,1,2 performance status of the patients in our study, the 2-year RFS rates were 53%, 71.1%, and 55.6%, and the 5-year RFS rates were 53%, 53.3%, and 44.4%, respectively. The median was not reached for ECOG 0 and 1, whereas it was 25 (2.9–47.2) months for ECOG 2 (P = 0.619). High-grade patients had better RFS than low-grade patients (P = 0.033; hazard ratio [HR], 0.318; 95% CI, 0.111–0.914). 2-year RFS rates were 68% and 50%, respectively. The 5-year RFS rate was 54.1% and 37.8%, respectively. The median RFS was 8 months (0–24.8) for low-grade patients and not reached for high-grade patients (P = 0.023).
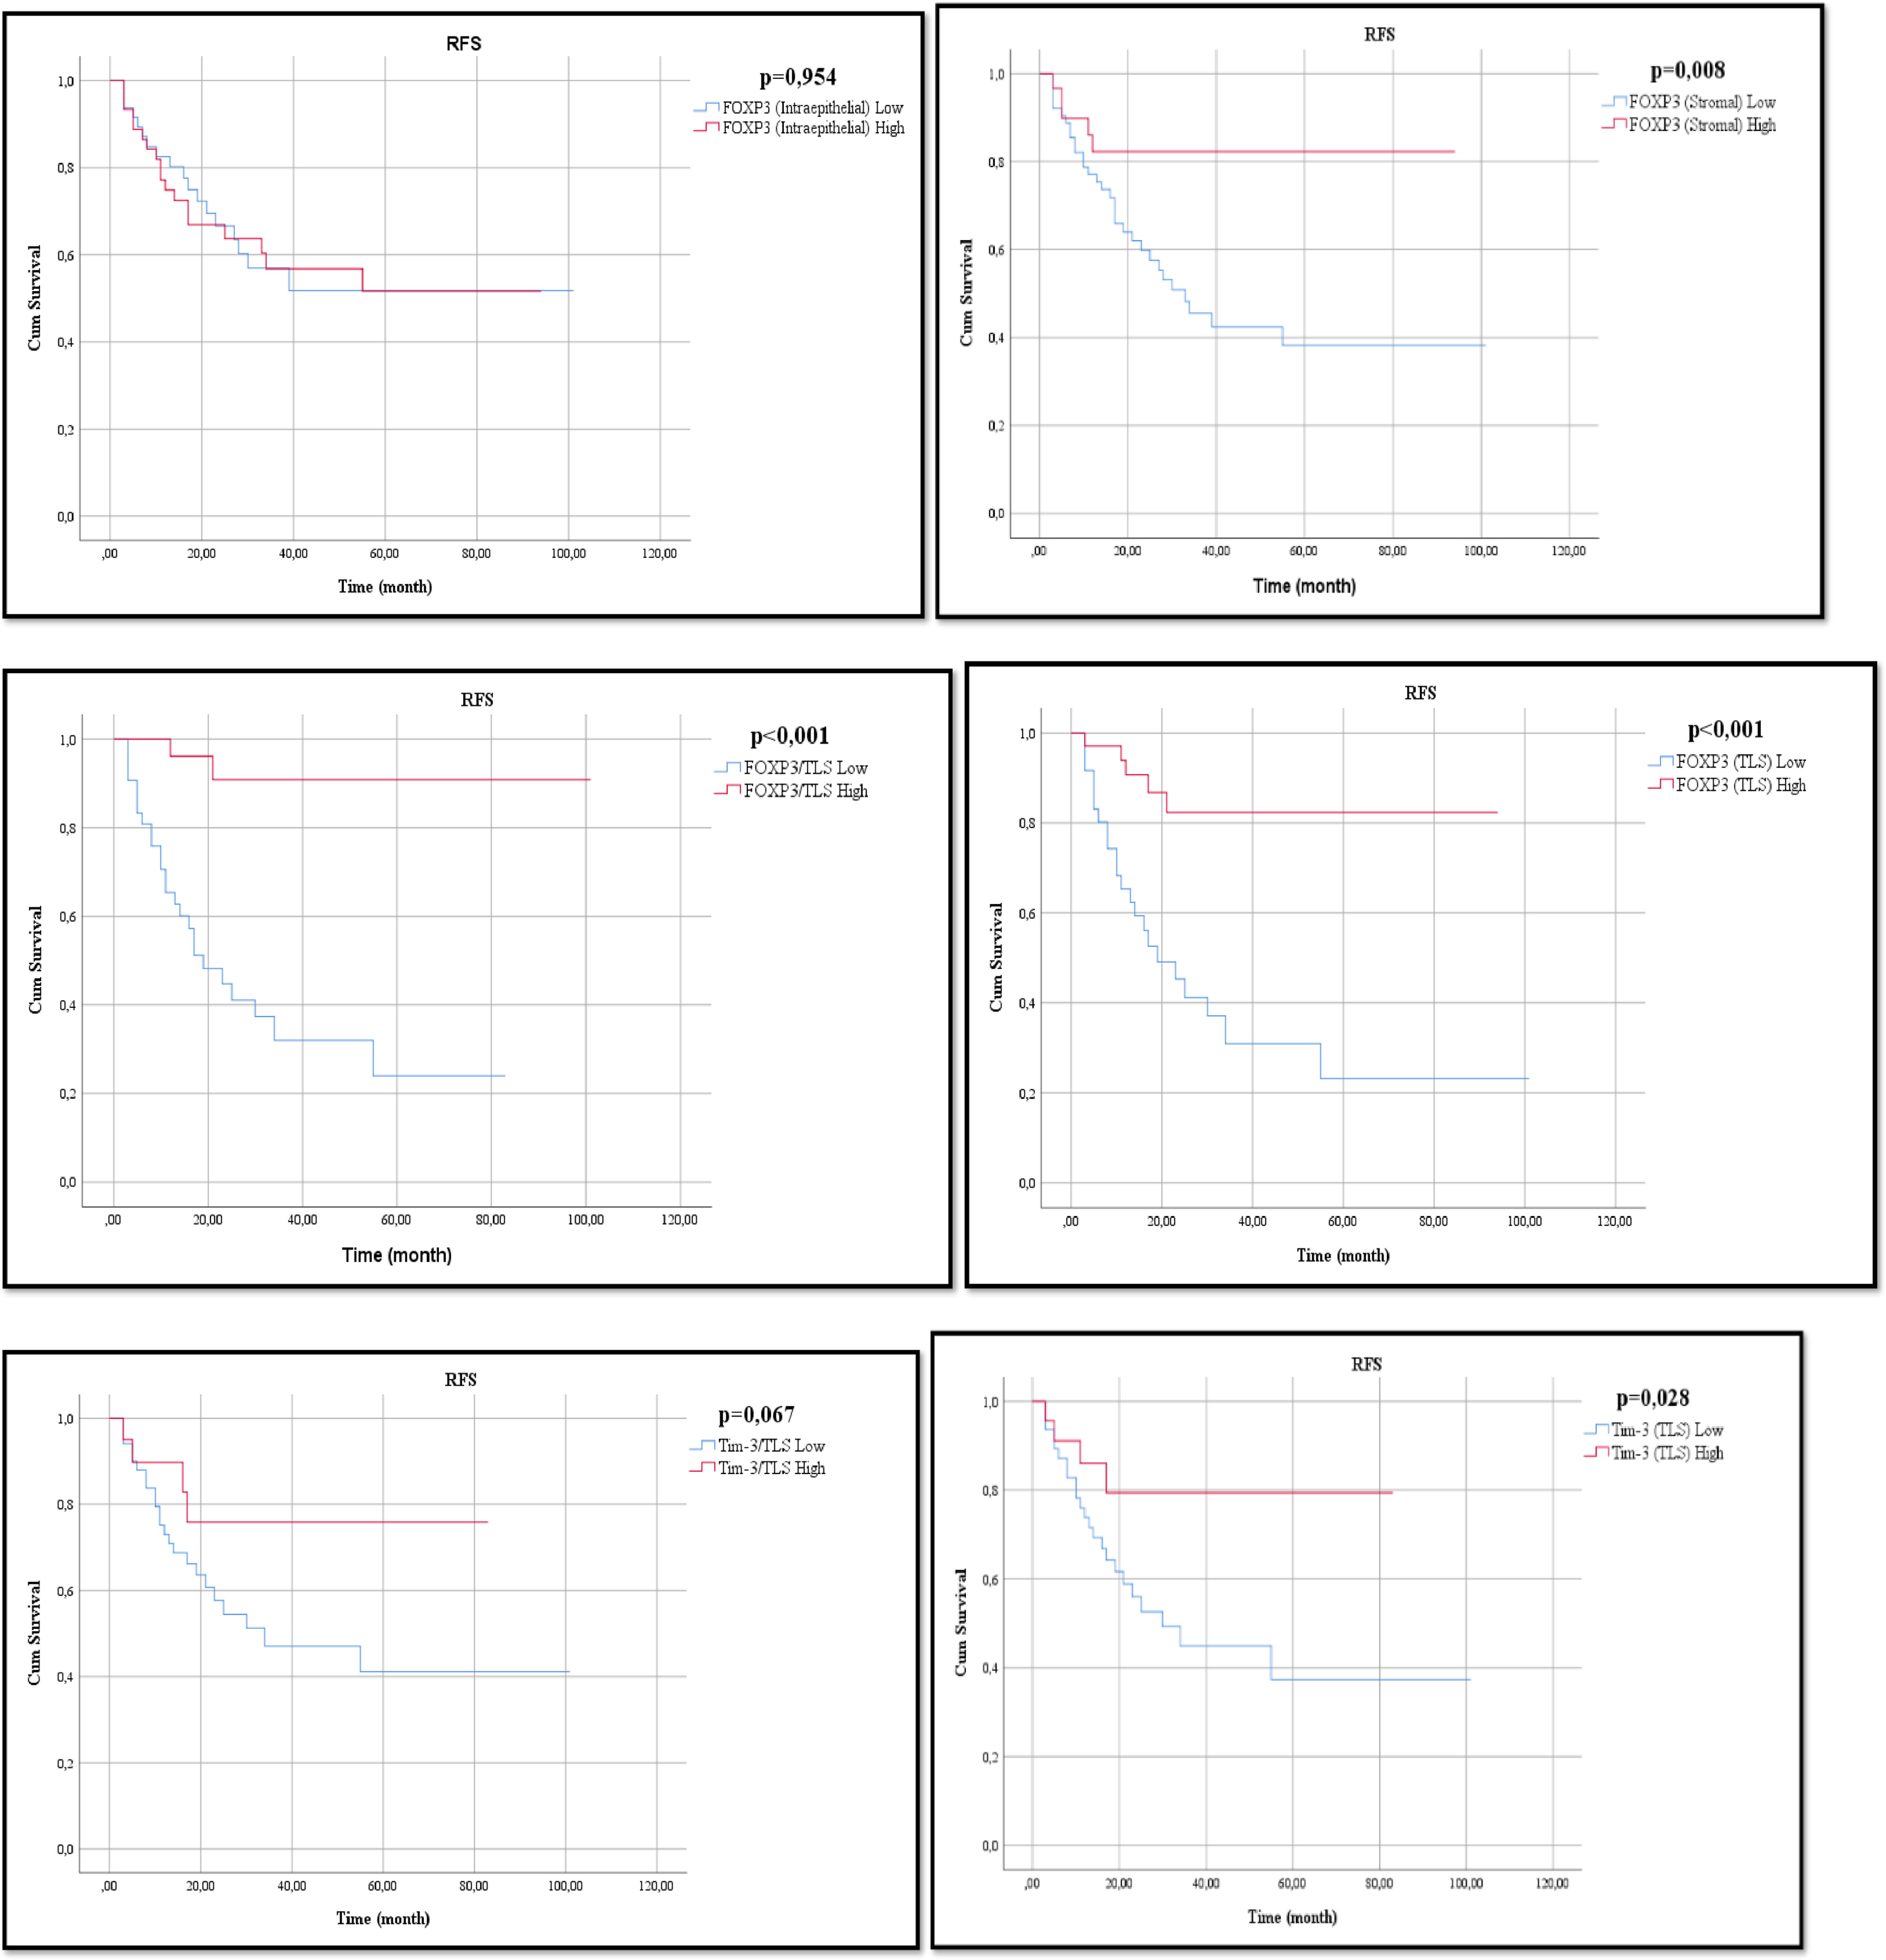
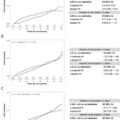
The FOXP3-I high group and FOXP3-I low group, 2-year RFS rates were 66.9% and 66.6%, respectively. The 5-year RFS rates were 51.6% and 51.7%, respectively (P = 0.954). Median values could not be reached for the 2 groups. The FOXP3-S high group had better RFS than the FOXP3-S low group (P = 0.013; HR, 0.303; 95% CI, 0.118–0.782), and the 2-year RFS rates were 82.3% and 59.8%, respectively. The 5-year RFS rates were 62% and 38%, respectively (P = 0.008). The median RFS was 33 months (20.1–45.9) for the FOXP3-S low group and was not reached for the FOXP3-S high group. The FOXP3-TLS high group had better RFS than the FOXP3-TLS low group (P < 0.001; HR, 0.175; 95% CI, 0.066–0.464), with 2-year RFS rates of 82.4% and 45.3%, respectively. The 5-year RFS rate was 62% and 23.2%, respectively. The median RFS was 19 months (95% CI: 8.6–29.4) for the FOXP3-TLS low group but not for the FOXP3-TLS high group (P < 0.001).
Compared with the TIM-3-I high and TIM-3-I low groups, the 2-year RFS rates were 69.2% and 63.7%, respectively. The 5-year RFS rate was 55.5% and 46.9%, respectively. The median RFS was 55 months for the TIM-3-I low group compared with 55 months for the TIM-3-I high group (P = 0.572). the TIM-3-S high group and TIM-3-S low group, 2-year RFS rates were 71.8% and 59.3%, respectively. The 5-year RFS rate was 55.6% and 48.6%, respectively. The median RFS was 55 months for the TIM-3-S low group, whereas the median RFS was not reached for the TIM-3-S high group (P = 0.97). The TIM-3-TLS high group had better RFS than the TIM-3-TLS low group (P = 0.038; HR, 0.324; 95% CI, 0.112–0.940), with 2-year RFS rates of 79.4% and 52.7%, respectively. The 5-year RFS rate was 60% and 37.4%, respectively. The median RFS was 30 months (95% CI: 14.2–45.7) for the TIM-3TLS – low group but not for the TIM-3-TLS-high group (P = 0.028).
Compared with the TLS-high and TLS-low groups, the 2-year RFS rates were 70.2% and 63.5%, respectively. The 5-year RFS rate was 55.1% and 48.9%, respectively. The median RFS was 39 months for the TLS-low group, whereas the median RFS for the TLS-high group was not reached (P = 0.328). Fig. 2
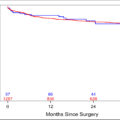
The FOXP3/TLS high group had better RFS than the FOXP3/TLS low group (P = 0.001; HR, 0.079; 95% CI, 0.019–0.337), and the 2-year RFS rates were 80.8% and 44.8%, respectively. The 5-year RFS rates were 54.8% vs. 24%, respectively. The median RFS was 19 months (95% CI: 9.97–28.02) for the FOXP3/TLS – low group but not for the FOXP3/TLS high group (P < 0.001). Table 1
| Variables | AUC | %95 CI | Cut-off | Sensitivity (%) | Specificity (%) | P |
|---|---|---|---|---|---|---|
| TIM3-TLS | 0.637 | 0,517–0,745 | ≤104,0 | 85,2 | 42,6 | 0.044 |
| TIM3/TLS | 0,614 | 0,494–0,725 | ≤21,2 | 88,9 | 36,2 | 0,084 |
| FOXP3-S | 0.654 | 0,550–0,749 | ≤295,0 | 86,1 | 45,0 | 0.006 |
| FOXP3-TLS | 0.741 | 0,626–0,836 | ≤128,0 | 81,5 | 68,1 | 0.0001 |
| FOXP3/TLS | 0.805 | 0,696–0,888 | ≤32,0 | 92,6 | 59,6 | <0.001 |
The TIM-3/TLS high group had better RFS than the TIM-3/TLS low group, but the difference was not statistically significant (P = 0.080; HR, 0.387; 95% CI, 0.134–1.121). 2-year RFS rates were 75.9% and 57.7%, respectively. The 5-year RFS rate was 64% and 41.2%, respectively. The median RFS was 34 months (95% CI: 2.24–65.76) for the TIM-3/TLS – low group but not in the TIM-3-/TLS high group (P = 0.067). The relationship between RFS and these parameters is shown in Fig. 3 . The Kaplan–Meier log-rank test is shown in Table 2 , and Cox regression analysis is shown in Table 4 .
| RFS | ||||
|---|---|---|---|---|
| 2-year % | 5-year % | Median (%95 CI) | P-value | |
| General | 66,6 | 51,5 | NR | |
| Age | ||||
| ≤65 | 69,2 | 51,9 | NR | 0.821 |
| >65 | 63,8 | 50,6 | NR | |
| Gender | ||||
| Female | 50,0 | 50,0 | 19,00 (-) | 0.670 |
| Male | 68,7 | 55,2 | NR | |
| ECOG | ||||
| 0 | 53,0 | 53,0 | NR | 0.619 |
| 1 | 71,1 | 53,3 | NR | |
| 2 | 55,6 | 44,4 | 25,00 (2,85–47,17) | |
| In-Situ Component | ||||
| No | 67,7 | 49,2 | 19,00 (-) | 0.805 |
| Yes | 65,6 | 54,6 | NR | |
| Necrosis | ||||
| No | 66,6 | 51,2 | NR | 0.977 |
| Yes | 67,5 | 50,6 | NR | |
| Grade | ||||
| Low | 50,0 | 37.8 | 8,00 (0,00–24,80) | 0,023 |
| High | 68,0 | 54,1 | NR | |
| Tumor | ||||
| Ta | 65,8 | 47,7 | 55,00 (-) | 0.672 |
| T1 | 67,9 | 57,8 | NR | |
| AUA Risk | ||||
| Low | 66,7 | 51 | NR | 0.975 |
| İntermediate | 68,0 | 41,4 | 55,00 (22,59–87,40) | |
| High | 66,2 | 55,1 | NR | |
| Local Treatment | ||||
| No | 57,1 | 34,3 | 27,00 (2,44–51,55) | 0.099 |
| Yes | 73,9 | 60,1 | NR | |
| TIM-3-I | ||||
| ≤7,50 | 63,7 | 46,9 | 55,00 (-) | 0.572 |
| >7,50 | 69,2 | 55,5 | NR | |
| TIM-3-S | ||||
| ≤88,0 | 71,8 | 48,6 | 55,00 (-) | 0.970 |
| >88,0 | 59,3 | 55,6 | NR | |
| TIM-3-TLS | ||||
| ≤104,0 | 52,7 | 37,4 | 30,00 (14,2–45,7) | 0.028 |
| >104,0 | 79,4 | 60 | NR | |
| FOXP3-I | ||||
| ≤6,0 | 66,6 | 51,7 | NR | 0.954 |
| >6,0 | 66,9 | 51,6 | NR | |
| FOXP3-S | ||||
| ≤295,0 | 59,8 | 38,2 | 33,00 (20,07–45,92) | 0.008 |
| >295,0 | 82,3 | 62.0 | NR | |
| FOXP3-TLS | ||||
| ≤128,0 | 45,3 | 23,2 | 19,00 (8,58–29,4) | <0.001 |
| >128,0 | 82,4 | 62.0 | NR | |
| TLS | ||||
| ≤4,0 | 63,5 | 48,9 | 39,00 (-) | 0.328 |
| >4,0 | 70,2 | 55,1 | NR | |
| TIM-3/TLS | ||||
| ≤21,2 | 57,7 | 41,2 | 34,00 (2,24–65,76) | 0.067 |
| >21,2 | 75,9 | 64 | NR | |
| FOXP3/TLS | ||||
| ≤32,0 | 44,8 | 24,0 | 19,00 (9,97–28,02) | <0.001 |
| >32,0 | 80,8. | 54.8 | NR | |
Related posts:
 Tumor involvement of the trigone and urethra at the time of robot-assisted radical cystectomy is associated with adverse oncological outcomes
 Understanding the microbiome as a mediator of bladder cancer progression and therapeutic response
 5α-reductase inhibitors with or without alpha-blockers and risk of incident upper tract urothelial carcinoma in men with benign prostatic hyperplasia: Analysis of US insurance claims data
 The use of nephron-sparing intervention does not appear to be compromised after a period of active surveillance for patients with cT1 renal masses
 Causal relationship between bladder cancer and gut microbiota contributes to the gut-bladder axis: A two-sample Mendelian randomization study
 Clinical significance of PSA dynamics in castration-sensitive prostate cancer treated with ARSI doublet therapy: A multicenter study
Stay updated, free articles. Join our Telegram channel

Full access? Get Clinical Tree


