Exploring the Association between Diabetes and Cardiovascular Disease


Exploring the Association between Diabetes and Cardiovascular Disease


Stop thinking in terms of limitations and start thinking in terms of possibilities.

Terry Josephson, 20th/21st-century motivational author


Introduction

Diabetes is considered a cardiovascular (CV) risk equivalent disease. In 1998, Haffner et al. reported that Finnish patients with T2DM have a risk for future major coronary events similar to that of patients with previous myocardial infarction (MI).1 Other studies have shown that coronary mortality at the time of acute myocardial infarction (AMI) is essentially doubled in patients with diabetes compared with those without diabetes.2,3 Moreover, the mortality rates for patients with diabetes who survive an initial MI are doubled for subsequent events when compared to patients who are euglycemic.4

Due to the high risk of both primary events and mortality following onset of coronary heart disease (CHD), intensive prevention of atherosclerosis in all patients with diabetes appears to be a reasonable objective.5

Adult Treatment Panel III (ATP III) defines CHD risk equivalent as the likelihood of developing a major coronary event (myocardial infarct + coronary death) within 10 years of greater than 20%.At current retail drug prices, when 10-year risk for hard CHD events (MI + CHD death) ranges from 10% to 20% per year, statins carry an acceptable cost-effectiveness according to a cost analysis by ATP III.5

Eighty percent of diabetes-related mortality is attributable to the three major forms of macrovas-cular complications, which include CHD, stroke, and peripheral arterial disease (PAD).6 Table 7-1 shows the predictors of CV mortality in patients with diabetes, and Table 7-2 displays the features commonly associated with CHD and diabetes.

Roughly 85% of acute strokes are atherothrombotic, and the rest are hemorrhagic (10% pri-mary intracerebral hemorrhage and 5% subarachnoid hemorrhage). The risk of atherothrombotic stroke is two- to threefold higher in patients with diabetes, while the rates of hemorrhagic stroke and transient ischemic attacks (TIAs) are similar to those of the nondiabetic population.7

Predictors of increased mortality among stroke patients with diabetes include (a) severity of hyperglycemia on admission, (b) infarct of the middle cerebral artery, (c) advanced age, (d) presence
of atrial fibrillation, (e) history of congestive heart failure, (f) chronic kidney disease (CKD), and (g) a low Glasgow coma score. Renal failure is a rare cause of death in acute stroke, yet suggests the presence of significant vascular disease. Stroke patients with diabetes also require longer hospital stays when compared to euglycemic individuals. This will inevitably translate into higher overall cost. The longer length of stay might possibly be caused by the difficulties in controlling the blood glucose during the hospital stay.8,9


TABLE 7-1. Predictors of CV Mortality in Patients with T1DM and T2DM


T1DM


T2DM


Overt nephropathy


Presence of CAD


Hypertension


Overt proteinuria


Age


Hemoglobin A1 C


Smoking


Hypertension


Microalbuminuria


Autonomic cardiac neuropathy


Adapted from Donnelly R, Emslie-Smith AM, Gardner ID, et al. ABC of arterial and venous disease: vascular complications of diabetes. BMJ. 2000;320:1062-1066.


Pathogenesis of Macrovascular Compromise in Patients with Diabetes

Vascular disease and endothelial dysfunction are accelerated in diabetes due to the multiple metabolic anomalies associated with hyperglycemia (Fig. 7-1). Damaged endothelial cells produce lower levels of nitric oxide (NO), thereby inhibiting vasodilation. Vascular smooth-muscle proliferation in association with higher circulating levels of plasminogen activator inhibitor-1 (PAI-1) leads to a state of hypercoagulation, increased thrombosis, and progressive atherogenesis. Inflammation within the endovascular environment is accelerated in the presence of hypertension, dyslipidemia, cigarette smoking, and direct endothelial cell damage from cytokines such as tumor necrosis factor (TNF) and C-reactive protein (CRP).


TABLE 7-2. Features of CHD in Diabetic Patients


Atherosclerosis


AMI


Revascularization


  • Prevalence of fatal and nonfatal CHD events 2-20 times higher than for nondiabetics of similar age


  • Protective effect of female gender is lost.


  • Plaque rupture leading to unstable angina and MI is more common.


  • Higher incidence of diffuse, multivessel disease


  • Superimposed thrombosis more likely


  • In-hospital and 6-mo mortality double that in nondiabetics


  • Complications (e.g., arrhythmias, heart failure, death) more common


  • Reperfusion rates after thrombolysis are similar to those of nondiabetics, but reocclusion and reinfarction rates are higher.


  • Mortality reduced by insulin glucose infusion immediately after MI


  • 5-y survival rates after coronary artery bypass graft or percutaneous coronary angioplasty lower than for nondiabetics


  • 5-y survival better after coronary artery bypass graft than percutaneous coronary angioplasty because of higher restenosis rates


Adapted from Donnelly R, Emslie-Smith AM, Gardner ID, et al. ABC of arterial and venous disease: vascular complications of diabetes. BMJ. 2000;320:1062-1066.


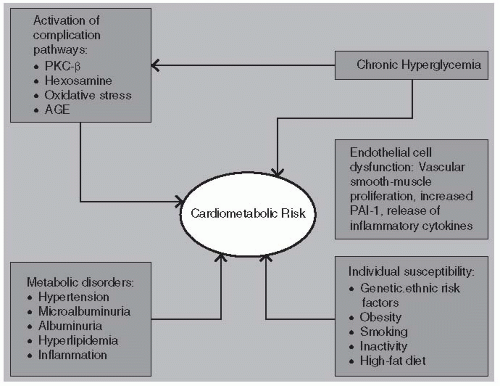
Figure 7-1 • Pathogenesis of CV Complications in Patients with Diabetes. Multiple acquired and genetic risk factors favor progression to CVD in patients with diabetes. All of these components with the exception of genetics and ethnicity are modifiable risk factors. Chronic hyperglycemia increases one’s glycemic burden favoring progression toward heart disease, stroke, and peripheral vascular disease (AGE, advanced glycosylated end products; PKC, protein kinase-C.)

Glucose can react extracellularly in nonenzymatic reactions. One pathologic mechanism shared with microvascular complications involves the glycosylation of protein within arterial wall matrix in a process that induces cross-linking of collagen within the vessel wall, reducing compliance. Direct glycation of low-density lipoprotein cholesterol (LDL-C) prolongs the half-life of these atherogenic lipoproteins, further increasing CV risk. Activation of the protein kinase C (PKC)-β pathway in association with the oxidative stress induced by glycemic variability increases risk of cardiomyopathy.10,11 Glycemic variability and oxidative stress appear to be the cornerstone for both microvascular and macrovascular pathogenesis.12

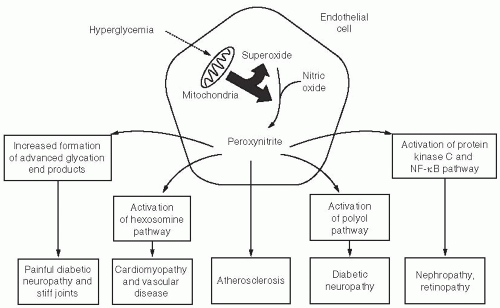
Why are some tissues (such as neurons or endothelial cells) prone to develop complications, whereas others (digestive cells) appear to be immune to the effects of prolonged exposure to hyperglycemia? The answer may lie in a cell’s ability to assimilate the amount of glucose required as an energy source, before pumping any excess glucose to the outside of the cell. Neurons, nephrons, retinal cells, and endothelial cells are inefficient interstitial transporters of glucose. As glucose levels rise above 180 mg per dL in these “at risk cells,” reactive oxygen species (ROS) form within their mitochondria electron transport chain, triggering a cascade of events leading to microvascular and macrovascular disease.13 The “downstream” targets of ROS formation include increased activity of PKC, activation of nuclear factor (NF)-κB, collagen synthesis, and cell death.14 Exposure to blood glucose levels above 180 mg per dL for just 4 hours can cause the downstream effects of ROS to persist for up to 7 days, even if the blood glucose levels are quickly normalized.15 One can easily understand the biologic link between the extremely high incidence of cardiovascular disease (CVD) and hyperglycemia as shown in Figure 7-2.

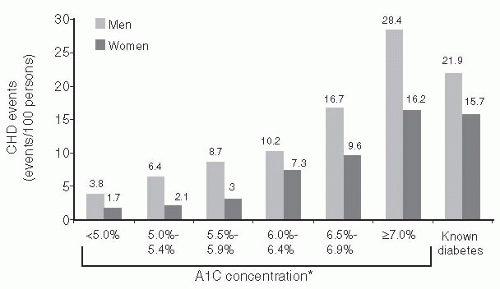
CV risk is increased in individuals who have glucose abnormalities that are considered as being below the diagnostic threshold level for diabetes.16 The A1C levels of 10,232 patients were assessed from 1995 to 1997. CVD events and mortality rates were subsequently assessed through 2003. As shown in Figure 7-3, the risk for CVD and mortality increased continuously across the A1C distribution.


Figure 7-2 • Hyperglycemia Activates Pathways within Endothelial Cells Leading to Multiple Long-term Complications. The action of endothelium-derived vasodilators (e.g., NO and prostacyclin) has been associated with antiatherogenic mechanisms, whereas endothelium-derived vasoconstrictors (e.g., endothelin-1 and thromboxane) promote atherosclerosis. NO keeps the endothelial cells free of adhesion molecules and regulates vascular tone. Peroxynitrate (an NO derivative) is formed when NO interacts with oxidative forces (superoxide) within the endothelial cells. Perioxynitrate inhibits the endothelial cell’s mitochondrial electron transport system leading to endothelial dysfunction and the transcription of endothelial-derived cytokines that induce pathways responsible for microvascular and macrovascular complications. (From Unger J. Reducing oxidative stress in patients with type 2 diabetes mellitus: a primary care call to action. Insulin. 2008;3:176-184.)


Figure 7-3 • A1C Is Predictive of CHD Event Rates. The risk for CVD and total mortality associated with A1C concentrations increased continuously through the sample distribution. Most of the events in the sample occurred in persons with moderately elevated A1C concentrations. A1C levels greater than or equal to 7% infer the highest risk in this study population. (Adapted from Khaw KT, Wareham N, Bingham S, et al. Association of hemoglobin A1C with cardiovascular disease and mortality in adults: the European prospective investigation into cancer in Norfolk. Ann Intern Med. 2004;141 (6):413-420.)


TABLE 7-3. Relative Risk Reduction of CHD Events in UKPDS and 10-Year UKPDS Follow-up Suggesting Importance of Intensive Intervention


Treatment Group


Reduction in Ml (1997)


Reduction in Ml (2007)


Reduction in All-cause Mortality (1997)


Reduction in All-cause Mortality (2007)


Sulfonylurea/Insulin


16% p = 0.052a


15% p=0.01


6% p = 0.44a


13% p = 0.007


Metformin


39% p = 0.01a


33% p= 0.005


36% p = 0.011


27% p = 0.002


Reductions in Ml and all-cause mortality rates, which had not been statistically significant in the original trial, became


significant for the intensively treated participants during the long-term follow-up study


a p value not statistically significant


From Holman RR, Paul SK, Bethel MA, et al. Long-term follow-up of intensive glucose control in type 2 diabetes


N Engl J Med. 2008;359:1577-1589.


As with microvascular disease, improvement in glycemic control can significantly lower the risk of macrovascular complications. The UK Prospective Diabetes Study (UKPDS) demonstrated that each 1% reduction in A1C was associated with a corresponding 14% reduction in the risk of MIs.17 There was no A1C threshold that targeted the optimal macrovascular risk reduction. Thus, lowering the A1C as close to normal as possible is certainly a desirable target.

The 10-year UKPDS follow-up observed a “legacy effect” of intensive glucose therapy suggesting con-tinued vascular benefits despite loss of glycemic differences from conventional treatment.18 Reductions in MI and all-cause mortality, which had not been statistically significant in the original trial, became sig-nificant for the intensively treated participants during the post-trial period (Table 7-3). Thus, the UKPDS follow-up supports initiation of intensive glucose therapy as early as possible for patients with T2DM.

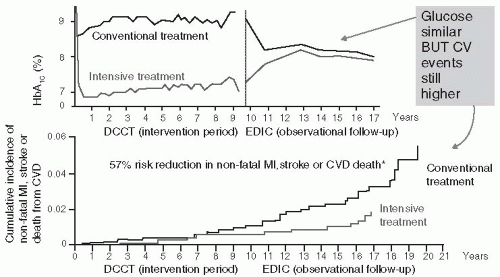
Patients with T1DM who were intensively managed on average for 6.5 years in the Diabetes Control and Complications Trial (DCCT) and then followed for 17 years once the study concluded had a significantly lower rate of CV events than those patients treated with conventional therapy (Fig. 7-4).19 Intensive insulin management in T1DM patients reduced the risk of nonfatal MI, stroke: or death from CVD by 57% and the risk of any CVD event by 42% compared with convention-ally treated DCCT patients. Associated with the prolonged improvement in the A1C, intensively managed patients had lower A1C levels as well as lower incidences of microalbuminuria and albu-minuria, both of which are associated with CVD. Other studies have demonstrated that intensive therapy reduced the progression of atherosclerosis, measured by carotid intima-media thickness (CIMT), as well as the prevalence of coronary artery calcification.20,21 The mechanisms responsible for the improvement in outcomes and for the prolonged effects on early intervention remain uncer-tain. Some investigators feel that “metabolic memory” results in long-term beneficial effects on mac-rovascular risk reduction in intensively managed patients with T1DM. Regardless of the protective mechanism associated with improved glycemic control, the risk reduction achieved by initiating intensive therapy in T1DM patients as soon as the diagnosis is made is compelling. Risk reduction achieved with other proven interventions such as lowering cholesterol and BP is far less than those attained by intensively managing patients with diabetes.

Risk reduction for macrovascular disease involves targeting treatment at each one of the meta-bolic abnormalities that coexist with hyperglycemia.22


Determining Cardiovascular Risk Assessment in Patients with Diabetes

The use of a mathematical model to predict the likelihood of developing long-term diabetes-associated complications would help the physician target specific treatment targets, which should lower the
risk. In addition, global risk assessment models could be useful in educating patients regarding the importance of fine-tuning metabolic therapy or maintaining adherence to a prescribed treatment plan. Risk factor assessment may target two different populations. Patients who have already suffered a diabetes-related complication, such as a stroke or AMI, should be evaluated to determine which interventions may be prescribed to prevent the occurrence of a secondary event. Primary preven-tion strategies are used to delay or avoid an initial event from occurring in high-risk patients such as AMI, stroke, acute coronary syndrome (ACS) (angina), and lower extremity amputation due to PAD.


Figure 7-4 • Long-term Effects of Intensive Management of T1DM Patients on CV Outcomes. Patients who were intensively managed during the DCCT demonstrated a 57% reduction in nonfatal Ml, stroke, and CV-related deaths during the 10-year follow-up study (EDIC). (Adapted from The Diabetes Control and Complications Trial/Epidemiology of Diabetes Interventions and Complications (DCCT/EDIC) Study Group. ntensive diabetes treatment and cardiovascular disease in patients with type 1 diabetes. N Engl J Med. 2005;353:2643-2653.)

The major and independent risk factors for CHD are cigarette smoking of any amount, elevated BP, elevated serum total cholesterol and LDL-C, low serum high-density lipoprotein cholesterol (HDL-C), diabetes mellitus, and advancing age (Table 7-4). Preventive efforts should target each major risk factor. Any major risk factor, if left untreated for many years, has the potential to pro-duce CHD. Nonetheless, an assessment of total (global) risk based on the summation of all major risk factors can be clinically useful for three purposes: (a) identification of high-risk patients who deserve immediate attention and intervention, (b) motivation of patients to adhere to risk-reduction therapies, and (c) modification of intensity of risk-reduction efforts based on the total risk estimate.

The Framingham Risk Score (FRS) incorporates well-established risk factors such as age, sex, smoking history, blood pressure (BP), total serum cholesterol, HDL-C, and blood glucose (or his-tory of diabetes) into a risk calculation model.23 However, Framingham tends to underestimate the true 10-year CV risk associated with having T2DM.24 The initial Framingham cohort included a low baseline prevalence of patients with diabetes while omitting any reference to triglycerides (TGs), an important determinant in CV risk for patients with T2DM.25 This leads to wide confidence intervals in the overall predicted risk. A wide confidence interval implies that more data should be collected before conclusions may be made in regard to defining specific risk within a given cohort.

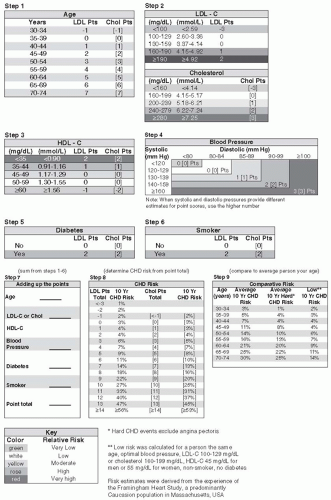
The modified FRS (Fig. 7-5) addresses short- and long-term CV risks in adults with existing CHD. Patients characterized as being “high risk” are predicted to have at least a 2% to 3% yearly likelihood of having a significant cardiac event.26 The American College of Cardiology recommends aggressive risk reduction for all patients with diabetes as displayed in Table 7-5 as these individuals have CHD risk equivalent disease.27

Disease risk factors can be defined as measurable biologic characteristics of an individual that precede a well-defined outcome of a disease (such as myocardial infarct), predict that outcome, and
are directly related to the pathogenic pathway. In contrast, nontraditional biomarkers are biologic indicators of a disease process that are involved in the development of the disease, which may or may not be causal.28 Risk factors identify asymptomatic individuals who have a greater chance of developing a disease compared with the general population. A clinically useful biomarker should meet both of the following criteria: (1) evidence from prospective studies either cohort or random-ized trials across a broad range of populations demonstrating independent prediction of vascular events with reclassification of risk based upon the inclusion of that biomarker and (2) therapies that modify a given biomarker should be available that would otherwise not be used in the at-risk popu-lation. A biomarker that is not useful in predicting disease causality is not considered a risk factor, yet may still elucidate vital information related to disease progression. Biomarkers may also be useful in drug development and measuring therapeutic outcomes. Table 7-6 lists several novel biomarkers related to inflammation, oxidative stress, and insulin resistance.


TABLE 7-4. Risk Factors for CVD


Major Risk Factors


Predisposing Risk Factors


Smoking


Obesitya


Hypertension


BMI categories


Elevated LDL-C, low HDL-C


• 18.5-24.9 kg/m2


Normal


Diabetes


• 25-29 kg/m2


Overweight


Advancing age


• >30.0 kg/m2


Obesity


Abdominal obesity (defined as a waist circumference >40 inches in men and 35 inches in women)


Physical inactivitya


Family history of premature CHD


Ethnic characteristics


Psychosocial factorsb


Elevated serum TGs


Small LDL-C particles


Elevated serum homocysteinec


Elevated serum LP(a)


Prothrombotic factors (e.g., fibrinogen, PAI-1)


Inflammatory markers (e.g., CRP)


a These risk factors are defined as major risk factors by the AHA.


LDL-C, low-density lipoprotein cholesterol; HDL-C, high-density lipoprotein cholesterol; BMI, body mass index; PAI-1, plasminogen activator inhibitor-1; CRP, C-reactive protein


The U.S. Preventive Services Task Force (USPSTF) has stated that the use of “high-sensitivity C-reac-tive protein (hs-CRP), ankle-brachial index (ABI), leukocyte count, fasting blood glucose level, periodon-tal disease, CIMT, coronary artery calcification score on electron-beam computed tomography (EBCT), homocysteine level, and lipoprotein(a) [Lp(a)] level are insufficient to screen asymptomatic patients with no history of CHD for primary prevention.”29 To be fair, the USPSTF recommendation statement clearly says that the critical gap in the evidence for screening with nontraditional risk factors is the lack of infor-mation on subsequent reductions in risk for CHD events in persons identified by the new risk factors.

The Centers for Disease Control and Prevention (CDC) and the American Heart Association (AHA) released a joint statement in 2003 on the use of hs-CRP in assessing CHD risk.30 Their recom-mendations include the following:


  • hs-CRP is the CHD inflammatory marker of choice for clinical practice.


  • Patients with an intermediate (10% to 20%) risk of CHD may benefit from measurement of hs-CRP for evaluation and therapy decisions (this would include all patients with diabetes).


  • hs-CRP may be useful for estimating prognosis in patients with CHD (including death and recurrent events).


Figure 7-5 • Framingham Modified Risk Score Calculations. Online calculator available at: http://www mdcalc.com/framingham-cardiac-risk-score. Note: The modified FRS is validated for patients ages 35 to 74.


TABLE 7-5. Interpretation and Treatment Intensification Based on Modified FRSs


Low Risk (˜35% of patients)


Low-risk Framingham Risk Score and no major CHD risk factors; minimal risk estimate


Provide reassurance and retest in about 5 y


Intermediate Risk (˜40% of patients)


≥1 major abnormal risk factor or posi-tive family history of CHD; global risk estimate: 0.6%-2%/y


Patients may benefit from noninvasive testing for further risk assessment


High Risk (˜25% of patients)


Established CHD or atherosclerotic disease (PAD, CAD, atherosclerotic cardiovascular disease (ASCVD), TIA, or stroke); T2DM or multiple CHD risk factors; hard CHD risk: >20% in 10 y


Candidates for intensive risk factor intervention without further risk factor assessment to determine treatment goals


From Greenland P, Smith SC Jr, Grundy SM. Improving coronary heart disease risk assessment in asymptomatic peo-ple: role of traditional risk factors and noninvasive cardiovascular tests. Circulation. 2001; 104(15): 1863-1867


Hyperglycemia is associated with a rise in hs-CRP. Hypertensive patients with T2DM have the highest plasma levels of hs-CRP suggesting that these individuals have an active and on-going inflammatory process perhaps predisposing them to CVD.31 In 2008, the JUPITER trial was published that showed that statin use (rosuvastatin) in healthy men aged greater than 50 and in healthy women aged greater than 60 with an LDL-C of less than 130 mg per dL and an hs-CRP greater than 2 mg per L decreased the incidence of a first MI by 48% and stroke by 55%.32 The best primary prevention CV outcomes occurred in patients who attained an LDL-C of less than 70 mg per dL and an hs-CRP of less than 1 mg per L with rosuvastatin.33 In general, hs-CRP levels may be reduced with the use of statins, β-blockers, or aspirin by 20% to 30%.34,35

A 15-year longitudinal observational study demonstrated that plasma vitamin D levels less than 13.9 nmol per L in patients with T2DM place them at increased risk for all-cause mortality includ-ing deaths from CVD.36 Vitamin D appears to mitigate vascular inflammation by affecting foam cell (macrophages which ingest oxidized LDL) formation and signaling in individuals who do not have diabetes.37

Several risk engines are useful in assessing the likelihood of developing heart disease and strokes. The UKPDS Risk Engine (available for downloading at: http://www.dtu.ox.ac.uk/index. html7maindoc=/riskengine/download.html) provides risk estimates and 95% confidence intervals in patients with T2DM not known to have heart disease. A patient’s risk for heart disease and stroke can be calculated for any given duration of T2DM based on current age, sex, ethnicity, smoking status, presence or absence of atrial fibrillation, and levels of A1C, systolic BP, total cholesterol, and HDL-C.

One of the most detailed and patient-friendly global risk engines, Diabetes PHD (Personal Health Decisions), can be accessed as a link through the American Diabetes Association (ADA) Web site (https://www.diabetes.org/phd/profile/start.jsp). Diabetes PHD can be used to explore the effects of a wide variety of health-care interventions (both behavioral and pharmacologic) on the 30-year risk of developing a heart attack, stroke, kidney disease, lower extremity amputation, and DR. Infor-mation that needs to be uploaded into the site includes a detailed health history (MI, stroke, angina, bypass surgery, angioplasty, heart failure, retinopathy, albuminuria, CKD or ESRD, diabetic neuropa-thy, neuropathic ulcer), age, ethnicity, sex, height, weight, lipid levels, smoking history, BP reading, dates of last eye exam, frequency and intensity of exercise, frequency of office visits, A1C, foot exam, presence and level of proteinuria, list of medications, length of time patient has used aspirin, family history of diabetes and/or CVD, and a list of all current medications related to managing diabetes, hypertension, and hyperlipidemia. Diabetes PHD, as powered by a health modeling program known as Archimedes, then calculates the patient’s risk of developing microvascular and macrovascular
complications over the next 30 years. Patients can explore the effects various treatment interventions (both pharmacologic and behavioral) will have on predicted microvascular and macrovascular outcomes using this web site. An updated version of Diabetes PHD is currently being developed by the ADA.


TABLE 7-6. Novel Biomarkers Used in the Assessment of Patients with Diabetes


Biomarker


Comment


Leptin


One of the adipose tissue’s adipokines (bioactive proteins). In animal models, leptin levels are higher with higher fat mass. Leptin theoreti-cally acts as a regulator to decrease appetite in the presence of obe-sity and to increase energy expenditure. Obese people may be “leptin resistant.” Subcutaneous injections of leptin restores normal appetite and reduces fat mass in children.


Adiponectin


Adipose-specific hormone that has anti-inflammatory and insulin-sensitizing properties. Protective vs. obesity. PPAR drugs, such as thiazoli-dinediones act, in part, by increasing circulating levels of adiponectin Metabolic surαerv also increases adiponectin levels


Plasma 8-isoprostanes and F2 α-isoprostanes


Markers of oxidative stress. Higher levels indicate greater risk of endo-thelial cell dysfunction. Unfortunately, oxidative stress is not mea-sured clinically in adults or children. Experimental measurements of oxidative stress have not been shown to predict future risk of CV events in observational studies. No interventional trials altering oxida-tive stress have affected CV event rates.


CRP


A downstream marker of inflammation that has multiple effects including complement binding, augmentation of expression of adhesions molecules, and decreased expression of the vasodilator endothelial NO synthase. CRP may also stimulate the expression of the thrombotic factor, PAI-1 and induce oxidative stress. Adipocytes release IL-6 and TNF-α that stimulate the liver to produce CRP Obesity and CRP levels are positively correlated. CRP levels are independent predictors of stroke and Ml.aWeight loss and reducing saturated fat intake reduce CRP levels in children.


Vitamin D


Plasma levels of vitamin D (25-hydro×yvitamin D3) <13.9 nmol/L are predictive of CV mortality independent of conventional risk factors includ-ing glycemic control and independent of one’s history of CKD.b


a Ridker PM, Danielson E, Fonseca FAH, et al. JUPITER Trial Study Group. Reduction in C-reactive protein and LDL cholesterol and cardiovascular event rates after initiation of rosuvastatin: a prospective study of the JUPITER trial. Lancet 2009;373(9670):1175-1182.


b Joergensen C, Gall MA, Schmedes A, et al. Vitamin D levels and mortality in type 2 diabetes. Diabetes Care. 2010;33:2238-2243.


Targeting Optimal Metabolic Control in Patients with T2DM

Data from the UKPDS suggested that improved glycemic control reduced the risk of CVD and deaths as well as all-cause mortality38 However, three recently published large, randomized, controlled trials (ADVANCE, ACCORD, and VADT) found no evidence that intensive glycemic control had a major effect on CV outcomes (Table 7-7).39,40,41

ACCORD identified an increased risk for death from CV causes and total mortality associated with intensive glucose control, thereby providing little guidance on how to manage metabolic control in high risk patients with type T2DM. The lessons learned from these landmark studies are listed in Table 7-8.


TABLE 7-7. Summary of ACCORD, ADVANCE, and VADT Clinical Trial Data


Study


Demographics


Goal of Study


Primary End Point


Secondary End Points


Results


Interpretation


VADT


1,791 veterans. Median A1C >75%. Mean age 60.4 y. 40% of subjects had history of a CV event.


Reduce A1C <1.5% in the intensive-therapy group compared with the standardtherapy group


Median followup 5.6 y


Modifiable risk factors were treated identically in the 2 groups


Time from randomization to 1st occurrence of Ml, stroke, death from CV event, CHF, surgery for vascular disease, inoperable coronary disease, amputation for ischemic gangrene


Progression to sensory neuropathy, albuminuria, and retinopathy


No differences noted in primary outcomes


No differences in secondary outcomes


Intensive therapy doubled the frequency of severe hypoglycemia (2.3 vs. 1.1 %/y)


Median weight gain of 6.8 kg in intensive group


Glucose control has no impact on CV outcomes


ACCORD


10,251 patients. Median A1C 8.1%. 38% of women and 35% of men had a previous CV event


4,733 patients were randomly assigned to receive intensive BP therapy (systolic target <120 mm Hg) vs standard BP therapy (systolic target <140 mm Hg]


Intensive therapy targeted an A1C <6% vs. standard therapy targeting A1C to 7%-79%


Nonfatal Ml, nonfatal stroke, death from CV causes


Death from any cause


At 1 year, the stable median A1C was 6.4% in intensive group and 7.5% in standard group. 257 patients in the intensive group died vs. 203 in the conventional cohort. This led to a discontinuation of intensive therapy after a mean of 3.5 years of follow-up


ntensive control may reduce risk of Mis, but favors an increased risk of death


5,518 patients were randomly assigned to receive either fenofibrate or placebo while maintaining good control of LDL-C with simvastatin


3 times more frequent annual episodes of severe hypoglycemia in intensive group vs. conventiona group (4.6 vs. 1.5%)


27.8% of intensive group gained >10 kg vs. only 14.1 % of conventiona group. Median weight gain of intensive group was 3.5 kg


No differences in progression toward cardiac autonomic neuropathy between the 2 groups


ADVANCE


11,140 patients. Median A1C = 72%.32% had history of prior macrovascular disease. 3% had macroalbuminuria and 7% had retinopathy


Intensive glucose control using gliclazide plus other drugs as required to achieve an A1C<6.5% vs. standard glucose control


BP was controlled with either perindopril + indapamide or matching placebo


Median 5 y follow-up


Death from CV causes nonfatal Ml or stroke. New or worsening macroalbuminuria, doubling of serum creatinine to at least 2.26 mg/dL needed for renal replacement, death due to renal disease. Development of retinopathy (proliferative retinopathy, macular edema or diabetes-related blindness or the use of retinal photocoagulation therapy


Deaths from any cause, death from CV causes, coronary revascularization, TIA, CHF, worsening of New York Heart Association class of CHF, new or worsening nephropathy, new or worsening retinopathy, development of microalbuminuria, new or worsening neuropathy, decline in cognitive function, hospitalization for more than 24 h, hypoglycemic events


No reduction in macrovascular events with intensive therapy.


21 % reduction in nephropathy, 5% reduction in retinopathy (not significant)


3 time greater annual incidence of severe hypoglycemia in intensive cohort vs. conventional group (1.8 vs. 0.6%).


Median weight gain of intensive group was 0.7 kg


Intensive glucose control has no impact on CV risk reduction but may slightly improve progression of nephropathy


Data from Action to Control Cardiovascular Risk in Diabetes Study Group. Effects of intensive glucose lowering in type 2 diabetes. N Engl J Med. 2008;358:2545-2559; Group AC, Patel A, MacMahon S, et al.; ADVANCE Collaborative Group. Intensive blood glucose control and vascular outcomes in patients with type 2 diabetes. N Engl J Med. 2008;358:2560-2572; Duckworth W, Abraira C, MoritzT, et al.; VADT Investigators. Glucose control and vascular complications in veterans with type 2 diabetes. N Engl J Med. 2009;360:129-139.


Based upon the studies mentioned above, health-care providers should focus their efforts on combining elements of lifestyle modification, glycemic control, which minimizes hypoglycemia and weight gain, BP reduction, and optimal lipid lowering to reduce macrovascular complications in patients with T2DM.


Macrovascular Complications in Patients with T1DM

Although less studied than in patients with T2DM, macrovascular complications can impact those individuals with T1DM at a younger age (less than 40 years), be more diffuse, have a greater accelerated course to end-stage outcomes than observed in the general population. The Pittsburgh Epidemiology of Diabetes Complications study demonstrated that both men and women had similarly increased risk of premature coronary artery disease (CAD), although risk factors, such as renal impairment appeared to be gender specific.42 As with T2DM, risk factors for macrovascular complications in T1DM include hypertension, smoking and dyslipidemia, insulin resistance, African American race, and disease duration.43,44

Genetic variation may play a major role in predicting which patients may be predisposed to CHD. In the Pittsburgh EDC study, patients who carried the haptoglobin (Hp)2-2 genotype had a twofold greater risk of CHD than those expressing the Hpl-1. A major limitation for the management of CHD in T1DM is the lack of a validated risk engine for this patient population. Therefore, genetic studies may prove valuable in future risk assessment in patients with T1DM.45

Long-term follow-up of the intensively treated patients in the DCCT suggest that treatment to AlC targets less than 7% in the years soon after the diagnosis of the disease is associated with reduction in macrovascular risk.19 The establishment of “metabolic memory,” appears to warrant treating hyperglycemia as soon as possible, for as long as possible, as low as possible, as safely as possible, and as rationally as possible in all patients with diabetes.46


Reducing Macrovascular Risk in Patients with Diabetes


• Targeting Hypertension in Diabetes Patients

BP reduction in patients with diabetes improves long-term outcomes. The HOT study reported a 51% reduction in cardiac events in the diabetes subpopulation (n = 1,501) who were able to intensively reduce their diastolic BP to lower than 80 mm Hg.47 Likewise, the UKPDS reported significant reductions in all diabetes-related endpoints, deaths, stroke, and microvascular complications when the BP in diabetic subjects was intensively lowered to 144/82 mm Hg versus 154/87 mm Hg.17

Hypertension must be treated vigorously in all patients with diabetes to limit and/or prevent the progression of both macrovascular and microvascular complications. The BP target for a patient without evidence of microalbuminuria is less than 130/80 mm Hg.48 Patients with isolated systolic hypertension (systolic BP greater than 180 mm Hg) should be treated to a target of 160 mm Hg initially and then to 140 mm Hg if the treatment is well tolerated.49 The treatment of hypertension for patients with CKD is addressed in Chapter 6.

As a general rule, reductions in systolic or diastolic BP of 5% to 10% occur with most single antihypertensive agents. Therefore, more than one drug is often needed to treat patients with diabetes and hypertension to target. Often the addition of a small or moderate dose of a second drug offers better control with fewer side effects than using full doses of the first agent of choice.

Dietary and lifestyle management of hypertension may be effective at lowering BP in some individuals. Weight reduction of 1 kg independent of sodium restriction can reduce mean arterial pressure by 1 mm Hg.50 Sodium restriction has not been tested in controlled trials enrolling patients
with diabetes. However, a reduction of 2 to 4 g of sodium per day can reduce systolic BP by 5 mm Hg and diastolic BP by as much as 2 to 3 mm Hg. Excessive use of sodium (3 to 5 g per day) may nullify the positive BP lowering effects of angiotensin converting enzyme (ACE) inhibitors.51 Walking 30 to 45 minutes daily while stopping smoking and alcohol consumption will likely improve hypertension.


TABLE 7-8. Lessons Learned from ACCORD, ADVANCE, and VADT (Implications for Clinical Practice)


  • Patients with recently recognized diabetes and no prior CVD history should have metabolic targets directed toward normal or near-normal levels.


  • In patients with established T2DM (≥8—10 y duration) and recognized CVD, glycemic control targets should be carefully scrutinized and individualized. Normalizing glucose levels in such patients does NOT reduce the risk of further CVD events or mortality


  • Aggressive glucose titration to A1 C targets <6.5% were associated with a threefold increased risk of severe hypoglycemia


  • Intensive glycemic therapy is likely to result in weight gain. Weight gain in ACCORD averaged 6 lb. 20% of ACCORD subjects gained >10 kg


  • Medications (including insulin) that are weight neutral or favor weight loss are preferred agents for patients with diabetes


  • Intensive glycemic control appears to reduce the risk of nephropathy progression


  • In order to achieve and maintain A1 C targets of <6.5% in patients with advancedT2DM of long duration, multiple medications are required


  • Patients with heart disease, hypoglycemic unawareness, advanced neuropathy, reduced life expectancy, advanced age, or those who live alone and may be unable to manage a hypoglycemic event should have a target A1 C of >75%


  • Hypoglycemia risk was greatest for those who attempted to achieve targeted control but did not succeed. This suggests a relationship between hypoglycemia, glycemic variability, and weight gain.


  • For patients who died during ACCORD, no glucose was recorded at the time of death


  • Safety and efficacy of medications trump cost (per American Association of Clinical Endocrinologists)


  • Physicians should aggressively manage hyperglycemia during the earliest phases of diabetes in order to minimize microvascular and macrovascular complications


  • These studies did NOT address strategies for lowering A1 C in low-risk patients with T2DM (those without CVD)


  • Appropriate management of diabetes requires interpretation and treatment of glycemia, BP, lipids, and the patient’s hypercoagulation state. Lifestyle interventions such as smoking cessation and promoting physical activity and weight loss remain the foundations of diabetes care.


From Gaede P Lund-Andersen H, Parvig HH, et al. Effect of a multifactorial intervention on mortality in type 2 diabetes N Engl J Med. 2008;358 (6):580-591.


The treatment for hypertension as recommended by the ADA is summarized in Table 7-9.


• Ambulatory Blood Pressure Monitoring for Patients with Diabetes

Ambulatory blood pressure monitoring (ABPM) should be considered as a means of assessing hypertensive treatment in patients with diabetes. Ambulatory monitoring provides information regarding the true, or mean, BP level, the diurnal rhythm of BP, and the BP variability52 ABPM has had limited use in the United States outside of clinical trials over the past decade, while becoming
the standard of care for monitoring BP in Europe and Asia. Patients wear the BP cuff on one arm and a recorder on their belt for 24 hours. The data can be downloaded by a physician or through a web site portal. Several disease state patterns are easily discernible using ABPM as shown in Figure 7-6.


TABLE 7-9. Management of Hypertension in Patients with Diabetes


Only gold members can continue reading. Log In or Register to continue

Stay updated, free articles. Join our Telegram channel

May 25, 2016 | Posted by in ENDOCRINOLOGY | Comments Off on Exploring the Association between Diabetes and Cardiovascular Disease

Full access? Get Clinical Tree

Get Clinical Tree app for offline access

Screening and Diagnosis


Goals


Treatment


  • Measure BP at each visit


  • A BP>130/=80mm Hg on 2 separate days confirms the diagnosis of hypertension


  • Target BP <130/80 for most patients