Range
Scan delay time (s)
Slice thickness (mm)
Additional slice (mm)
Reconstruction images
Precontrast
Liver〜Kidney
2.5
Early arterial phase
Liver〜Kidney
25
2.5
1.25
3D (VR) MIP
Late arterial (pancreatic) phase
Liver〜Kidney
40
2.5
1.25
MIP (3 mm · 1 mm space)
Portal phase
Liver〜Kidney
70
2.5
1.25
MIP (3 mm · 1 mm space)
Equilibrium phase
Liver〜Pelvis
180
2.5
1.25
MIP (3 mm · 1 mm space)
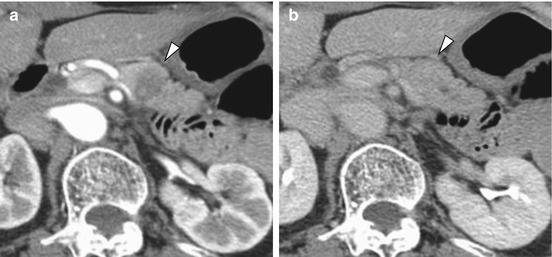
Fig. 3.1
Pancreatic body cancer showing isodensity on dynamic CT equilibrium phase. In dynamic CT arterial phase (a), an ischemic tumor in the pancreatic body (arrowhead) is pointed out. However, in the equilibrium phase (b) the tumor shows delayed staining and isodensity with the peripancreatic parenchyma. Only in the postcontrast equilibrium phase there is a danger of overlooking the tumor
Dynamic CT imaging requires imaging of at least four phases: early arterial phase (after 25 s), late arterial phase (pancreatic parenchyma phase) (after 40 s), venous phase (after 70 s), and equilibrium phase (after 180 s) [1]. From the arterial-dominant phase data 3D images (volume rendering: VR) can be prepared and facilitate evaluation of the arterial anatomy and arterial invasion (Fig. 3.2). Also, from the pancreatic parenchyma phase data, reconstruction images such as coronal, sagittal or oblique ones parallel to the pancreatic head and body/tail can be prepared and used to determine tumor spread and vessel invasion since it is also important to evaluate these factors from a viewpoint different from that of transverse images (Figs. 3.3 and 3.4) [4, 5]. Since on pancreas arterial phase dynamic CT images or slab MIP images superimposed with pancreatic parenchyma phase or portal vein phase four 2.5 mm thick slices (10 mm thick) or seven slices (17.5 mm thick) the peripancreatic arteries and veins are depicted continuously along their length in a single cross section, the preoperative vessel anatomy and presence/absence of anatomical variants can be instantly grasped (Fig. 3.5). slab MIP images in the portal venous phase are useful for the evaluation of the normal peripancreatic venous anatomy. They can identify the right colic vein that flows into the gastrocolic trunk (GCT), middle colic vein, jejunal vein that flows into the gastro-epiploic and superior mesenteric veins, and inferior mesenteric vein that flows into the splenic or superior mesenteric vein, as well as evaluate the presence/absence of tumor invasion and of venous dilatation indicating collaterals associated with venous stenosis or occlusion (Figs. 3.6 and 3.7).
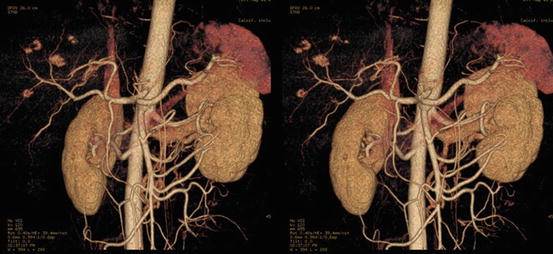
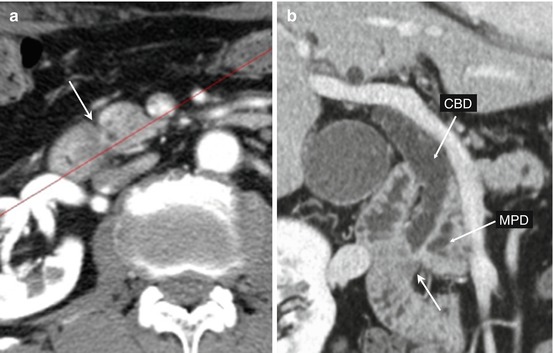
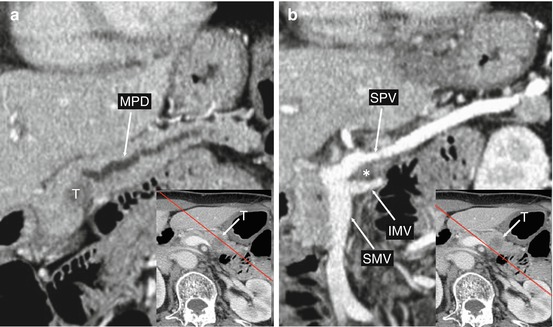
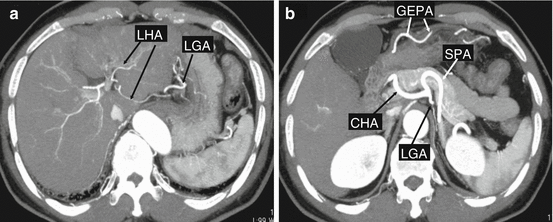
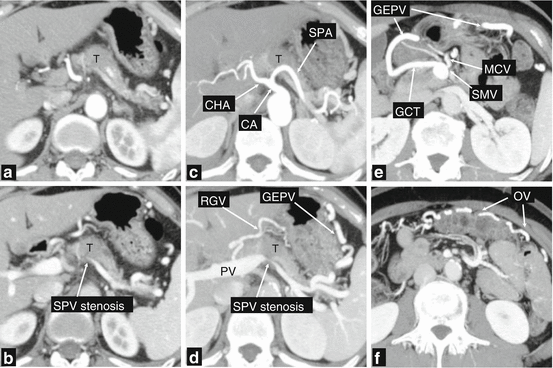
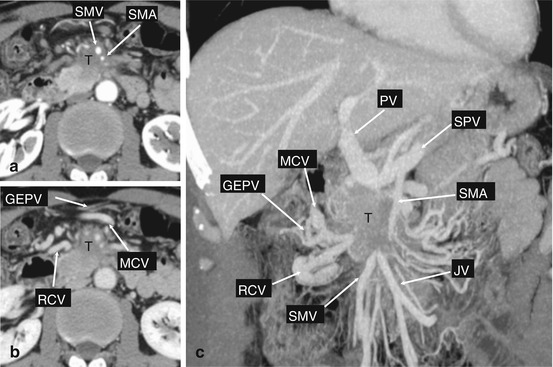

Fig. 3.2
By subjecting dynamic CT arterial phase 3D (VR) image and 3D VR (Volume Rendering) images to stereoscopic vision (cross-over method), the influence of vessel overlap can be made to disappear, thereby facilitating precise identification of the vasculature up to its distal portions. Stereoscopic vision is thus recommended for preoperative evaluation of the arterial anatomy

Fig. 3.3
Groove pancreatic cancer. In dynamic CT arterial phase (a), an ischemic tumor (arrow) is found in the groove region. On oblique coronal section images (b) reconstructed with a red reference line, occlusion by the groove tumor (arrow) of the common bile duct (CBD) and main pancreatic duct (MPD) can be evaluated on a single cross section

Fig. 3.4
Splenic vein and inferior mesenteric vein invasion by pancreatic body cancer. These are oblique sagittal section reconstruction images (a, b) taken parallel to the pancreatic body in the portal venous phase of dynamic CT. An ischemic tumor (T) occluding the main pancreatic duct (MPD) extends posteroinferiorly (asterisk), with findings suggestive of invasion of the inferior mesenteric vein (IMV) at the junction of the splenic vein (SPV) and superior mesenteric vein (SMV) noted

Fig. 3.5
Dynamic CT late arterial phase of normal pancreas, slab MIP image (12.5 mm thick). On slab MIP image (12.5 mm thick) (a, b) prepared by overlapping seven 2.5 mm thick slices, it can be easily noticed that the left hepatic artery (LHA) branches from the left gastric artery (LGA). Also, since the splenic artery (SPA) branching from the celiac artery (CA) and common hepatic artery (CHA) are depicted along their length in a single cross section the vessel anatomy can be well appreciated. The left gastric artery (LGA) that branches posterior to the celiac artery root and the gastro-epiploic artery (GEPA) that runs along the greater curvature side of the stomach can also be identified

Fig. 3.6
Pancreatic body cancer with retroperitoneum invasion, splenic artery and splenic vein invasion, and collateral formation evaluated by slab MIP imaging (17.5 mm slice thickness). On dynamic CT arterial phase with 2.5 mm slice thickness (a), an ischemic tumor (T) is found in the pancreatic body. Invasion of the serous membrane and retroperitoneum is suspected. On the portal vein phase (b), stenosis of the splenic vein (SPV) is seen to have been induced by tumor invasion. In the arterial phase of 17.5 mm thick slab MIP (c), invasion by the tumor (T) of the splenic artery (SPA) branching from the celiac artery (CA) is clearly discernible, while invasion of the common hepatic artery (CHA) is not found. On slab MIP (17.5 mm thick) portal vein phase (d–f), the development due to splenic vein (SPV) stenosis of perigastric venous collaterals [short gastric vein〜 right gastric vein (RGV)~portal vein (PV) and gastroepiploic vein (GEPV)~GCT (gastrocolic trunk)~superior mesenteric vein (SMV), middle colic vein (MCV), omental vein (OV)] can be clearly grasped

Fig. 3.7
Pancreas uncinate process cancer with superior mesenteric arteriovenous and mesentery root invasion. On dynamic CT arterial phase (a), an ischemic tumor (arrow) is found in the pancreatic head. The tumor extends anteriorly involving the superior mesenteric artery (SMA) and superior mesenteric vein (SMV). (b) Since GCT is occluded by invasion of the tumor, venous stasis is induced and the gastro-epipolic vein (GEPV), middle colic vein (MCV), and right colic vein (RCV) are dilated. In venous phase convolution on MIP images (coronal) (c), venous dilatation (RCV, GEPV, MCV) due to GCT occlusion is clearly seen. Occlusion is also noted of the jejunal vein (JV) at the juncture with the superior mesenteric vein (SMV). That the pancreatic head cancer has extensively invaded the mesocolon and mesentery can be clearly concluded from the venous occlusion
3.3 Diagnosis of Extent of Spread of Pancreatic Cancer
CT is central to the diagnosis of the extent of the local spread of pancreatic cancer, and as shown in Table 3.2 evaluation of eight factors is required.
Table 3.2
Diagnosis of extent of spread of pancreatic cancer
Bile duct invasion | CH | |
Duodenal invasion | DU | |
Serosal invasion | S | Pancreatic serosa, omentum, mesentery, and mesocolon |
Retroperitoneal invasion | RP | Retropancreatic connective tissue |
Portal venous invasion | PV | Portal vein, superior mesenteric vein, splenic vein |
Arterial system
Stay updated, free articles. Join our Telegram channel
Full access? Get Clinical Tree
 Get Clinical Tree app for offline access

|
