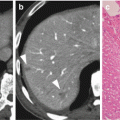
Fig. 4.1
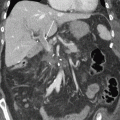
(a) Computed tomography (CT) and positron emission tomography (PET) images of a 74-year-old woman diagnosed with locally advanced pancreatic cancer on conventional imaging. No definite mass is seen in the liver on CT images. PET scan reveals a focus of fluorodeoxyglucose (FDG) uptake to S4 of the liver, suggestive of metastasis (arrow). (b) PET images of a 73-year-old man. PET scan shows a focus of increased FDG uptake in the right supraclavicular fossa (arrow). A pathological examination of each specimen revealed metastatic adenocarcinoma from the pancreas
Delbeke et al. reported that PET is more accurate than CT for detecting primary pancreatic cancers and for identifying hepatic and distant metastases [23]. They described PET-detected occult DMs in 14% of all patients and changed the clinical decision in 43% (28 of 65) of patients. These metastatic patients demonstrated a significantly worse overall survival (OS) than patients without metastatic disease (median OS, 9.1 vs. 14.6 months, p < 0.001). In recent studies, the addition of PET-CT changed the planned surgical treatment in 10–16% of cases as a result of detecting occult metastatic disease [24, 25]. The proportion of change in management was significantly higher in patients who were considered to have borderline resectable compared with resectable disease (17% vs. 7%, p = 0.019). Topkan et al. restaged with PET-CT before CRT in 71 patients with unresectable LAPC, and 19 patients (26.8%) were found to have DMs that were not identified initially on conventional imaging [26]. The treatment intent for these patients was changed from curative to palliative. Chang et al. [22] reported that integrating PET with conventional imaging tools facilitated the detection of 33% of unsuspected DMs in LAPC patients and allowed them to receive systemic chemotherapy (Fig. 4.1).
4.3 Determining Prognosis According to PET-CT Parameters and Assessment of Metabolic Response by Neoadjuvant Treatment
Before beginning neoadjuvant therapy such as chemotherapy and radiation therapy, accurate tumor staging is required. Conventional staging of patients scheduled to receive neoadjuvant therapy is based on CT or MRI. PET improves staging because of its high sensitivity and specificity in identifying tumor extent and metastasis. Recent data has suggested that PET-CT might be able to predict treatment response to CRT in patients with pancreatic cancer. Bang et al. reported that PET-detected treatment response, whereas CT could not detect any treatment response due to fibrotic changes after CRT [27]. In addition, the authors suggested that CT was not an accurate method for evaluating tumor response because CT cannot assess the viability of tumor cells directly. Treatment of aim, radiotherapy dose, and volume seem to be affected in many patients, according to emerging data incorporating PET into the RT-planning process. Conventional RT planning based only on CT or MRI findings is likely to miss regions of macroscopic tumors in some patients, resulting in a treatment volume that is too small, and leads to the irradiation of unnecessarily large treatment volumes in other patients. In addition, anatomic imaging is inadequate in patients with uncertain tumor boundaries. Delineating target volume in this setting is fraught with a large degree of interobserver variability. PET appears to be very useful as a molecular imaging method in these situations. Conversely, PET cannot be used alone for treatment planning, due to the very limited anatomic information available on PET scans. Thus, combining PET-CT in the RT-planning process, performing scanning in the RT position, may be very beneficial. Previously, PET and CT images were made on two independent scanners and required software co-registration of images. While most studies using combined PET and CT images have been of RT for lung cancer, the efficacy of this method for other tumors, such as head and neck, gynecologic, and anorectal cancers, has recently been demonstrated. PET-CT imaging can now be performed on combined in-line PET-CT scanners providing hardware co-registered data. This method facilitates the integration of PET imaging data into the treatment-planning process. The available data has suggested that the addition of PET improves target delineation, thereby leading to a reduction in interobserver variability and missed tumors within the RT field, whereas organ-at-risk (OAR) volumes are smallest on MRI. To compare differences in target volume delineation and RT dose distribution between PET-CT and CECT, Li et al. evaluated the sparing of OARs in the treatment plan of locally advanced pancreatic cancer [19]. Mean non-CE GTVCT, GTVPET, and GTVPET-CT were 76.9 ± 47.8, 47.0 ± 40.2, and 44.5 ± 34.7 cm3 (mean ± standard deviation), respectively. Non-CE GTVPET-CT was significantly smaller than non-CE GTVCT (p < 0.001), and CE GTVPET-CT was significantly smaller than CE GTVCT (p = 0.033). In OARs, there were significant differences between non-CE CT and non-CE PET-CT in the intestine D max (p = 0.023) and right kidney D mean (p = 0.029). Like other studies, this study suggested that co-registration of 18F-FDG PET with CECT might improve the accuracy of GTV delineation in LAPC and might reduce the adverse effects of irradiation. Parlak et al. [28] grouped cases into GTV less (GTVL) versus greater (GTVG) than cutoff value determined by receiver operating characteristic analysis, and they compared OS, locoregional relapse-free survival (LRRFS), and progression-free survival (PFS). In their study, patients in the GTVL group had significantly better OS, LRRFS, and PFS than the GTVG group. Parlak et al. used three-dimensional tumor volume to define the tumor, based on studies suggesting that one-dimensional tumor measurements might not be as representative of real tumor volume measurement, especially in variable tumor shapes. Titola et al. [29] proposed that one-dimensional volume estimation of irregularly shaped tumor-like phantoms should be replaced by computer-based tumor volume measurement. The favorable OS, LRPFS, and PFS observed in the GTVL patients compared with the GTVG patients suggests a potential for PET-CT-defined GTV size in predicting outcomes of LAPC patients treated with definitive CRT, which needs to be validated by further studies with prospective cohorts. The current studies have demonstrated the use of PET as a predictive imaging tool in managing pancreatic cancer patients with CRT. Some of the prognostic factors they evaluated included performance status, GTV, SUV, and pre-CRT CA19-9 levels. Bjerregaard et al. suggested that good performance status with small tumors was also indicative of a favorable prognosis [30].
4.3.1 The Clinical Implications of SUV Values
Evidence of the association between SUVmax and survival can be found in other various ways, and Table 4.1 shows that the cutoff values of SUVmax for predicting survival are variable (3.4–7.0). It is suggested that SUVmax indicates the activity and grade of cancer. Ahn et al. evaluated histopathological differentiation grades and SUVs in pancreatic cancer and found that there was a significant correlation between SUV and pathological grade (p < 0.01) [39]. There was also a significant correlation between SUV and survival (p < 0.01), with better prognosis in the lower SUV group. Topkan et al. [37] stratified patients into two groups according to median difference between pre- and post-treatment SUVmax as a value of response for comparison, and they suggested that the difference in SUVmax values was the predictive value for OS, PFS, and LRPFS. Schellenberg et al. [31] grouped patients into high-SUVmax versus low-SUVmax subgroups by placing them above or below the median SUVmax. Their results showed that median survival was 9.8 vs. 15.3 months for the high- and low-SUVmax subgroups (p < 0.01). On multivariate analysis, clinical SUVmax was an independent predictor for OS (p = 0.03) and PFS (p = 0.03). Thus, there is consensus that poorer survival is associated with high-SUVmax values [40]. On the other hand, Asagi et al. [9] suggested that categorizing benign and malignant pancreatic tumors based on the SUVmax is difficult, as SUVmax sometimes overlapped in these situation. In addition, they reported that the values for different stages were not significantly different, except that the SUVmax of invasive pancreatic ductal cancer tended to be higher than those of other pancreatic tumor diseases, excluding benign pancreatic endocrine tumors. Overall, there is still no consensus or standard on defining the threshold for PET-based tumor volume delineation. In predicting pancreatic cancer recurrence, a SUVmax of 3.0 was the cutoff value for predicting tumor recurrence. To determine the effect of blood glucose level correction on SUV, Lee et al. stated that blood glucose level-corrected SUV (SUVgluc) was calculated as SUVmax × blood glucose level/100, and they suggested that a SUVgluc of 4.8 was the cutoff value for predicting tumor recurrence [35].
Table 4.1
Prognostic value of PET parameters of pancreatic cancer according to time of scanning
Scanning time | SUVmax | MTV | TLG | GTV | % change |
|---|---|---|---|---|---|
Before treatment | 100 [28] | ||||
At recurrence | |||||
After neoadjuvant CRT | |||||
4.3.2 SUV Value After Neoadjuvant Therapy
There have been several studies regarding the analysis of SUV after neoadjuvant therapy [22, 27, 38]. Treatment response after chemotherapy or RT in pancreatic cancer is usually assessed within 4–12 weeks after treatment (Fig. 4.2). The correlation between metabolic regression (% change in SUVmax) and pathological response was demonstrated by evaluating a pathological specimen after surgery; a high regression index (≥0.46) was shown, with 71% in the pathological response group versus 26% in the pathological nonresponse group (p = 0.01) [41]. In addition, initial metabolic response was shown to be proportional to size change during subsequent follow-up [42]. In LAPC patients, median SUVmax significantly decreased after 6 weeks of CRT (pre-CRT median SUVmax = 8, range 0–15.6; post-CRT median SUVmax = 3.6, range 0–7.9; p = 0.009) [43]. In Fig. 4.3, Chang et al. showed mean SUVmax values for primary tumors, and the baseline SUV (3.5) and decline in SUV (60%) were significant factors in predicting 1-year OS (sensitivity, 82.9% and 92.3%; specificity, 42.1% and 22.6%, respectively). The decline in SUV from before to after CRT was a median of 37% (range, −100–93%) [22]. However, there were no significant differences (p = 0.853) in mean SUVmax among the response groups, and there were no significant differences in response after the initial 1–2 cycles of chemotherapy according to SUVmax (p = 0.807) [44].
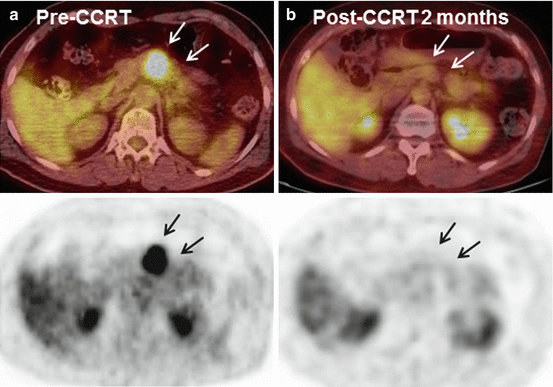

Fig. 4.2


(a) Initial PET image of 64-year-old woman diagnosed with locally advanced pancreatic body cancer (cT3N0M0, with splenic artery, splenic vein, and dorsal pancreatic artery invasion). PET scan shows an about 2.7 cm size mass with intense FDG uptake (mean maximum standard uptake values, SUVmax = 17.34) in the pancreas body, suggestive of malignancy (arrow). (b) PET image of the same patient 2 months after gemcitabine-based concurrent chemoradiotherapy (CCRT). Post-CCRT PET scan reveals further decrease in size of primary pancreatic cancer with significantly decreased FDG uptake (SUVmax = 1.01), suggestive of favorable treatment response (arrow). This patient was judged as having resectable tumor 2 months after initial treatments, and distal pancreatectomy was successfully done. Resected specimen consisted of only fibrosis and ductal dilatation with no residual carcinoma
Stay updated, free articles. Join our Telegram channel

Full access? Get Clinical Tree


