Descriptive epidemiologic features of testicular cancer suggest that the etiologies of seminoma and nonseminoma of the testis differ. To address this, the authors conducted a systematic review of 150 case-control and cohort studies of the etiology of testicular cancer including 1,148 relative risk estimates, stratified by histologic subgroup, reflecting 631 exposures. Their results do not support the hypothesis that seminoma and nonseminoma have different etiologies among adolescents and young men. To date, only descriptive epidemiologic features, including incidence age patterns and incidence time trends of seminoma and nonseminoma, provide evidence suggesting different etiologies, especially among newborns, infants, and elderly men.
The vast majority of testicular cancers are germ cell cancers. The World Health Organization (WHO) classification of testicular germ cell cancers distinguishes between 3 types of germ cell cancers: teratomas and yolk-sac tumors in newborns and infants, seminomatous and nonseminomatous tumors in adolescents and young adults, and spermatocytic seminomas in the elderly. The most well-established risk factors for testicular germ cell cancer are cryptorchidism, a previous germ cell tumor, and a family history of testicular cancer.
The rapid increase in the incidence of testicular cancer over the past 40 years suggests that critical changes in environmental factors may contribute to the development of these tumors. Opinion is divided between those who propose that testicular germ cell cancers represent a single disease with variable morphologic phenotypes (the so-called lumpers) and those who consider these morphologies to be separate diseases, with shared etiologic and clinical features (the so-called splitters). For example, from a developmental biology perspective it has been recently proposed “that the various types of germ cell cancers are in fact one disease, reflecting the developmental potential of germ cells in different stages of maturation.” In addition, based on incidence time trend analyses among men aged 15 to 54 years, it has been recently hypothesized that “similar temporal patterns in the cohort dimension imply that the etiologies of seminoma and non-seminoma are largely similar if not identical.” In contrast, incidence time trend analyses in Canada, and other epidemiologic features, suggest that seminoma and nonseminoma have different etiologies. In a recent review of international trends in the incidence of testicular cancer, Chia and colleagues concluded that “differences between seminoma and nonseminoma remain evident and suggest that some of the unknown causative factors of testicular cancer may partially or exclusively affect risk of a single histologic group.”
Descriptive epidemiologic features, such as incidence age patterns and incidence time trends for testicular cancer, have provided several hints that the etiology of seminoma and nonseminoma may differ. First, age-specific incidence analyses have revealed that, among children aged 0 to 14 years, nonseminoma are virtually the only type of testicular germ cell cancer. Thus, the etiologies of seminoma and nonseminoma must be different for young boys, otherwise nonseminoma germ cell cancers would not be predominant among young boys. In addition, the incidence rate of testicular cancer among boys aged 0 to 14 years has remained constant over time, whereas incidence rates among adolescents and young men have increased indicating that the etiology of testicular cancer among boys and young men differs. Furthermore, additional descriptive epidemiologic features that do not support the hypothesis of identical etiologies of germ cell cancers have been published recently.
Here, we postulated that analytical epidemiologic studies, such as case-control and cohort studies, may provide evidence that the risk of germ cell cancers of the testis differs by histologic group. The aim of this study was to summarize the available evidence on etiologic differences among seminoma and nonseminoma based on a systematic review of published case-control and cohort studies, which present separate measures of effects for seminoma and nonseminoma.
Material and methods
To identify epidemiologic studies that report separate measures of effects for the association between exposure (environmental or genetic) and the risk of testicular cancer, one of us (AS) used a detailed Medline search on September 29, 2010 and included all available calendar years. A professional librarian confirmed the appropriateness of the search algorithm. We restricted our literature search to case-control and cohort studies published in the English language. To increase the recall of our search, we included several similar medical subject headings. To increase the precision of the search, we also included several restrictions, such as “cancer (sb)” and restriction to relevant publication types. We refined our search algorithm after comparison of the output with a priori known relevant case-control and cohort studies ( Fig. 1 ).

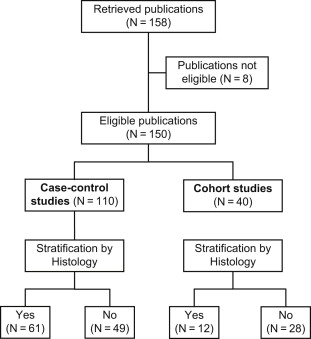
After downloading all 158 references retrieved by the search algorithm, one of us (AS) read all 158 full articles and checked if the study results were based on case-control or cohort studies. We did not contact the authors of the manuscripts. A list of all retrieved publications is available upon request. We excluded the following 8 publications from this study based on the following criteria: 2 studies were narrative reviews or meta-analyses, 1 study was an ecological analysis, 1 study was a re-analysis of previously published case-control study data, 2 studies were case-only analyses, 1 study was a prevalence study, and 1 study analyzed the association between date of birth and testicular cancer. The remaining 150 publications included 110 case-control and 40 cohort studies. One of us (AS) checked whether these publications reported measures of effects by histologic subgroup. Overall, 61 case-control studies and 12 cohort studies reported histology-specific results ( Fig. 2 ).
For each reference, we documented the study size (number of cases and controls, cohort size, and number of events), the age range of testicular cancer cases studied, the classification scheme used for germ cell cancers, and details about the exposures of interest. In addition, for each study, we extracted published relative risk (RR) estimates and their estimated 95% confidence intervals (CI) for seminoma and nonseminoma to the exposures of interest. We grouped exposures according to the following categories: (1) predisposing diseases, serologic findings, hormonal concentrations (index persons); (2) factors related to puberty, sex hormones, and fertility-related factors (index persons); (3) anthropometric measures (index persons); (4) lifestyle factors (index persons); (5) socioeconomic status and profession (both parents and index persons); (6) pregnancy-related factors (mothers and index persons); (7) genetic factors (index persons); and (8) family history.
If several effect estimates for the same exposure with different degrees of adjustment were presented, we chose the most thoroughly adjusted RR estimates. If investigators distinguished between subtypes of nonseminoma, we used inverse-variance weighting to produce a single effect estimate for nonseminoma. When studies separately reported RR estimates for nonseminoma and for mixed germ cell cancers, we chose only the RR estimates for nonseminoma.
To quantify the etiologic heterogeneity of seminoma and nonseminoma, we calculated the ratio of RR estimates (RoRR). For example, estimated RRs for seminoma and nonseminoma associated with a history of cryptorchidism was 4.21 (95% CI: 2.48–7.14) and 3.55 (95% CI: 1.74–7.21), respectively, in a recent case-control study. The ratio of RR estimates (seminoma/nonseminoma) thus equals 4.21/3.55 = 1.19. To estimate the 95% confidence interval for this ratio we estimated the variance (Var) of the difference between the βs (natural logarithms of the effect estimates) with S indicating seminoma and N indicating nonseminoma:
Var(β S -β N ) = Var(β S ) + Var(β N ) – 2 Cov(β S ,β N ) ( see page 184) and set the covariance Cov(β S ,β N ) arbitrarily to zero, because this information cannot be extracted from the published reports included in this study. After calculation of the confidence interval for the difference between βs, we retranslated this confidence interval to the linear scale. We assumed that confidence intervals for the RR estimates in the published reports were based on Wald confidence intervals. RR estimates related to age were sometimes presented using a 1-year or 5-year increment. We recalculated these RR estimates to include 10-year increments.
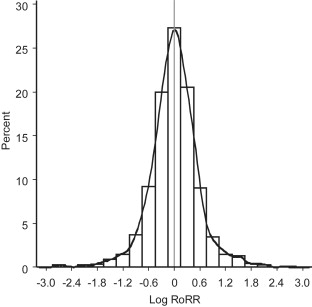
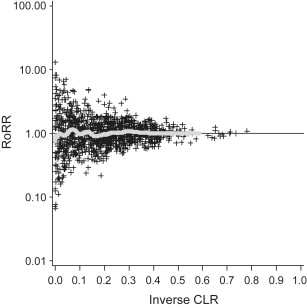
To study the distribution of RoRRs, we produced histograms, with Log(RoRR) on the x-axis and the relative frequency on the y-axis. In addition, we superimposed a kernel density estimate on the histograms through the use of a normal kernel function. The bandwidth of the kernel was estimated from the data. To investigate any pattern between the magnitude of the estimated RoRRs and the estimated precisions, we produced funnel plots with RoRR values on the y-axis and the estimated RoRR precision (the inverse of the 95% confidence limit ratio) on the x-axis. To better visualize the relationship between RoRRs and their estimated precisions, we fitted a parametric spline smoother and added it to the figures.
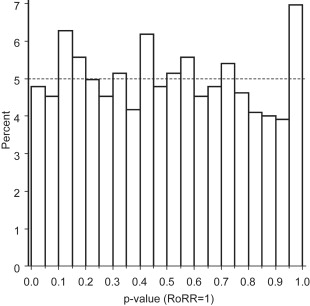
For each RoRR, we calculated a p-value. If the null hypothesis that no heterogeneity exists between histology-specific RR estimates is true, one would expect a uniform p-value distribution. If the null hypothesis is not true, one would expect a larger proportion of low p-values and a smaller proportion of high p-values. We plotted p-value distributions and funnel plots for all 1148 RoRRs and for separate groups of exposures.
Results
Overall, 61 and 12 publications of case-control studies and cohort studies respectively, stratified RR estimates by histologic group. Unfortunately, not a single study enabled us to compare RR estimates of seminoma and nonseminoma among newborns and infants, or among elderly men separately. The median number of patients with testicular cancer (ie, for case-control studies the number of cases and for cohort studies the number of events) included was larger in publications that stratified by histology compared with those that did not ( Table 1 ). Overall, 36% of all case-control studies and 58% of all cohort studies that provided histology-specific RR estimates were based on less than or equal to 200 patients with testicular germ cell cancer (either as cases in case-control studies or as events in cohort studies). Year of publication was positively associated with stratification by histologic subgroup (<1995: 18%; 1996–2000: 53%; 2001–2005: 45%; 2006–2010: 68%) and adjustment for study size did not alter this time trend.
| Reporting of Separate RR Estimates for Seminoma and Nonseminoma | ||
|---|---|---|
| No | Yes | |
| Case-control studies | ||
| Number of studies | 49 | 61 |
| Median number of case | 243 | 289 |
| Minimum-maximum | 10–8498 | 58–6415 |
| P25-P75 | 129–418 | 163–158 |
| Cohort studies | ||
| Number of studies | 28 | 12 |
| Median number of events | 28 | 123 |
| Minimum-maximum | 2–5441 | 6–7035 |
| P25-P75 | 7.5–283.0 | 29.0–2390.5 |
We extracted a total of 1148 RR estimates (including RR estimates from disjoint indicator variables) from the 73 publications with histology-specific RR estimates, stratified by histologic subgroups, reflecting 631 exposures. Overall 30.9% of these 631 stratified analyses were related to lifestyle factors followed by pregnancy-related factors (20.9%), family history (12.7%), genetic factors (10.8%), and others ( Table 2 ).
| Exposures | N | % |
|---|---|---|
| Predisposing diseases, serologic findings, hormonal concentrations | 44 | 7.0 |
| CMV IgG positivity, VCA Ig positivity, EA-R/d IgG positivity ; IgG EBV, IgG CMV ; history of mumps, history of measles ; insulinlike growth factor, insulinlike growth factor binding protein ; HIV positivity ; history of STD ; parvovirus B19 positivity ; abnormal semen characteristics ; low sperm count ; undescended testis ; congenital defects ; atrophic testis ; inguinal hernia ; testis/groin injury ; Down syndrome | ||
| Puberty, sex hormone, and fertility-related factors | 93 | 7.8 |
| Age at first nocturnal emissions ; age when voice broke ; age when started to shave ; ever impregnated woman ; ever fathered child, number of children, relative fertility ; several sex hormone active chemicals ; pesticide use for gardening | ||
| Anthropometric measures (index persons) | 9 | 1.4 |
| BMI, height, weight | ||
| Lifestyle factors | 195 | 30.9 |
| Physical activity ; smoking, passive smoking, marijuana use ; dietary/nutritional factors ; immigration ; mobile phone use ; Vietnam military service ; urban/rural residence ; electric blanket use | ||
| Socioeconomic status, profession | 54 | 8.6 |
| Profession, job ; socioeconomic status ; years at school ; occupational exposure to magnetic fields ; occupational physical activity ; night work | ||
| Pregnancy-related factors | 132 | 20.9 |
| Maternal BMI before pregnancy ; history of previous fetal death ; previous miscarriages ; maternal health before pregnancy ; maternal age ; paternal age ; maternal parity ; placenta weight ; retained placenta ; bleeding/threatened miscarriages ; maternal smoking during pregnancy ; weight gain during pregnancy ; severe nausea during pregnancy ; hyperemesis gravidarum ; preeclampsia ; bleeding during pregnancy ; gestational hypertension ; proteinuria, anemia, glucosuria during pregnancy ; hormone use during pregnancy ; DHEAS level, androstenedione level during pregnancy; any abnormality during pregnancy ; gestational age ; gestational duration ; birth date (compared with expected date) ; signs of prematurity ; dimension for gestational age ; presentation/delivery (breech, cesarean, head first) ; birth order ; born as twin ; singleton versus multiple births ; sibship size ; interval from son’s birth to the previous delivery of the mother ; birth weight ; birth length ; neonatal jaundice | ||
| Genetic factors (index persons) | 68 | 10.8 |
| SNPs of 8q24 ; KITLG 12q22 ; SPRY4 5q31.3 ; SNPs in 6 genes (INHA, INHBA, INHBB, INHBC, INHBE, SMAD4) ; SNPs in 16 immune function genes ; SNPs in hormone-metabolizing genes ; several SNPs on chromosomes 1, 4, 5, 6, 12 ; phenotype and genotype of glutathione S-transferase μ | ||
| Family history | 80 | 12.7 |
| Family history of several cancers, ethnicity of parents | ||
| Total | 631 | 100 |
Ratios of RR estimates were symmetrically distributed with a peak at the reference value (RR = 1 or log[RR] = 0) ( Fig. 3 ). The funnel plot indicates that the RoRR depends on the estimated precision; studies that provided more precise RoRR values tended to produce RoRR estimates closer to the null value (RoRR = 1) than studies with less precise RoRR estimates. The symmetry of the funnel plot suggests a lack of publication bias ( Fig. 4 ). The corresponding p-value distribution is close to the expected distribution under the null hypothesis of no histologic heterogeneity of RR estimates ( Fig. 5 ). Our sensitivity analyses according to predefined exposure groups revealed the same null results as our main analysis (data not shown).
Results
Overall, 61 and 12 publications of case-control studies and cohort studies respectively, stratified RR estimates by histologic group. Unfortunately, not a single study enabled us to compare RR estimates of seminoma and nonseminoma among newborns and infants, or among elderly men separately. The median number of patients with testicular cancer (ie, for case-control studies the number of cases and for cohort studies the number of events) included was larger in publications that stratified by histology compared with those that did not ( Table 1 ). Overall, 36% of all case-control studies and 58% of all cohort studies that provided histology-specific RR estimates were based on less than or equal to 200 patients with testicular germ cell cancer (either as cases in case-control studies or as events in cohort studies). Year of publication was positively associated with stratification by histologic subgroup (<1995: 18%; 1996–2000: 53%; 2001–2005: 45%; 2006–2010: 68%) and adjustment for study size did not alter this time trend.
| Reporting of Separate RR Estimates for Seminoma and Nonseminoma | ||
|---|---|---|
| No | Yes | |
| Case-control studies | ||
| Number of studies | 49 | 61 |
| Median number of case | 243 | 289 |
| Minimum-maximum | 10–8498 | 58–6415 |
| P25-P75 | 129–418 | 163–158 |
| Cohort studies | ||
| Number of studies | 28 | 12 |
| Median number of events | 28 | 123 |
| Minimum-maximum | 2–5441 | 6–7035 |
| P25-P75 | 7.5–283.0 | 29.0–2390.5 |
Stay updated, free articles. Join our Telegram channel

Full access? Get Clinical Tree


