3 Epidemiology of Diabetic Neuropathy
Introduction
The epidemiology of a disease primarily describes the frequency with which it occurs, and determines the risk factors associated with it. The former informs the clinician about the likelihood that the patient in front of him or her has the condition and the public health authorities about the potential overall burden relating to the condition. The latter sheds light on etiological processes, although the associations described by epidemiological studies cannot alone be taken as proof of causality.
In order to understand the epidemiology of a disease properly, it is important to have well-validated diagnostic tests that can be used by a variety of investigators assessing different populations in a similar manner. Furthermore, it is important that the populations studied are representative of the total population being considered, and have not been subjected to significant selection biases. However, the study of the epidemiology of diabetic neuropathy has been beset by numerous problems relating both to diagnostic tests and to population selection.
 Testing for Peripheral Neuropathy
Diabetic peripheral neuropathy is a complex disorder in which the disease process may affect different sets of nerve fibers to different degrees in different individuals. Thus, one individual may have an abnormality of large-fiber sensory function, which could be detected by measuring the vibration perception threshold (VPT), whilst another may have a predominantly small-fiber neuropathy that can only be detected by measuring the thermal perception threshold (TPT). This feature of neuropathy can cause problems in the selection of a single test with which to screen a population. The issue of measurement of neurological function is further complicated by the nature of the tests. Many are psychophysical tests, in which the subject is required to interpret the nature of an external stimulus (usually applied to the foot). This subjectivity can lead to relatively poor reproducibility of tests such as VPT, in which the subject has to differentiate light touch from vibratory sensation.
This lack of certainty over the value of individual tests for the assessment of diabetic neuropathy has led to recommendations that several different tests should be performed, and that diabetic neuropathy should only be diagnosed when more than one is abnormal [1]. Whilst this may make the diagnostic process more rigorous in any individual or in an individual study, it can make comparisons between studies more difficult. Such recommendations have been only patchily adopted, and where they have been put into practice, the selection of tests has not been uniform. Thus, we are faced with having to compare the prevalence when neuropathy is determined by a single test with the prevalence when neuropathy is diagnosed when any two out of perhaps three to five tests are abnormal. Increasing the number of tests that are performed will automatically increase the number of individuals in whom an abnormality is found, while requiring that more than one abnormality is present will then tend to decrease the prevalence. The overall effect is thus complex. The impact of varying the diagnostic testing procedure can be seen in the Diabetes Control and Complications Trial (DCCT) data (Table 3.1), where the prevalence of distal symmetrical polyneuropathy (DSP) at baseline in the conventional therapy cohort varied from 0.3% (abnormalities of reflexes, sensory examination, and neuropathic symptoms) to 21.8 % (abnormal nerve conduction in at least two nerves) [2]. Confirmed clinical neuropathy (abnormal history or examination, confirmed by abnormal nerve conduction or autonomic function) was the gold standard for the study, and was found in 2.1% of this cohort. This 73-fold difference in the prevalence of DSP, between the two extremes, but within a single population, highlights the difficulties of comparing studies with differing diagnostic criteria.
The influence of test selection on the understanding of etiological factors associated with neuropathy is likely to be considerably smaller than that on prevalence. As long as each diagnostic process is indeed measuring some aspect (or aspects) of neuropathy, it is likely that those who are rated as having neuropathy are genuinely more severely affected than those who are not so rated. Thus, associations with factors such as age or glycemic control may be easier to compare across different studies than are prevalences, which are highly dependent not only on the test (or tests) selected, but also on the diagnostic threshold that is used. For example, the groups selected either by absent ankle reflexes or by elevated VPT are both likely to be older and have poorer glycemic control than the groups who are normal on these respective tests. However, unless loss of ankle reflexes represents the same degree of neuropathy as does an abnormal VPT (according to the threshold selected – see below), the prevalences generated from the same population by these two tests could be quite different.
Table 3.1 Prevalence of polyneuropathy within the DCCT conventional therapy primary prevention cohort, according to diagnostic test
Diagnostic criteriaa | Neuropathy prevalence (%) |
|---|---|
Sensory examination, reflexes, and symptoms | 0.3 |
Symptoms and reflexes | 0.5 |
Sensory examination and symptoms | 1.1 |
Symptoms or sensory examination, confirmed by abnormal nerve conduction or autonomic functionb | 2.1 |
Sensory examination and reflexes | 2.1 |
Abnormal autonomic function | 2.4 |
Symptoms alone | 3.7 |
Any two out of symptoms, sensory examination, reflexes | 4.5 |
Reflexes alone | 5.8 |
Sensory examination alone | 12.2 |
Nerve conduction (abnormal in at least 2 nerves) | 21.8 |
Data adapted from [2]
aAbnormalities required in the fields listed
bCold standard measure of neuropathy for the study
Even when the same test has been used, the methods and the selection of thresholds have not been uniform. VPT is widely used, but some studies use agerelated thresholds (based on UK normal data) [3], while others have ignored age and used a single cutoff [4]. More recently, locally derived normal ranges have been applied, although in one study these were derived separately for different age groups [5], while another compared all diabetic subjects to a young nondiabetic population [6].
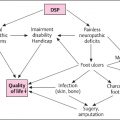
It is obvious from the discussion above that there is a long way to go in finding a definition of neuropathy that can be widely used, although it is clearly needed for accurate epidemiological study. This definition needs to be appropriate for the clinical forms that the disease may take (e.g., small fiber or large fiber involvement), related to hard endpoints, such as foot ulceration, agreed upon widely, and useful for a range of both clinical and research purposes. Multiple testing of different neurological functions, although recommended as the gold standard [1], can be difficult and expensive, especially in large field studies. Furthermore, recent data suggest complex patterns of sensation in DSP with decreased VPT (hypoesthesia) and heat stimulus-induced hyperesthesia (low thresholds), both being characteristic of mild DSP as they correlate with neuropathic symptoms and deficits, whereas panmodality hypoesthesia is typical of severe DSP [7]. The only studies that relate measures of neurological function (in a prospective manner) with subsequent foot ulceration and amputation have used simple quantitative sensory tests, such as VPT or monofilament sensitivity [8,9].
 Population Selection
The second important obstacle in determining the prevalence of neuropathy is the selection of people who are going to be tested. Hospital clinic-based studies will usually be biased towards those with more serious problems, and are likely to overestimate the prevalence of neuropathy in the general diabetic population. Nevertheless, the value of hospital-based prevalence studies should not be underestimated. Whilst they do not directly address the issue of what the general risk of having neuropathy is in a person with diabetes, they precisely answer the question of how common neuropathy is amongst hospital clinic patients. This in itself may be a very important and valuable issue. The problem, however, is that one hospital-based population may not be the same as another – an issue that can be partially overcome with multicenter studies [10]. Another problem is that temporal trends in referral patterns from primary care can make today’s hospital population quite different to tomorrow’s.
Studies using registers of people with diabetes that are derived from primary care will overcome the hospital-based biases, and not surprisingly have reported lower prevalences [11]. However, this selection methodology remains dependent on the proportion of people with diabetes who are actually diagnosed. Since approximately 50% of all of those with diabetes are undiagnosed [12], this method also has flaws. Population-based epidemiological surveys, in which a high proportion of a representative sample of the general population is directly tested for diabetes (by blood glucose testing), and then those found to have diabetes (previously diagnosed and newly diagnosed) are screened for neuropathy, represent an alternative approach. This should be a more reliable and reproducible way of determining the prevalence of diabetic neuropathy, but only two such studies have been reported [5,6].
One drawback of this approach is that the group with “newly diagnosed” diabetes (i.e., diagnosed as part of the study by blood glucose testing) is usually identified by an abnormal glucose value measured on a single day. Since the diagnosis of diabetes requires verification of this on another day [13], it is likely that the group identified includes a number of individuals who would have a nondiabetic glucose value on repeat testing, and therefore do not actually have diabetes. Assuming that these people do not have neuropathy (since they do not have diabetes), their inclusion would dilute the sample and lead to an underestimate of the prevalence of neuropathy in the newly diagnosed group. Nevertheless, neuropathy prevalence estimates derived from population-based samples that include all of those people who have diabetes (both diagnosed and undiagnosed) should be the most accurate and reproducible approach.
How Common Is Diabetic Neuropathy?
 Distal Symmetrical Polyneuropathy
Prevalence in Diabetes
Taking into account the issues discussed above, it is difficult to determine with any precision the prevalence of diabetic neuropathy. Several large studies have examined the prevalence in hospital-based populations. A number of these are in fairly close agreement, and reveal prevalences of DSP at approximately 30%, amongst both European and African populations [8,14–16]. However, other hospital-based studies have produced figures closer to 20% [3], and a prevalence of 50 % was reported from a US veterans population [17].The higher figure in this last study may relate to the age of the participants, and to the fact that they were almost all male.
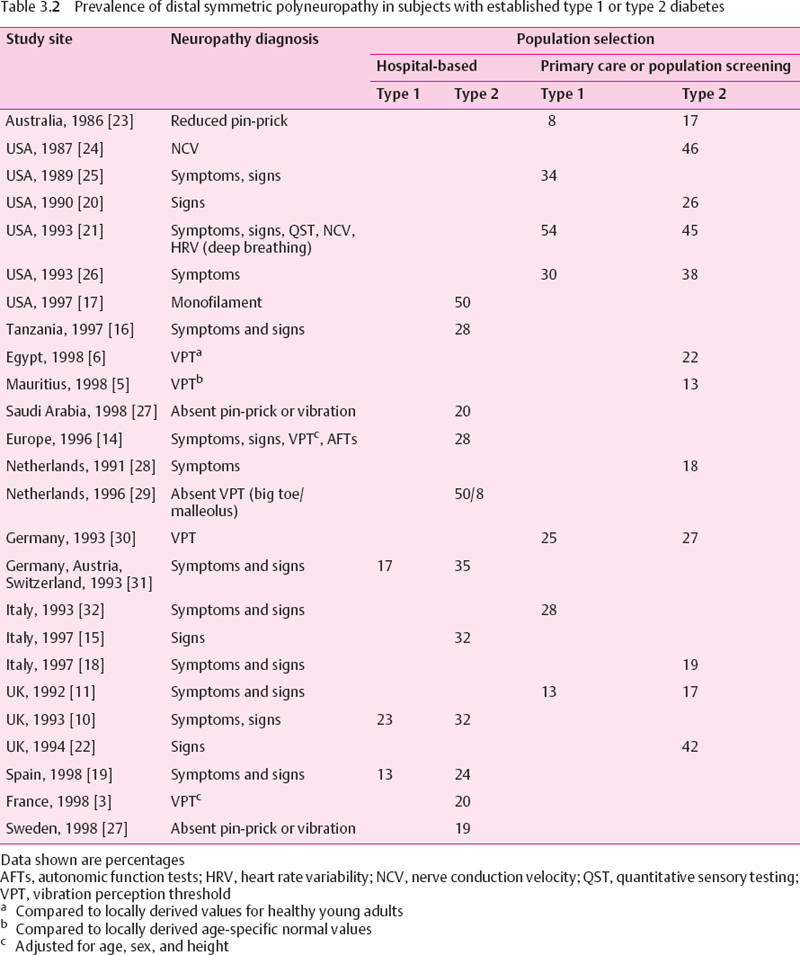
Studies which have used primary care registers of people with diabetes, or which report the prevalence in people with previously diagnosed diabetes derived from population-based surveys, have mainly reported lower prevalences than those given in hospital-based studies. Some studies report prevalences of around 20% [6,11,18–20], although a figure as high as 54% in type 1 and 45% in type 2 diabetic patients was reported from a population based sample from Rochester [21], and 42% of a sample of 811 type 2 diabetic subjects drawn from 37 UK general practices were found to be neuropathic [22]. The Rochester study used electrophysiology as part of the neurological assessment. This is frequently abnormal in diabetes, even within a short time of diagnosis of type 1 diabetes, and has not been validated as a predictor of foot ulceration. The prevalence rates of DSP in type 1 and type 2 diabetic patients are summarized in Table 3.2.
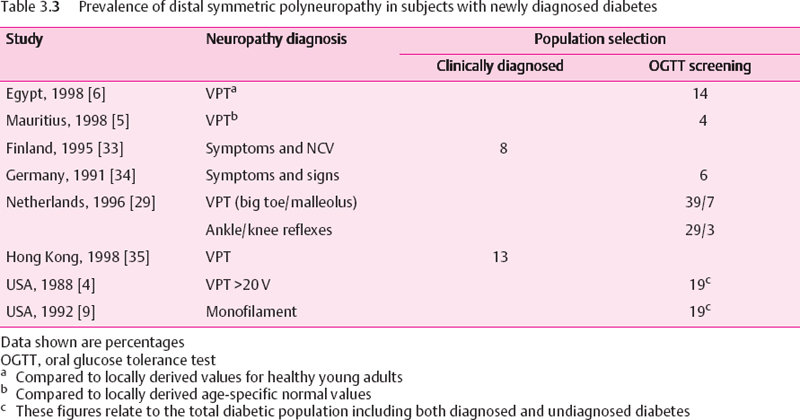
When general populations are screened by glucose tolerance testing, and those identified as having diabetes are assessed for peripheral neuropathy, the prevalence has been relatively low (Table 3.3), In our own study from the Indian Ocean island of Mauritius (in which 70% of the population originates from India) the data showed the lowest prevalence of DSP yet reported [5]. The overall prevalence in the total diabetic population was 8.3%, i.e., 12.7% in subjects with known diabetes and just 3.6% among those with newly diagnosed diabetes. Consistent with the low neuropathy prevalence was a low prevalence of lower limb amputation – a finding that has been reported elsewhere for people who originate from the Indian subcontinent [36]. Neuropathy was based on VPT measurements, using locally derived age specific normal ranges. In the only similar study, from Egypt [6], 14% of the newly diagnosed diabetic population were found to have DSP. However, the reference range used for VPT in that study related to healthy adults under the age of 45, and therefore probably did not account for the normal age related rise in VPT. Thus, since the majority of those with diabetes were over the age of 45, the neuropathy prevalence in that study may be an overestimate. In two Native American populations, which are regularly screened for diabetes with glucose tolerance testing, the prevalence of DSP in the whole diabetic population was 19% [4,9].
The prevalence of diabetic neuropathy in general populations was evaluated in two door-to-door surveys that were restricted to a questionnaire which represents the most crude and simple screening instrument [37,38]. However, since no screening for diabetes had been performed, the exact prevalence of diabetes in these populations was unknown.
It can be seen from Tables 3.b and 3.3 that diagnostic methodology is far from uniform. Indeed, there are hardly any two studies that have used identical methods. Nevertheless, a pattern can be discerned in these studies. The prevalence in hospital-based populations is probably around 30%, falling to about 20% when people with established diabetes are selected from a community base. Amongst the complete diabetic population, including both diagnosed and undiagnosed diabetes, the prevalence of DSP is probably less than 20%.
Prevalence in Impaired Glucose Tolerance
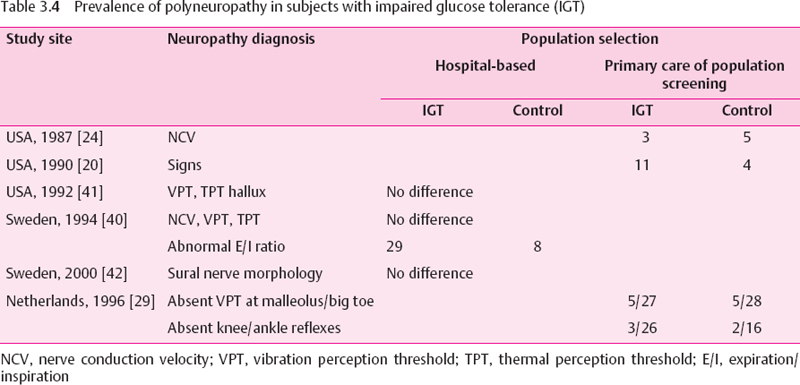
Although the development of diabetic polyneuropathy is typically insidious over several years, it may occasionally be the presenting feature in type 2 diabetic patients [39]. It is not known whether this “early” nerve alteration has developed during a period of unrecognized diabetes or evolves gradually during a state of impaired glucose tolerance (IGT) prior to the transition to overt diabetes. In this context, it is unclear whether there is a glycemic threshold beyond which nerve dysfunction develops. If IGT constitutes such a threshold which needs to be passed, subjects with IGT should not have a degree of neuropathy higher than that of nondiabetic subjects [40] The results of several studies comparing the prevalence of nerve dysfunction in patientswith IGT and normal glucose tolerance (NGT) are summarized in Table 3.4. The hospital-based studies could not demonstrate a difference in peripheral nerve function and structure between patients with IGT and NGT, except for an abnormal expiration/inhalation ratio, a marker of cardiovascular autonomic neuropathy (CAN), which was found to be more frequent in IGT than in NGT [40]. In one population-based study ankle reflexes were detected less frequently in patients with IGT than in those with NGT [29]. Thus, there is preliminary evidence suggesting that peripheral neuropathy may be slightly more frequent in IGT than in NGT, but further studies are needed to confirm these findings.
Incidence and Natural History
Most of the data describing the frequency of diabetic neuropathy relate to prevalence. The long-term natural history and progression of diabetic neuropathy has been difficult to study owing to the following problems: (1) various nerve fiber populations may be affected at different rates, (2) expected changes may take place over several years. (3) minor changes may not be detected due to a low reproducibility of some methods, (4) measures of nerve function such as nerve conduction velocity (NCV) may deteriorate with age in nondiabetic subjects, and (5) glycemic control or risk factor profile may change and nerve dysfunction may be reversible over time. It has been emphasized that inception cohorts followed from the diagnosis onward are needed to determine the impact of diabetic neuropathy, because prevalence rates consider only the surviving cases and therefore might underestimate the true risk of acquiring the disease [43].
A long-term clinic-based study carried out in a large group of type 1 and type 2 diabetic patients, designed to investigate the relationship between the duration and degree of hyperglycemia and the prevalence of clinically overt neuropathy from the onset of diabetes, was performed by Pirart [44] over a period of 25 years. He defined neuropathy as a loss of Achilles and/or patellar reflexes combined with a reduced vibration sensation or presence of “a more dramatic polyneuropathy or monoor multi-neuropathy.” The prevalence of neuropathy increased from about 8% among the 1900 patients evaluated at the time of diagnosis to about 50% among 100 patients reassessed after a follow-up of 25 years. The incidence of neuropathy increased from three cases per 100 unaffected patients per year to about 19 cases per 100 patients after 25 years. However, Pirart’s study had several drawbacks: it was not population-based, no standardized diagnostic measures were employed, the various forms of neuropathy were not differentiated, control subjects were not assessed, and the types of diabetes were not evaluated separately.
In a study focusing on 133 Finnish patients with newly diagnosed (following clinical presentation) type 2 diabetes, the10-year incidence of DSP among those who were free of neuropathy at baseline was 17-20% depending on whether electrophysiological or clinical parameters were used [33]. This gives an annual incidence of approximately 2%. However, the development of DSP and CAN was divergent in that approximately the same proportions of patients with and without peripheral neuropathy developed CAN, either with predominant parasympathetic or sympathetic involvement or both [45]. To explain this finding different underlying mechanisms involved in the evolution of peripheral neuropathy and CAN have been suggested: while hypoinsulinemia predicted the development of DSP, it was hyperinsulinemia that predicted the development of CAN [45].
Over the first 12 years of the UK Prospective Diabetes Study (UKPDS), which similarly studied people newly presenting with type 2 diabetes, neuropathy (as judged by a VPT >25 V) developed in approximately 20% of subjects irrespective of treatment arm, giving an annual incidence of just under 2% [46]. In the American San Luis Valley study [47], DSP was determined by a combination of symptoms and clinical signs. Over nearly five years, its average annual incidence was 6.1 % (6.1 per 100 person-years). A study of US veterans reported neuropathy (monofilament insensitivity) developing in 20% of subjects over approximately 2.5 years [17]. The higher incidence in the last two studies was probably due to the fact they only included people with established diabetes, who, consequent on their longer disease duration, would have had a higher baseline risk than the subjects with newly diagnosed diabetes who were included in the other two studies.
In the Rochester Diabetic Neuropathy Study (RDNS), after two years the Neuropathy Impairment Score (NIS) was unchanged in 81%, worse in 10%, and better in 9% of the patients and the Neuropathy Symptom Score (NSS) was unchanged in 92% and worse or better in 4% of the patients, respectively. The most prominent monotone (consistent) worsening over two years was found for a composite score combining neuropathic deficits and quantitative measures of DSP (NIS[lower limbs] + 7 tests), which worsened on average by 0.34 points per year in the entire cohort and by 0.85 points per year in patients with DSP [48].
The Epidemiology of Diabetes Complications Study (EDCS) reported on a six-year follow-up of 453 type 1 diabetic patients who were free of DSP at baseline. 15% of whom developed DSP in six years, giving an incidence of 2.8 per 100 person-years and a cumulative probability of 0.29 [49], DSP was defined as the presence of two or more of the following: symptoms, sensory and/or motor signs, and/or absent (or present only with reinforcement) tendon reflexes. In the DCCT, which included groups of highly selected individuals with type 1 diabetes, polyneuropathy (abnormal history or examination, confirmed by abnormal nerve conduction or autonomic function) developed in 9.6% of those who were conventionally treated, and in 2.8% of those in the intensively treated group, over five years [2].
Comparing to the data for type 2 diabetes, it appears that the incidence of neuropathy in type 1 diabetes (using the data from the conventionally treated group – approximately 2% per year) is similar to that in newly diagnosed type 2 diabetes, but less than that in previously diagnosed type 2 diabetes. However, age is an important factor in diabetic neuropathy (see below), and the considerably younger age of the subjects in the DCCT probably accounts for the differences seen. Indeed, when age has been corrected for, the prevalence of neuropathy does not differ between type 1 and type 2 diabetes [8,11].
In the EURODIAB Prospective Complications Study, which included 986 type 1 diabetic subjects without DSP at baseline, the cumulative prevalence after an average follow-up of 7.3 years was 25% [50].
Several clinic-based prospective studies examined the relationship between the natural history of abnormalities in nerve function tests and the degree of longterm glycemic control. Hillson et al [51], followed 71 patients who showed a slight deterioration in mean pedal VPT during the first five years after diagnosis of type 2 diabetes, which correlated significantly with increased mean fasting blood glucose. A more pronounced deterioration in sensory nerve function as assessed by thermal, vibration, and pressure perception thresholds has been observed over 1-3.5 years and two years in newly diagnosed and longer-term type 2 diabetic patients, respectively [35,52]. There was a correlation between the changes in the various sensory thresholds. [52], suggesting that small and large nerve fiber dysfunction may develop in parallel in type 2 diabetic patients.
Young et al. [53,54] studied 75 type 1 diabetic patients aged 16-19 years over an average of 2.4 years, 70 of whom were reassessed again after six years. During the first study period the deterioration in motor and sensory NCV was associated with poor glycemic control, but no patient had symptoms and only seven had minor signs, of neuropathy [53]. After six years 16 patients had Symptoms, 12 had “major signs,” 15 had “minor signs”, and 27 showed no symptoms of neuropathy. Baseline HbA1 was significantly higher in patients who developed symptoms or major signs compared win hi those showing minor signs or no symptoms. In addition, peroneal motor NCV (MNCV) deteriorated if the symptomatic but not in the asymptomatic group [54]. On the other hand, it has been demonstrated that neuropathic pain may improve and resolve completely within three to four years of follow-up despite persistent poor glycemic control, but thermal perception thresholds continue to deteriorate [55]. Thus, small-fiber function tests do not seem to predict the evolution of painful symptoms.
Regarding the magnitude of changes in the quantitative measures of DSP, we have shown that over the first decade of type 1 diabetes the mean difference between poorly controlled and well-controlled patients in the annual rate of slowing of peroneal MNCV is 0.6 m/s per year and that of sural sensory NCV (SNCV) is 0.7 m/s per year. After 12 years from the diagnosis of type 1 diabetes, none of the well-controlled patients but 60% of those with long-term poor control developed polyneuropathy [56]. Macleod et al. [57] estimated the annual rate of change for the VPT on the great toe to be 0.4 V in healthy subjects and 2.5 V in those with diabetic neuropathy.
In a mixed cohort of type 1 and type 2 diabetic subjects followed over 9-16 years (mean 10 years) peroneal MNCV was: Progressively reduced with increasing duration of diabetes, but it stabilized once it reached a “plateau” between 36 and 38 m/s [58].
 Focal and Multifocal Neuropathies
Prevalence
In the Rochester Diabetic Neuropathy Study the prevalence of neuropathies other than DSP was low: symptomatic carpal tunnel syndrome in 9% of type 1 and 4% of type2 patients, proximal asymmetric neuropathy in 1% each (of type 1 and type 2 patients, ulnar neuropathy in 2% each of type 1 and type 2 patients, peroneal neuropathy in one type 2 patient, lateral femoral cutaneous neuropathy of the thigh (meralgia paresthetica) in 1% each of type 1 and type 2 patients. Cranial neuropathy or truncal neuropathy was not present in any of the patients at the time of examination. Approximately 10% of diabetic patients had neurological deficits attributable to nondiabetic causes [21].
In a Japanese survey among 1961 diabetic patients, 19(1%) had cranial nerve palsies: 19 facial nerve, 6 oculomotor nerve, and 2 abducent nerve palsies. Among 3841 nondiabetic subjects only 5 (0.1%) showed cranial nerve palsies, all of which were facial palsies. Only 1 out of 9 patients with facial palsy compared to 7 out of 10 patients with ophthalmoplegia had diabetic complications, suggesting that ophthalmoplegia rather than facial palsy is related to diabetes [59].
Natural History
Proximal motor neuropathy (femoral neuropathy, diabetic amyotrophy) is characterized by pain with or without wasting in one thigh, or, more often, both thighs. It develops over several weeks, and recovery is the rule. The worst pain resolves within 6-12 months, while the remaining discomfort disappears within three years. Function recovers completely, although slight wasting may persist [39].
The onset of cranial nerve palsies is abrupt and oculomotor nerve involvement may be accompanied by supraorbital pain. Cranial nerve palsies resolve completely in three to six months, and relapses are infrequent [39].
Diabetic polyradiculopathy most commonly affects the trunk, where it causes unilateral or bilateral truncal pain and abdominal muscle bulging. It may be accompanied by profound weight loss. Spontaneous recovery within 4-30 months is the rule, but relapses may occur [60].
For the natural history of painful neuropathies see Chapter 5, page 212–213.
 Cardiovascular Autonomic Neuropathy
Prevalence
Although the impact of autonomic neuropathy is increasingly being recognized, little information exists as to its incidence in representative diabetic populations. The difficulties encountered in epidemiological studies of diabetic neuropathy particularly affect the evaluation of autonomic dysfunction, which involves an even greater variety of nonspecific clinical manifestations that can be explored by numerous diagnostic approaches. Of the manifestations of diabetic autonomic neuropathy, cardiovascular autonomic neuropathy (CAN) has attracted most attention, because it is easily detected at subclinical stages by noninvasive cardiovascular autonomic function tests (AFTs) based on heart rate variability (HRV) and blood pressure responses, before the late sequelae such as resting tachy-cardia or orthostatic hypotension develop.
To date there have been two population-based studies that assessed the prevalence of autonomic dysfunction in diabetic patients. The Oxford Community Diabetes Study [61] included 29 873 adults aged at least 20 years. 412 of whom were known diabetic patients. Autonomic function was assessed in 43 type 1 and 202 type 2 diabetic patients using the standard deviation of HRV at rest, expiration/inhalation (E/l) ratio from a single deep breath, and Valsalva ratio. The overall prevalence of abnormal results in one or more of the three tests was 20.9% in type 1 patients and 15.8% in type 2 patients. Since this study did not include control subjects, the reported prevalence of autonomic dysfunction is difficult to interpret. The definition of one abnormality (<2.5th percentile of normal range) among three tests might yield one abnormal test result in up to 7.5% of a control population. Hence, the specificity of the test battery and the prevalence of CAN in that study were relatively low.
In the Pittsburgh Epidemiology of Diabetes Complications Study [62] autonomic neuropathy was evaluated in 168 type 1 diabetic subjects aged 25-34 years, representing 71% of those who were eligible. Cardiovascular autonomic function tests included the E/l ratio and mean circular resultant (MCR) to deep breathing. 30:15 ratio to standing, and Valsalva ratio. The results of the E/I ratio and MCR were significantly associated with the hypertension status, LDL and HDL cholesterol, and gender. The prevalence of autonomic symptoms, ranging from 0 to 8%, was relatively low except for hypoglycemia unawareness, which was present in 26% of the patients. However, this study neither reported the prevalence of abnormal test results nor did it take into account treatment with drugs that potentially influence autonomic function. Orthostatic hypotension, defined as a systolic blood pressure fall of at least 30 mmHg, was noted in 3.4% of the patients.
In a clinic-based multicenter study (DiaCAN) we have found prevalence rates of borderline CAN (2 out of 7 indices abnormal) or definite CAN (>3 out of 7 indices abnormal) of 8.5% and 16.8% respectively among 647 unselected type 1 diabetic patients, and 12.2% and 22.1% respectively in 524 type 2 diabetic patients [31]. The percentage of type 1 diabetic patients with definite CAN was identical with the 16.6% rate observed in 506 patients randomly selected from four hospital diabetic clinics in Bristol [63]. In that study CAN was diagnosed by HRV responses during rest and in response to a single deep breath. Valsalva maneuver, and standing, and was defined by abnormal test results in at least two of these four tests. In the EURODIABIDDM Complications Study [64], among the total of 3250 patients studied. 19.3% (range among centers: 7.8-51.8%) had abnormal HRV and 5.9% (range: 0-14.5%) had postural hypotension. In a Japanese clinic-based cohort of 886 type 2 diabetic patients the prevalence of orthostatic hypotension was 7% [65].
Since particularly in type 2 diabetes the actual onset of the disease may often be preceded by a long period of unrecognized metabolic abnormality, it appears likely that neural dysfunction can be detected at the time of diagnosis of diabetes. Two studies have reported the frequency of neuropathy in type 2 diabetic patients who were examined within four weeks following the diagnosis of the disease. Lehtinen et al. [66] evaluated 132 patients aged 45-64 years in the district of Kuopio University Central Hospital and 142 controls randomly selected from the population registers. The rates of abnormal E/l ratio were 6.3% and 1.4%, respectively. A similar study was performed by Ratzmann et al. [34] in 95 newly diagnosed type2 diabetic patients who were representative of the East Berlin community. The prevalence of abnormal maximum/minimum heart rate during deep breathing was 7.3%.
In a clinic-based study we determined the prevalence of CAN in 120 healthy subjects and 130 newly diagnosed type 1 diabetic patients within 3-49 days after the initiation of insulin treatment with stable mean blood glucose levels. The prevalence of CAN defined by the strict criterion of at least three abnormal tests out of six was 7.7% in the patients and 0 in the controls. Two abnormal tests out of six were found in an additional 9.2% of the patients but in only 1.7% of the controls [67].
Thus, CAN cannot be generally regarded as a late complication of diabetes, but it should be borne in mind that subclinical cardiovascular autonomic dysfunction may be detected even in newly diagnosed type 1 diabetic patients if sensitive indices of spectral analysis are applied in conjunction with tests based on standard analysis of HRV.
Incidence an d Natural History
Only a few studies have evaluated the natural history of CAN in inception cohorts. Töyry et al. [68] followed 133 newly diagnosed type 2 diabetic patients and 144 control subjects over 10 years in Kuopio, Finland. CAN was assessed by the E/l ratio as an index of parasympathetic activity and the systolic blood pressure drop on standing as a measure of sympathetic activity. The prevalence of “parasympathetic neuropathy” rose from 5% in diabetic patients vs 2% in controls at baseline to 65% vs 28% after 10 years, while the prevalence of “sympathetic neuropathy” increased from 7% vs 6% at five years to 24% vs 9% after 10 years. Poor glycemic control and high insulin levels were significant predictors of the development of CAN [68]. Moreover, the presence of CAN at five years was an independent risk factor for the development of stroke after 10 years [69]. Clinic-based studies in patients with variable duration of type 2 diabetes showed a gradual increase in the prevalence of AFT score abnormalities from 41% at baseline to 64% after four years [70], and worsening of the AFT score in 57% of the patients after five years of follow-up [71].
There are no population-based studies including inception cohorts at the time of diagnosis of type 1 diabetes. In a clinic-based study we have shown that the natural evolution of abnormal HRV during the first five years following diagnosis of type 1 diabetes is clearly related to the degree of glycemic control [72]. The rates of abnormalities in HRV at five years were 5% in well-controlled patients and 23% in those who were poorly controlled. In type 1 diabetic children the prevalence of abnormal HRV at rest increased from 27% at the time of diagnosis to 56% after 10 years, but abnormal HRV during deep breathing changed only from 12% to 14% [73].
In longer-term teenage type 1 diabetic patients Young et al. [53] found an increase in the rates of abnormal HRV from 19% to 28% within 20-35 months in poorly controlled type 1 diabetic teenagers. Sampson and colleagues [74] noted a relatively slow decline in HRV of about 1 beat/min per year, approximately three times faster than in healthy subjects [39], over a decade in patients with initially normal HRV. Postural hypotension was persistent, but did not deteriorate in the majority of patients. In contrast, a six-year study has reported the relatively rapid development of postural hypotension in a small group of long-term diabetic patients, which was preceded by a decrease in E/l ratio [75]. In two recent studies in type 1 diabetic patients, AFTs and autonomic symptoms and signs had not changed after 5 and 9 years, respectively [76,77]. In a prospective study over 10-11 years, CAN has been shown to predict future deterioration in glomerular filtration rate in type 1 diabetic patients. It has been hypothesized that nocturnal rise in intraglomerular pressure could be one possible link between CAN and the observed deterioration in glomerular filtration rate [78].
 Gastrointestinal Neuropathy
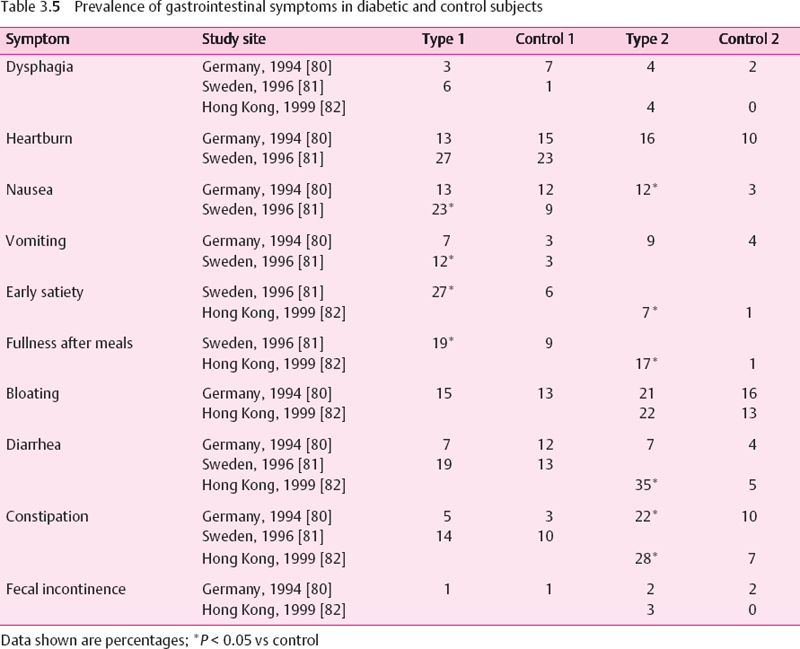
There are no population-based studies reporting the prevalence or incidence of gastrointestinal symptoms or motor abnormalities in diabetic patients. A number of clinic-based studies reported relatively high rates of delayed gastric emptying in diabetic subjects, but most of these included small samples of highly selected populations subject to referral bias. Thus, the true prevalence of delayed gastric emptying is not known. Using the 13C-octanoic acid breath test, delayed gastric emptying has been shown in 16% of type 1 diabetic subjects without gastrointestinal symptoms, while the rate increased to 43% in those with these symptoms [79]. Several clinic-based studies reported the prevalence of gastrointestinal symptoms in diabetic and nondiabetic subjects [80–82] (Table 3.5). In type 1 diabetic patients only nausea, vomiting, early satiety, and fullness after meals occurred significantly more frequently than in the nondiabetic subjects in some studies. In type 2 diabetic patients nausea, early satiety, fullness after meals, diarrhea, and constipation were significantly more frequent than in the nondiabetic subjects. The prevalence of gastrointestinal symptoms such as dysphagia, heartburn, or bloating was comparable to that seen in nondiabetic subjects. However, there were considerable differences between the studies regarding the prevalence of the individual symptoms. For example, diarrhea was observed in 35% of the type 2 patients studied in Hong Kong vs 7% of those studied in Germany [80–82].
The gallbladder may become atonic in association with autonomic neuropathy, which increases the gallbladder volume by retention of bile. It is unknown whether these changes result in symptoms. It may be that biliary stasis explains the increased risk of gallstones shown by recent epidemiological data. In a population-based study from Tivoli. Rome, the prevalence of diabetes in subjects affected by gallstone disease was significantly higher than in controls matched for sex, age, and body mass index (12% vs 5%) [83].
“Gustatory sweating” refers to sweating over the face and scalp (and sometimes upper trunk), often accompanied by a flush, that follows the ingestion of food or drink. Diabetic gustatory sweating has been reported in a clinic-based study to occur in 69% of patients with nephropathy, 36% with peripheral neuropathy, and 4% of those without either complication [84]. Diabetic gustatory sweating is believed to be triggered by the taste buds as it is not evoked by chewing inert substances, thinking of food, smelling food or by placing food or alcohol in the stomach by a gastric tube. The tongue is the most sensitive area, and even cocainization fails to inhibit gustatory sweating completely. The etiology of diabetic gustatory sweating is uncertain. The hypothesis that it results from aberrant regrowth of parasympathetic fibers leading to a connection between salivation centers and facial sweat glands seems to have been disproved by a series of case reports of immediate cessation of gustatory sweating after renal transplantation [84].
 Erectile Dysfunction
Prevalence
Male erectile dysfunction, defined as “the inability to achieve or maintain an erection sufficient for sexual intercourse” [85], is one of the most common sexual dysfunctions in men. Erectile dysfunction is more common with advancing age, and since the aged population is increasing, its prevalence will continue to rise [86]. Diabetes mellitus is the most frequent organic cause of erectile dysfunction. In the population-based Massachusetts Male Aging Study (MMAS), the age-adjusted prevalence of complete erectile dysfunction was 28% in men with treated diabetes. Minimal, moderate, and complete erectile dysfunction together had a prevalence of 64% in men with treated diabetes [87]. In a recent clinic-based survey in Italy involving 9868 men with diabetes, 45.5% of those aged over 59 years reported erectile dysfunction [88]. Table 3.6 shows that erectile dysfunction is encountered in 20-52% of type 1 and 36-54% of type 2 diabetic patients [61,87–93]. Once erectile dysfunction has developed, it is likely to persist in most patients. Risk factors and clinical correlates include duration of diabetes, glycemic control, each of the chronic diabetic complications, and smoking [88].
Related posts:

Stay updated, free articles. Join our Telegram channel

Full access? Get Clinical Tree


