1
Introduction
Diabetes and its complications have risen significantly (both prevalence and incidence rates) over the last 2 decades, making them a serious public health and economic burden globally [ ]. This is particularly concerning because a rise in diabetes prevalence will result in an increase in the number of chronic and acute diabetes complications, healthcare need, economic expenses, and affecting quality of life. Diabetes vascular complications are among the most serious manifestations of the disorder and have contributed immensely to the global burden of morbidity and mortality [ ]. The International Diabetes Federation (IDF) has reported that diabetes and its complications caused 6.7 million deaths in 2021 [ ]. Of the two main types of diabetes which are type 1 and type 2 diabetes, only 5%–10% account for type 1 diabetes, while the rest (90%–95%) are type 2 diabetes and a small percentage of other rarer form of diabetes. Chronic complications of diabetes can emerge early (about 5 years) after the onset of type 1 diabetes, while in those with type 2 diabetes, it can be present even at the time of diagnosis [ ]. Hyperglycemia-induced diabetic vascular complications alter carbohydrate, protein, fat, and electrolyte metabolism, all of which can disturb the vascular system [ ]. Brownlee [ ] had earlier proposed that endothelial capillary cell damage occurs in the retina, renal glomerulus, and both central and peripheral nerves as a result of excessive harmful glucose accumulation in these cells.
Diabetes causes anatomic, structural, and functional abnormalities in the vascular system, resulting in multiorgan dysfunction [ ]. It can impact the body’s different organ systems, leading to serious complications over time. Vascular complications of diabetes can be classified as microvascular complications (affecting small vessel), which includes neuropathy affecting the peripheral nerves, retinopathy affecting the retina and nephropathy affecting the kidney and macrovascular complications (affecting large vessel), which includes cardiovascular, peripheral vascular, and cerebrovascular diseases [ ]. Both micro- and macrovascular complications have similar etiologic characteristics. Long-standing hyperglycemia contributes significantly to the onset of diabetic vascular complications by causing numerous metabolic and structural changes, such as increased synthesis of advanced glycation end products (AGEs) and reactive oxygen species (ROS), abnormal stimulation of hemodynamic regulation systems, and activation of PKC (protein kinase C) [ ].
Uncontrolled diabetes and longer duration of diabetes appear to be the main risk factors for chronic complications of diabetes [ ]. Diabetes vascular complications can result in frequent hospitalization and premature death; however, this can be avoided or postponed if diabetes is managed properly. In this chapter, we will discuss the epidemiology of various diabetes related complications.
2
Global epidemic of diabetes
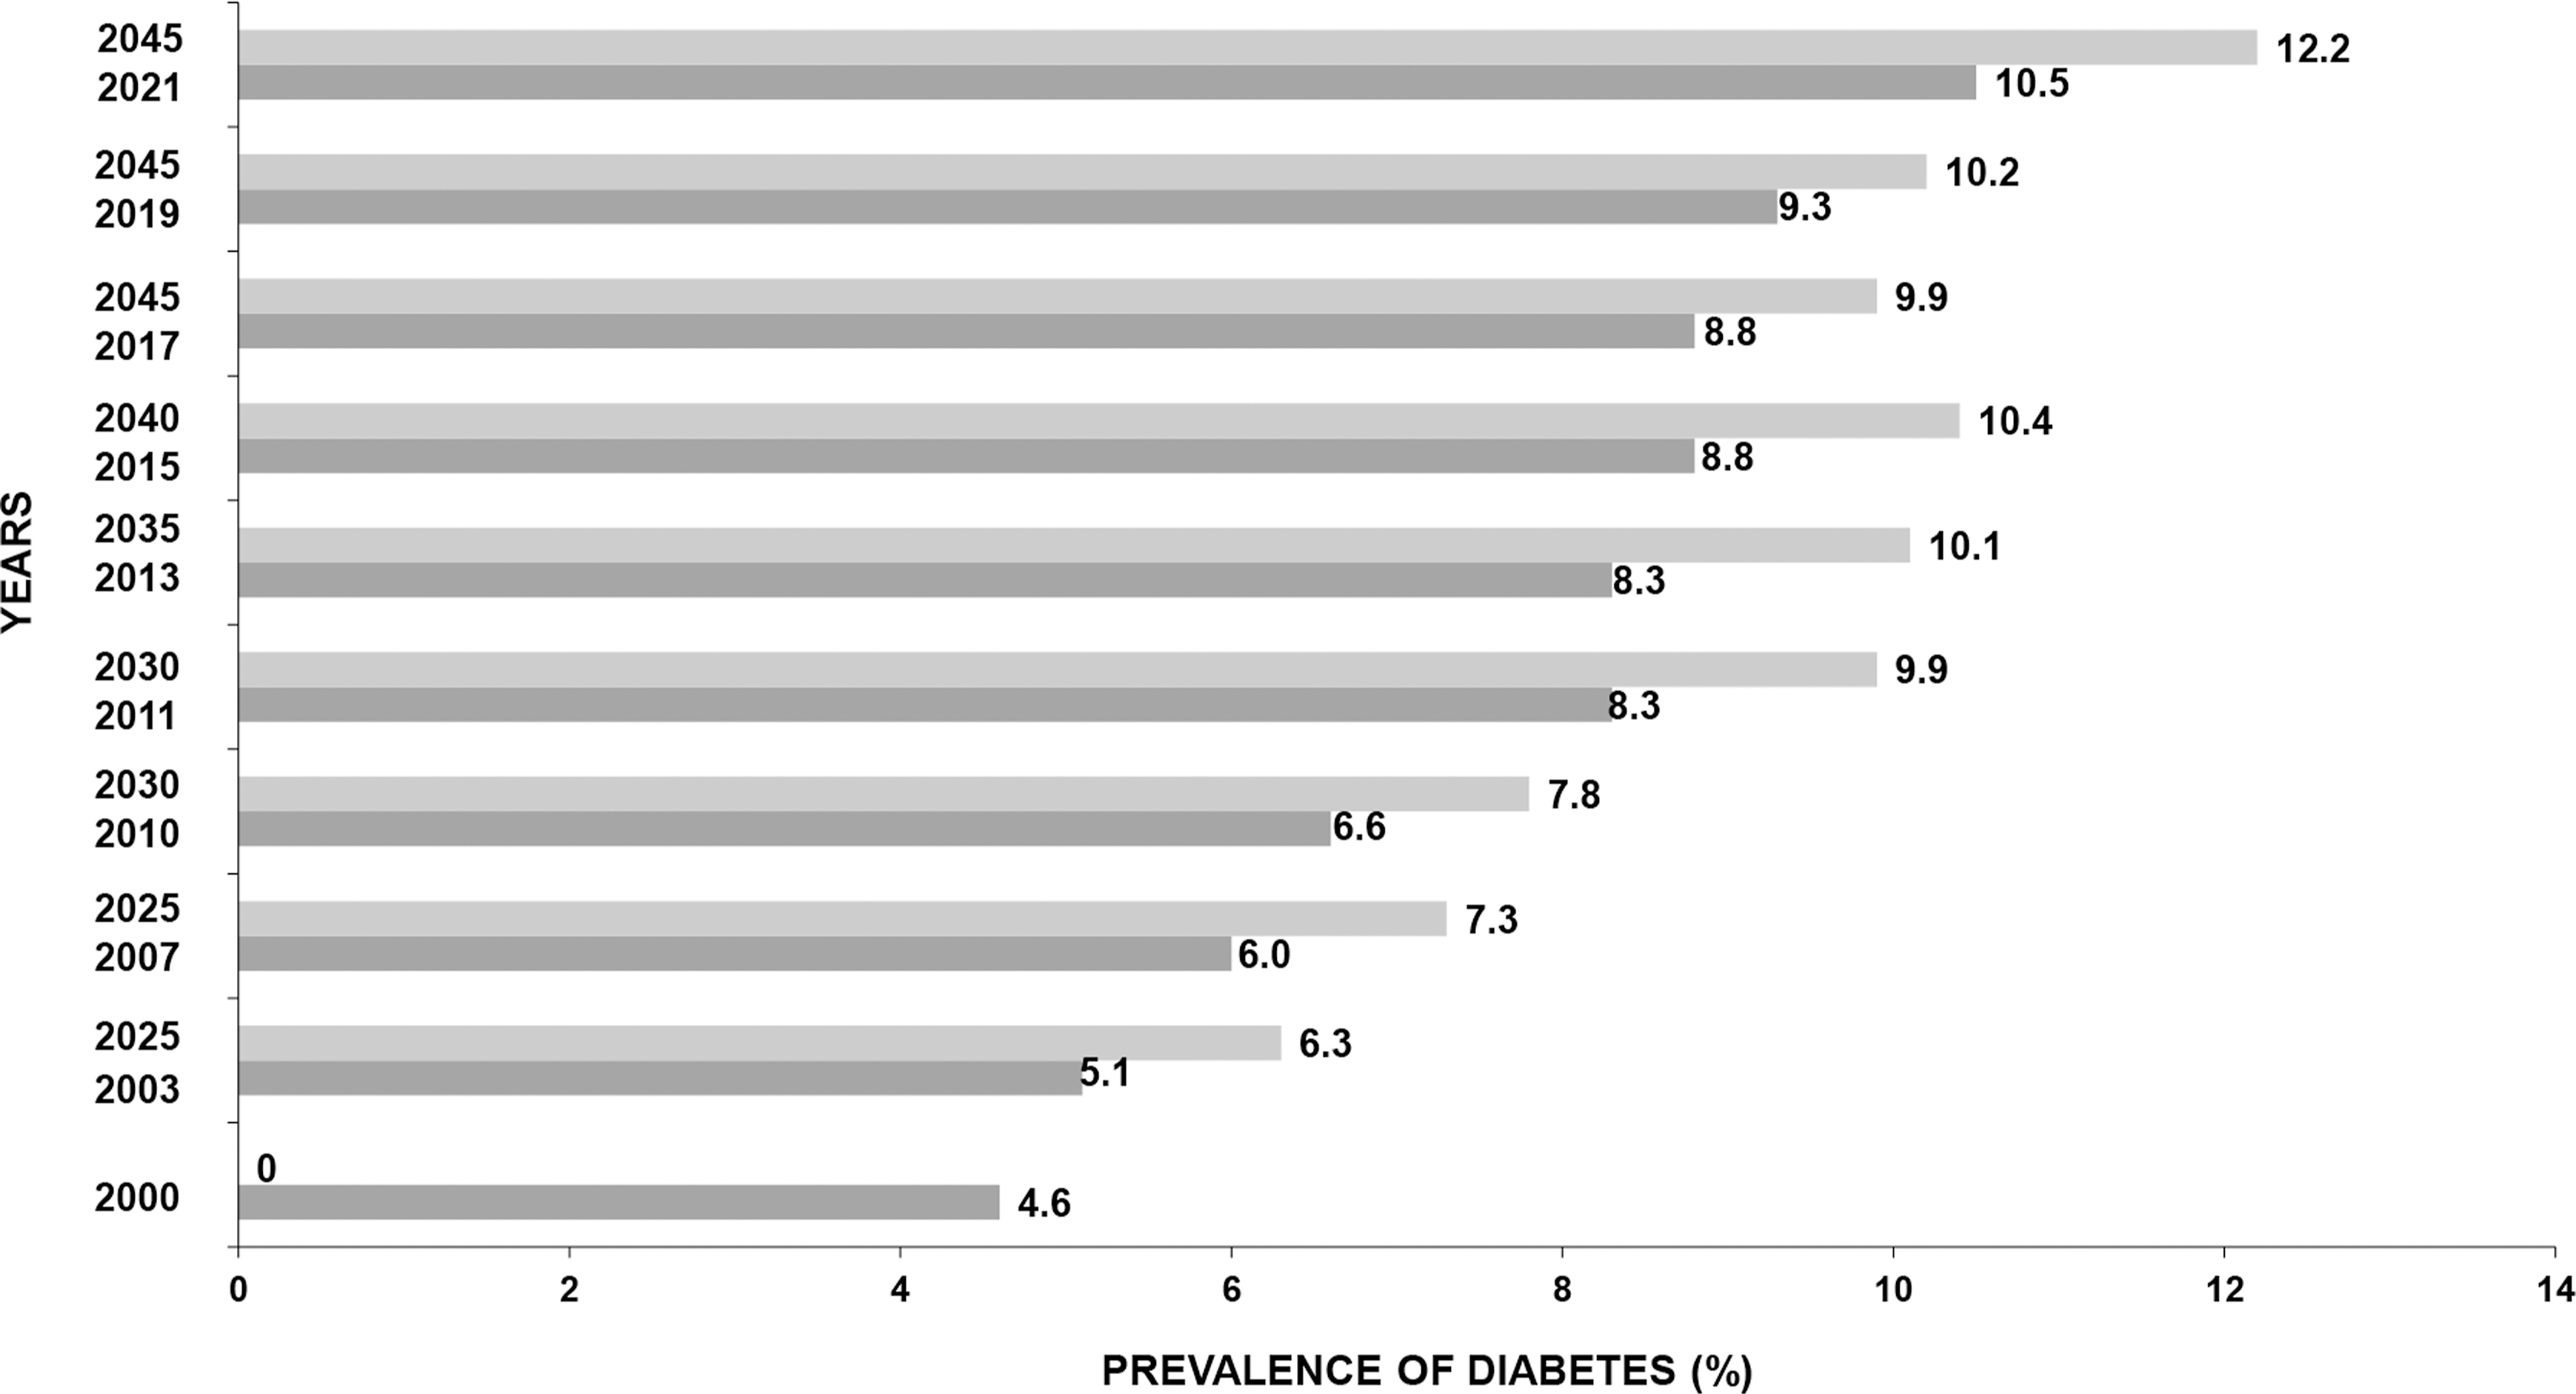
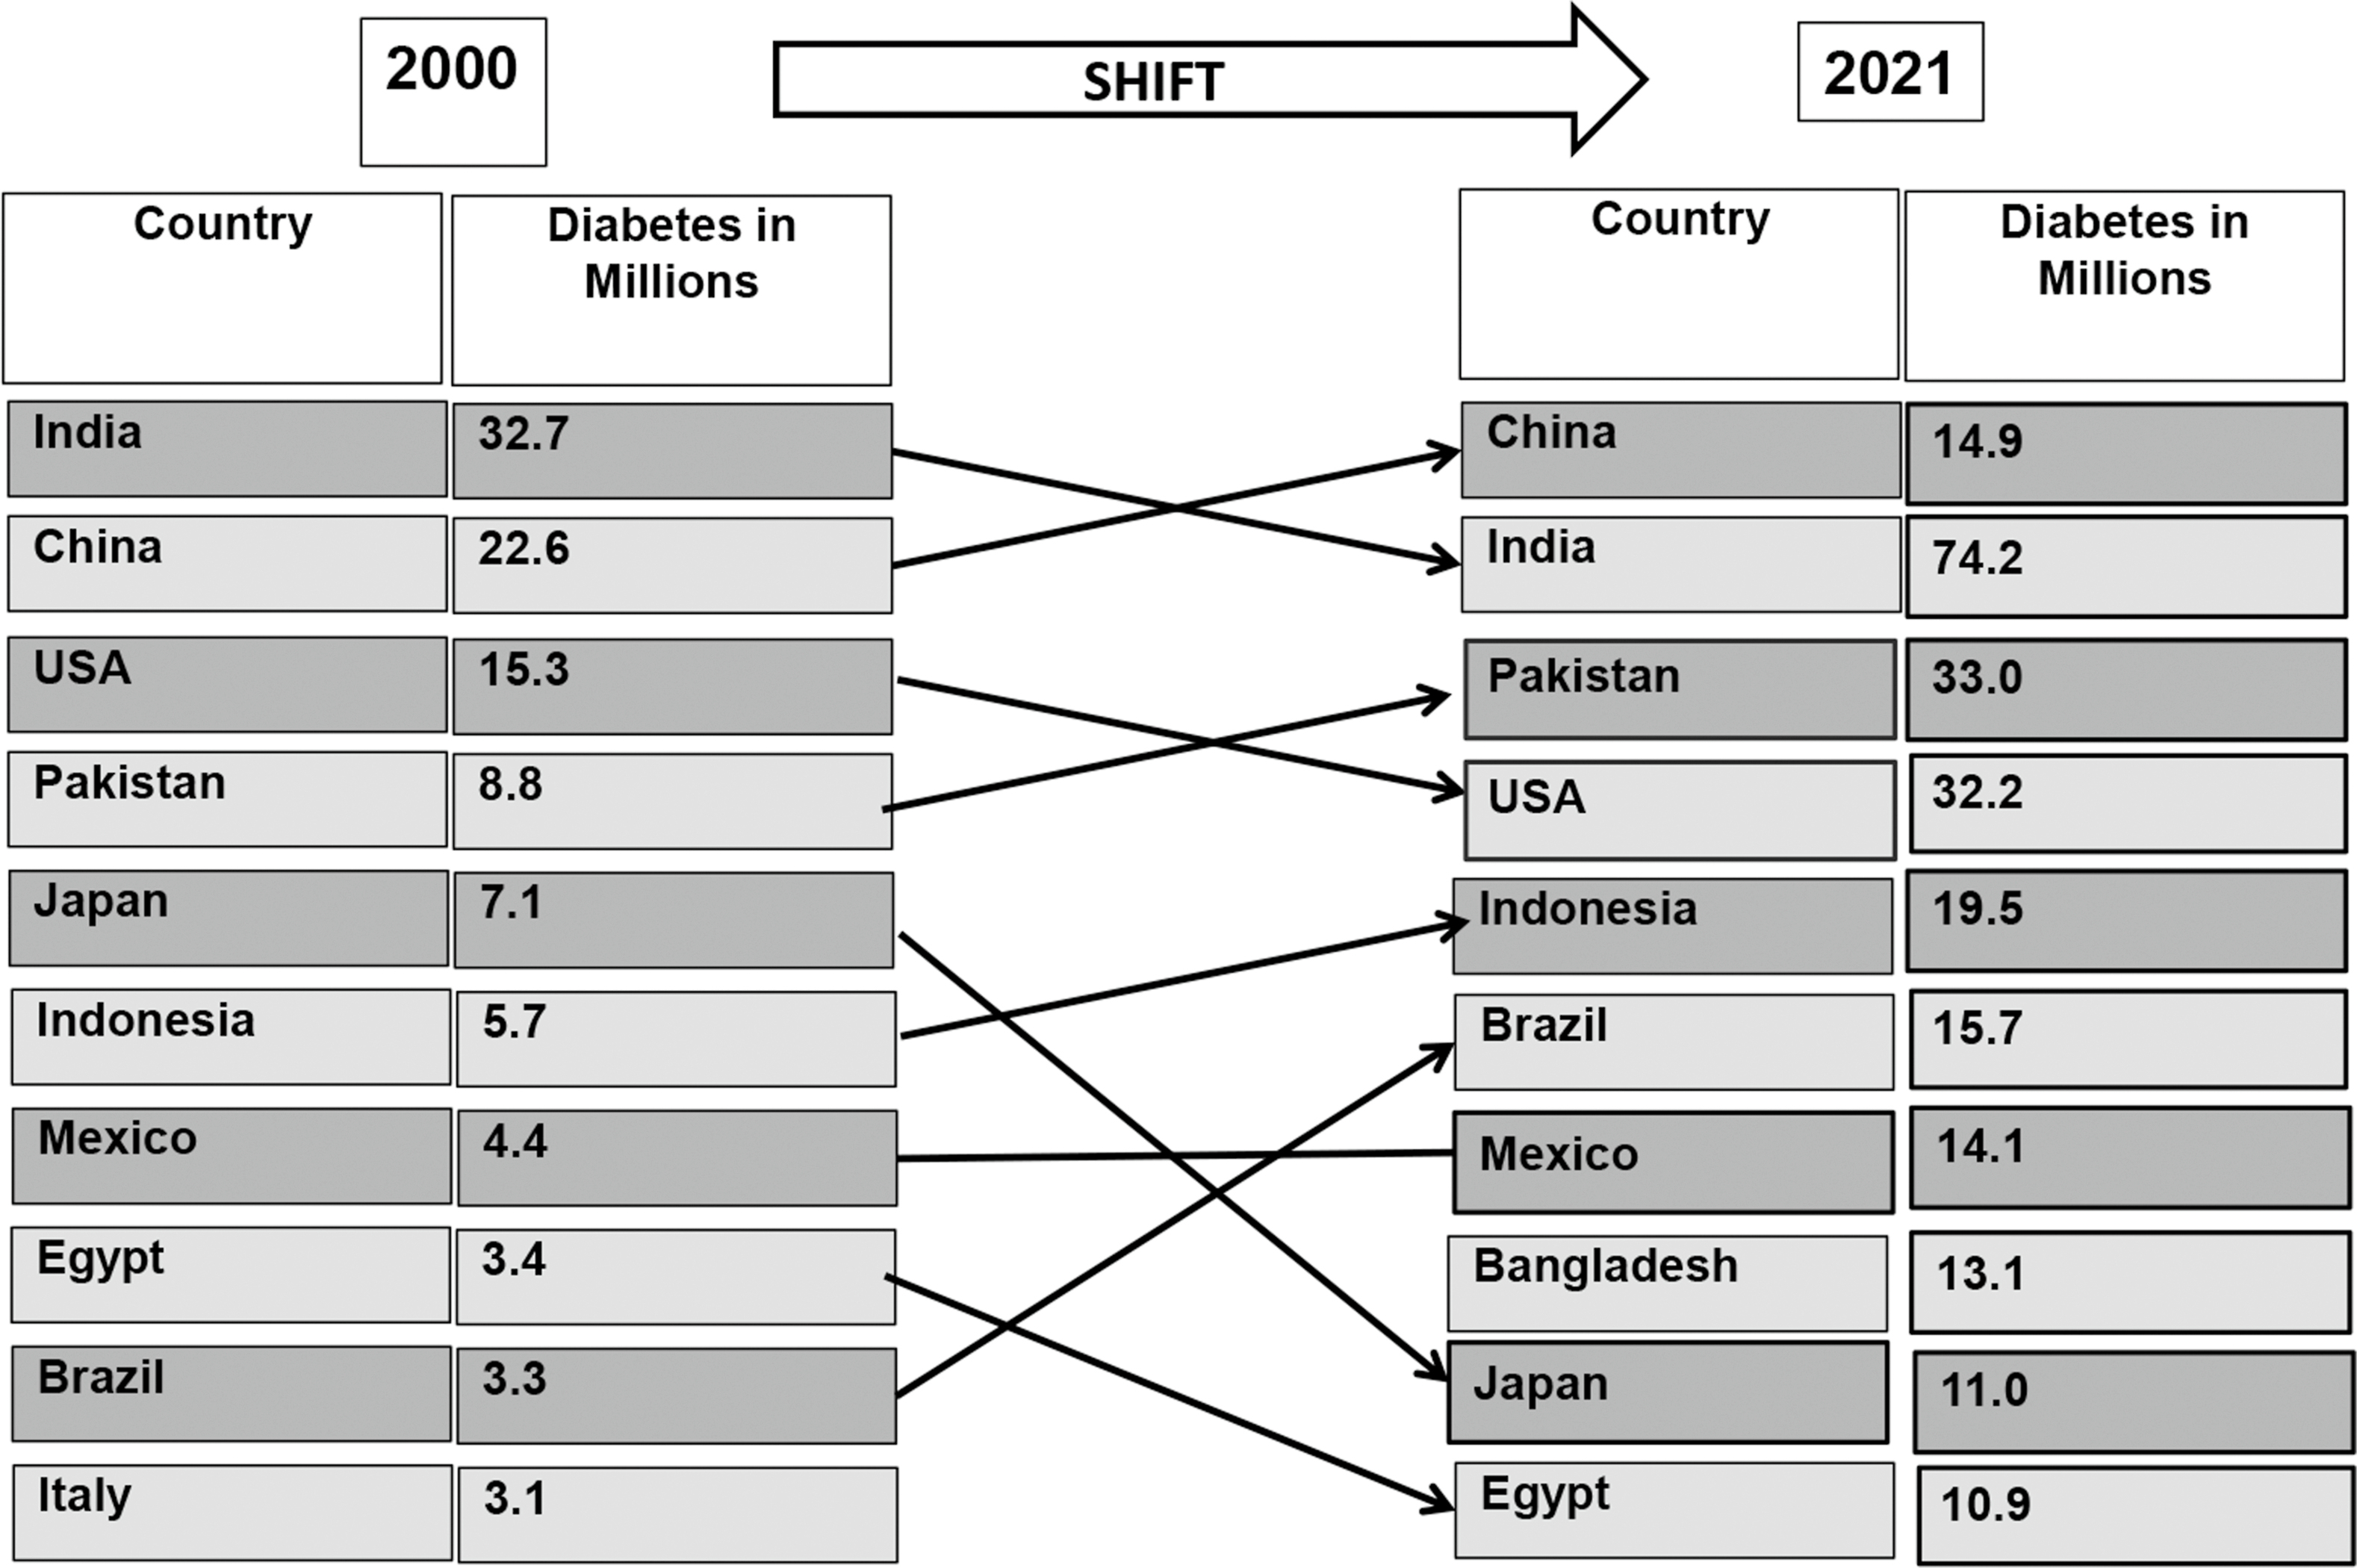
Diabetes prevalence has increased dramatically, in virtually every region of the world in recent decades [ ]. Fig. 2.1 presents the global prevalence of diabetes and its projections according to IDF during the 2 decades [ , ]. In 1990, the number of persons with diabetes worldwide began to escalate dramatically and has exploded since the year 2000 [ ]. The number of persons with diabetes has increased from 153 million in 1980 to 347 million in 2008 [ ]. According to the IDF, globally 537 million people had diabetes (10.5% of the world’s population) in 2021, and if current trends continue, 643 million (11.3% of the world’s population) will have diabetes by 2030 and 783 million people (12.2% of the world’s population) by 2045 [ ]. China, India, Pakistan, Brazil, Mexico, Indonesia, Egypt, and Bangladesh are eight developing countries listed by the IDF in 2021 among the top 10 countries in relation to the number of individuals with diabetes [ ]. China currently has the highest number of individuals with diabetes globally (140.9 million), and this figure is expected to rise to 174.4 million by 2045. While India has the world’s second highest number of people with diabetes (74.2 million) [ ]. Fig. 2.2 illustrates the shift of diabetes burden in different countries from 2000 to 2021 [ , ].
The most significant increase in diabetes is projected in regions that are transitioning from low-income to middle-income status. The Western Pacific region (205.6 million) has the highest number of individuals with diabetes, followed by the South East Asian region (90.2 million), and the African region has the lowest number (23.6 million) among the IDF regions [ ]. The major proportion of this increase could be due to the growing epidemic of T2DM. Similarly, the global incidence of type 1 diabetes is rising, but there is significant variation by nation, with some regions of the world experiencing far greater rates than others. In 2000, ∼4.9 million people (in all age groups) had T1DM, or about 0.09 [ ]. In 2021, globally, 1,211,900 children and adolescents have T1DM [ ].
A study which utilized data from 751 population-based studies from 146 countries (4.4 million participants) reported that number of adults with diabetes globally, increased from 108 million to 422 million and the prevalence rose from 4.3% to 9.0% in men and from 5.0% to 7.9% in women between 1980 and 2014, respectively [ ]. This increase was attributed to increase in prevalence of diabetes (28.5%), population growth and aging (∼40%), and combination of these two variables (32%) [ ]. Recently, the 2017 Global Burden of Disease Study reported that the global prevalence and incidence of diabetes in 2017 was 476 and 22.9 million and estimated to increase in 2025 to 570.9 and 1.59 million, respectively. While death and disability-adjusted life-years (DALYs) associated with diabetes was reported to be 1.37 and 67.9 million in 2017 and projected to increase to 1.59 and 79.3 million in 2025, respectively [ ].
The prevalence of diabetes is undoubtedly higher among urban versus rural populations in developing nations. In India, according to the ICMR-INdia DIABetes (ICMR-INDIAB) study, the prevalence of diabetes in 15 states/UT of the country ranged from 11.2% in urban to 5.2% in rural areas [ ]. Studies have also shown that rural areas are also catching up. According to a systematic review, global rural diabetes prevalence increased from 5.7% in 1985–89 to 8.7% in 2005–11 [ ]. The major causes for the increase in diabetes in the developing economies include increase in type 2 diabetes at a younger age and those who develop diabetes in the productive years (between 35 and 64 years) of their lives [ ]. In addition, data from the Global Burden of Disease Study 2017 concluded that metabolic risks such as increased BMI and behavioral aspects including unhealthy diet, smoking, and physical inactivity led to diabetes mortality and DALYs [ ].
Unfortunately, one in two (44.7%), which estimates to 239.7/537 million adults living with diabetes, still remain undiagnosed [ ]. Undiagnosed diabetes is higher in low-income countries (50.5%) followed by middle-income (48.4%) and high-income countries (28.8%) [ ]. The rate of undiagnosed diabetes is higher in middle- and low-income countries due to less developed health care systems. Due to poor health care systems in middle- and low-income nations, the rate of undiagnosed diabetes is high. Unfortunately, many persons who are undetected for diabetes already have diabetes-related vascular complications. Furthermore, undetected diabetes can put one at higher risk of developing complications in the future and increased healthcare use and related costs [ ]. Thus, early detection is of crucial importance.
In addition, undiagnosed diabetes puts a person at a higher risk of developing complications in the future, as well as increased healthcare use and costs.
3
Epidemiology of chronic complications in diabetes
3.1
Microvascular complications
Microvascular complications like diabetic retinopathy, nephropathy, and neuropathy can have serious implications, such as vision loss, chronic kidney disease, and lower leg amputations, all of which play a substantial role on the burden of health care costs for the individual, family as well as the nation [ ].
3.1.1
Diabetic retinopathy
Retinopathy affects around 30% of all adults with diabetes and is the main reason for visual impairment [ ]. Diabetic retinopathy is regarded as the most specific complication of diabetes, which affects the microvasculature in the retina and is caused by chronic uncontrolled hyperglycemia and other risk factors that leads to both microvascular occlusion and leakage. It affects people with all forms of diabetes. The two types of diabetic retinopathy are nonproliferative diabetic retinopathy (formerly called simple, or background retinopathy) and proliferative diabetic retinopathy. The two sight-threatening forms are proliferative diabetic retinopathy and diabetic macular edema.
A review of studies between 2015 and 2018 on the global prevalence of diabetic retinopathy demonstrated that there is the considerable heterogeneity in prevalence of diabetic retinopathy worldwide and within countries [ ]. This review reported that the United States of America had a wide range of prevalence of any diabetic retinopathy (type 1 diabetes: 36.5%–93.6%; type 2 diabetes: 28.5%–40.3%) and STDR (type 1 diabetes: 6.7%–34.9%; type 2 diabetes: 4.4%–8.2%).
The prevalence of any diabetic retinopathy was estimated to be lower in Asian countries, ranging between 12.1% and 23%, and the prevalence of STDR was reported to be between 4.3% and 4.6%. Singapore was an exception, where the prevalence rates were comparable to those in Western, while among Malaysians, Indians, and Chinese, the prevalence was 33.4%, 33%, and 25.4% respectively.
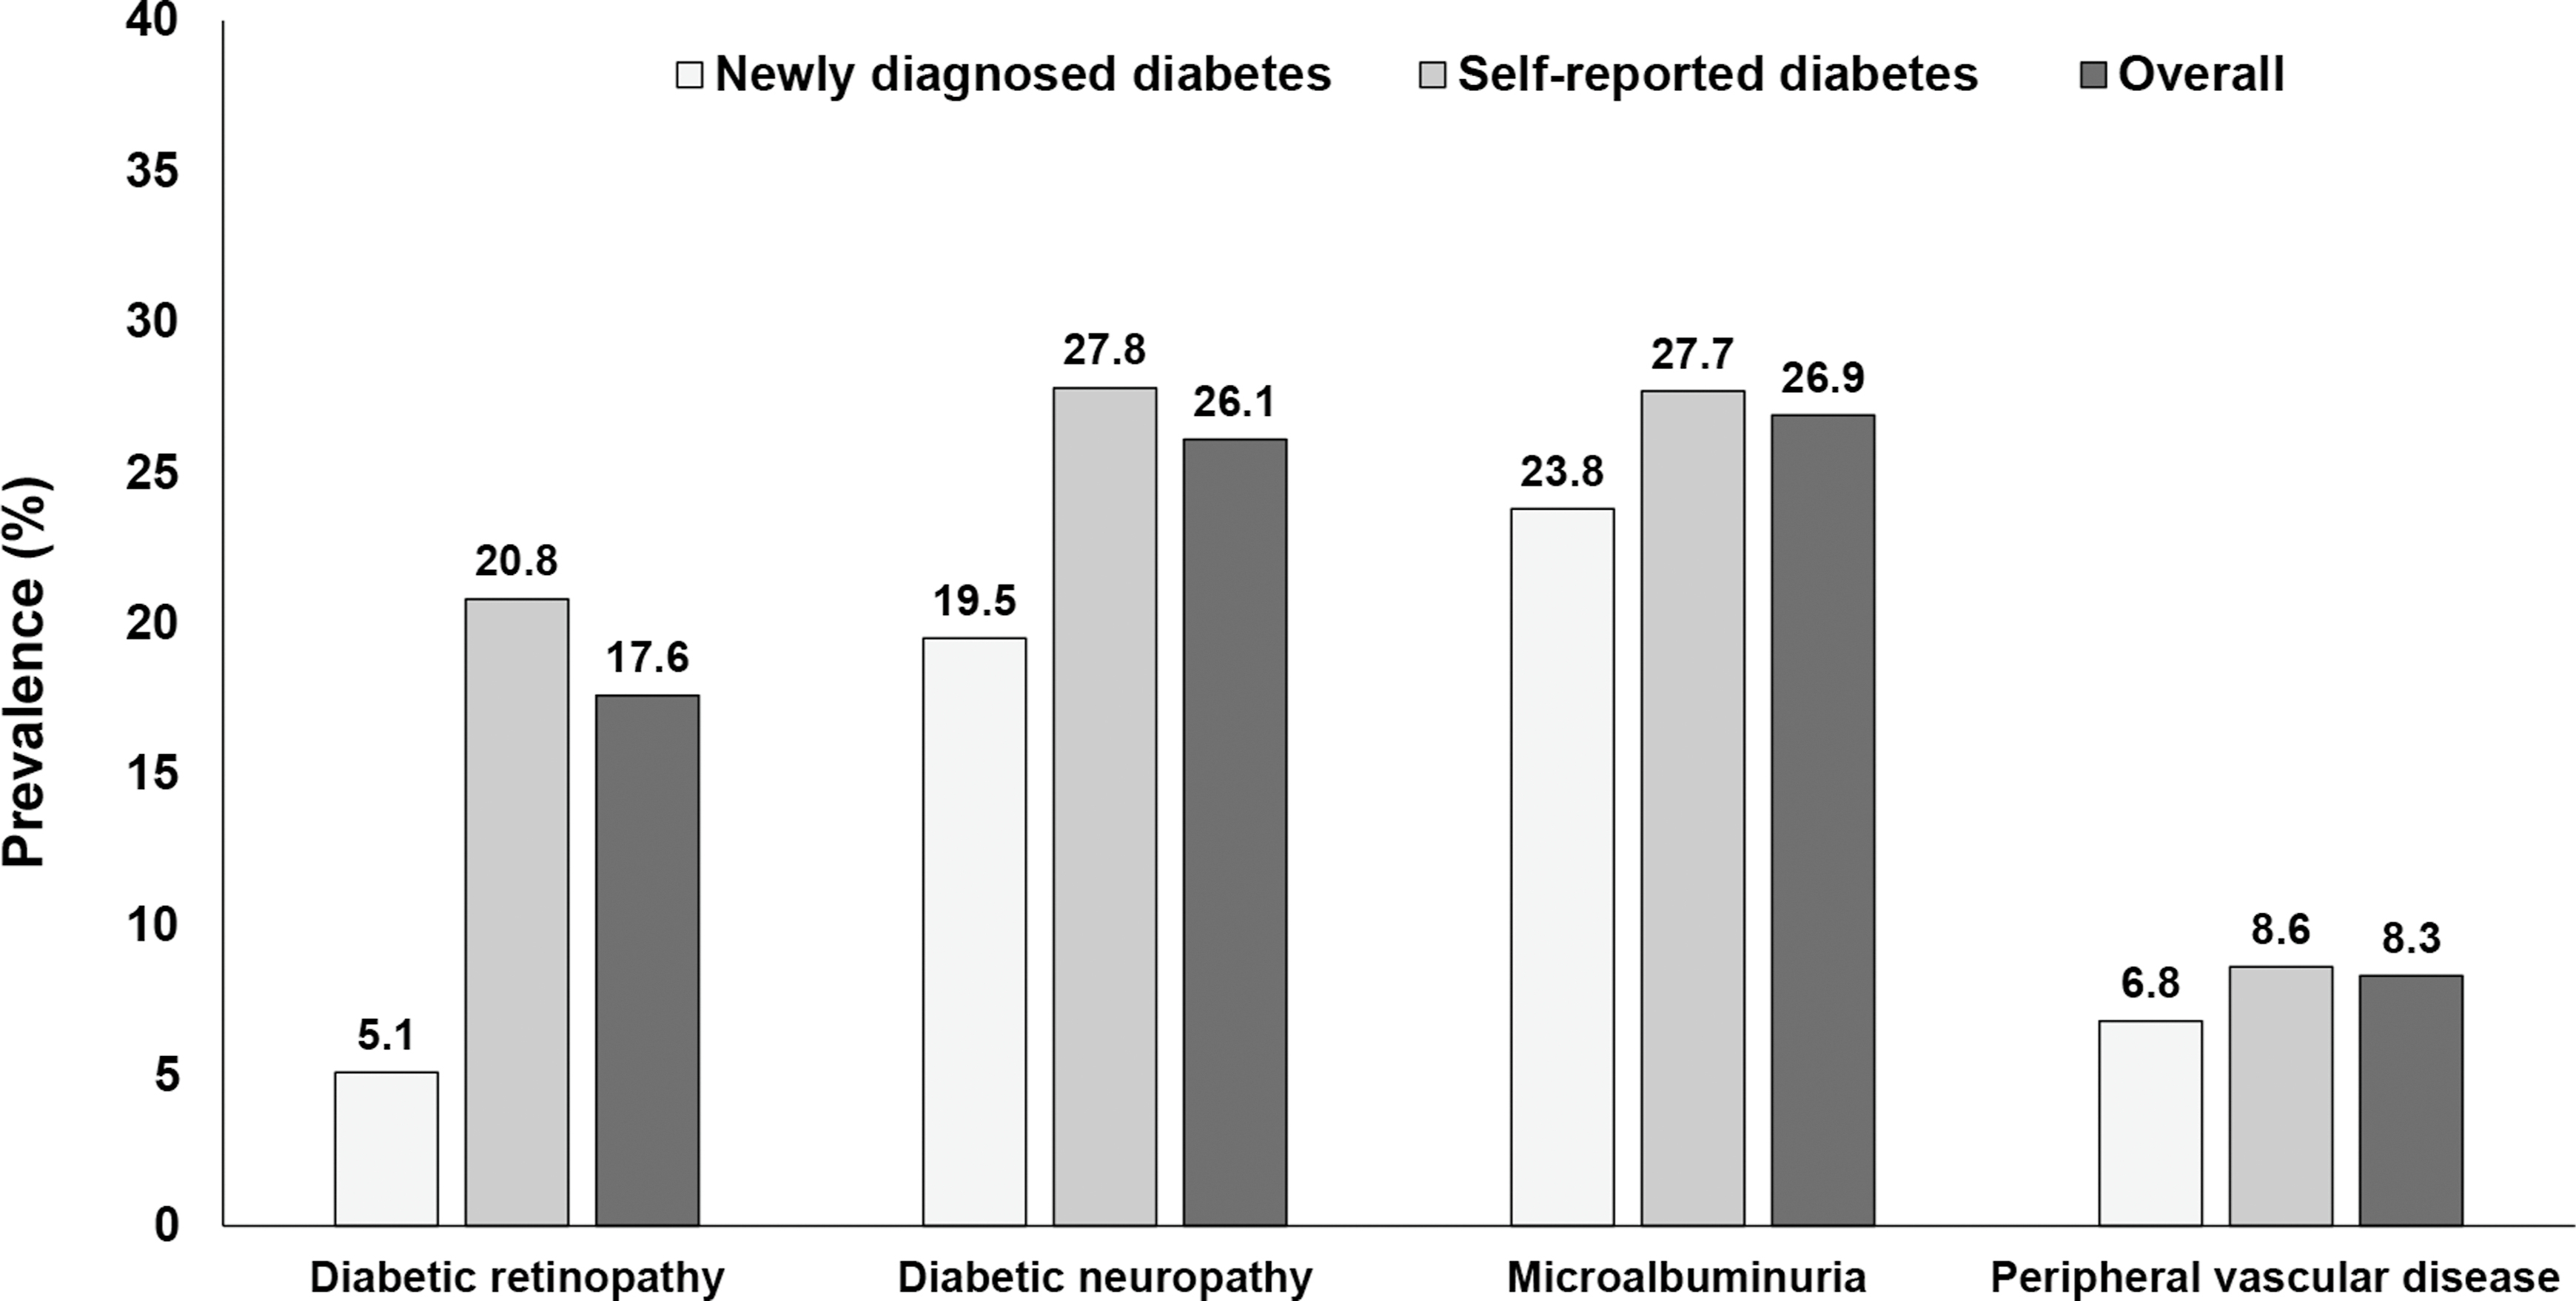
The prevalence of diabetic retinopathy in individuals with type 2 diabetes have come from diabetes centers and population-based studies. Several landmark studies have assessed the burden of diabetic retinopathy prior to the year 2000, which includes the Wisconsin Epidemiologic Study of Diabetic Retinopathy (WESDR) (USA, prevalence: 50.3%) [ ], the Barbados Eye Study (West Indies, prevalence:44.3%) [ ], Blue Mountains Eye Study (Australia, prevalence:29%) [ ], Liverpool Diabetic Eye Study (UK, prevalence:33.6%) [ ], and the Los Angeles Latino Eye study (USA, prevalence:35.1%) [ ]. Table 2.1 presents the prevalence of diabetic retinopathy among type 2 diabetes in selected population-based studies conducted in different populations across the globe in the last 2 decades. The prevalence rates range from 13.7% in Australia to 47.1% in Pacific Island countries [ ]. The Chennai Urban Rural Epidemiology Study (CURES) from south India reported that the prevalence of diabetic retinopathy was higher among individuals with known diabetes (20.8%) compared to those with newly diagnosed diabetes (5.1%) ( Fig. 2.3 ) [ ]. Adoption of internationally agreed-upon screening is required for meaningful comparisons between various regions and ethnic groups around the world.
| Author (Year) | Place | Participants with diabetes (n) | Prevalence (%) |
|---|---|---|---|
| Diabetic retinopathy | |||
| McKay et al. (2000) [ ] | Melbourne, Australia | 233 | 27.5 |
| West et al. (2001) [ ] | Arizona, USA | 899 | 44.3 |
| Tapp et al. (2003) [ ] | Australia | 703 | 13.7 |
| Varma et al. (2004) [ ] | Los Angeles, USA | 1217 | 46.9 |
| Rema et al. (2005) [ ] | Chennai, India | 1715 | 17.6 |
| Wong et al. (2006) [ ] | USA | 778 | 33.2 |
| Wong et al. (2008) [ ] | Singapore | 757 | 35.0 |
| Raman et al. (2009) [ ] | Chennai, India | 1414 | 18.0 |
| Zhang et al. (2010) [ ] | USA | 1006 | 28.5 |
| Chiang et al. (2011) [ ] | Singapore | 401 | 25.4 |
| Papali’i- Curtin et al. (2013) [ ] | Northland, New Zealand | 5647 | 19.0 |
| Win Tin et al. (2014) [ ] | Pacific Island countries | 459 | 47.1 |
| Thomas et al. (2015) [ ] | UK | 91,393 | 32.4 |
| Olafsdothir et al. (2016) [ ] | Sweden | 257 | 33.8 |
| Chang et al. (2017) [ ] | Wellington region, New Zealand | 11,749 | 21 |
| Tan et al. (2018) [ ] | Singapore | 2877 | 28.7 |
| Khalil et al. (2019) [ ] | Alexandria, Egypt | 323 | 34.6 |
| Yin et al. (2020) [ ] | Shijiazhuang, China | 1008 | 40 |
| Diabetic nephropathy | |||
| Atkins et al. (2004) [ ] | Australia | 832 | Microalbuminuria – 15.9 Macroalbuminuria −1.3 |
| Unnikrishnan et al. (2007) [ ] | Chennai, India | 1716 | Microalbuminuria – 26.9 Macroalbuminuria −2.2 |
| Pedro et al. (2010) [ ] | North-East of Spain | 8187 | Microalbuminuria – 17.8 Macroalbuminuria −6.7 |
| Rani et al. (2011) [ ] | Chennai, India | 1414 | Microalbuminuria – 15.9 Macroalbuminuria −2.7 |
| Vupputuri et al. (2011) [ ] | Atlanta, USA | 10,290 | Microalbuminuria – 31.0 Macroalbuminuria −12 |
| Lee et al. (2014) [ ] | Korea | 971 | Microalbuminuria – 19.3 Macroalbuminuria −5.5 |
| Win et al. (2014) [ ] | Nauru | 100 | Microalbuminuria – 71 |
| Win et al. (2014) [ ] | Solomon Islands | 160 | Microalbuminuria – 36.0 |
| Win et al. (2014) [ ] | Vanuatu | 199 | Microalbuminuria – 51.0 |
| Seck et al. (2020) [ ] | Senegal, Africa | 1310 | Microalbuminuria – 59.2 Macroalbuminuria −18.4 |
| Diabetic neuropathy | |||
| Tapp et al. (2003) [ ] | Australia | 398 | 13.1 |
| Gregg et al. (2004) [ ] | USA | 419 | 28.5 |
| Pradeepa et al. (2008) [ ] | Chennai, India | 1629 | 26.1 |
| Karvestedt et al. (2011) [ ] | Sweden | 152 | 43 |
| Katulanda et al. (2012) [ ] | Srilanka | 528 | 24 |
| Kiani et al. (2013) [ ] | Hamadan, Iran | 521 | 49.3 |
| Wang et al. (2014) [ ] | Saudi Arabia | 552 | 19.9 |
| Jane et al. (2016) [ ] | Taiwan | 628 | 30.6 |
| Vibha et al. (2018) [ ] | Manipal, India | 620 | 51.8 |
| Khalil et al. (2019) [ ] | Alexandria, Egypt | 323 | 20.0 |
| Pfannkuche et al. (2020) [ ] | Magdeburg, Germany | 844 | 42.2 |
A systematic review conducted in 2019 using eight population-based studies (5 from Asia, and one each from North America, Caribbean and sub-Saharan Africa) conducted after 2000 reported the annual incidence of diabetic retinopathy ranged between 2.2% and 12.7% and annual progression to sight threatening diabetic retinopathy ranged between 3.4% and 12.3% [ ].
All these surveys have emphasized the importance of glycemic and blood pressure control to prevent the onset and progression of diabetic retinopathy. As individuals even with STDR may not initially have any symptoms, life-long evaluation of retinopathy by retinal screening of all diabetic individuals is necessary. Surgical interventions include laser photocoagulation therapy and vitreoretinal surgery.
3.1.2
Diabetic nephropathy
In the majority of countries, diabetic nephropathy is the leading cause of end-stage renal disease (ESRD). It is linked to increased morbidity and mortality among individuals with diabetes [ ]. This microvascular problem affects around 30% of patients with type 1 diabetes and 40% of people with type 2 diabetes [ ]. Diabetic nephropathy has a number of functional changes including abnormal increase in the filtration rate of the renal glomeruli, hyperperfusion resulting in the development of microalbuminuria (urinary excretion of albumin ranging from 30 to 300 mg/day) and structural changes in multiple kidney compartments which includes thickening of the glomerular basement membrane, loss of endothelial fenestrations, mesangial matrix expansion, and podocytes and fusion of foot processes [ ]. Microalbuminuria is a marker of endothelial dysfunction, as well as a predictor for the development of overt nephropathy. Clinically, diabetic nephropathy is marked by progressive rise in proteinuria, presence of hypertension, and a decrease in glomerular filtration rate. Diabetic nephropathy also leads to an increased risk of cardiovascular disability and death due to both renal failure and cardiovascular disease (CVD). Within a 10-year period, 20%–40% of people progress from microalbuminuria to overt nephropathy, with roughly 20% of these patients advancing to ESRD [ ].
Individuals with type 1 diabetes have a higher risk of diabetic kidney damage than those with type 2 diabetes [ ], while the recent studies have reported the inverse relationship [ ]. Nevertheless, the prevalence of diabetic nephropathy and the rate of progression among individuals with type 2 diabetes are less marked than in type 1 diabetes. This could be attributed to the more insidious nature of diabetes onset in type 2 diabetes, making reliable estimate of the duration of diabetic nephropathy problematic.
Several studies have been conducted globally to examine the prevalence of diabetic nephropathy in referral centers/clinics, but relatively few have been conducted in the general population. Table 2.1 presents the prevalence of diabetic nephropathy among type 2 diabetes in selected population-based studies conducted in different populations across the globe in the last 2 decades [ , ]. The prevalence of microalbuminuria ranged from 17.8% in north eastern Spain to 71% in the Nauru population. While the prevalence of macroalbuminuria ranged from 1.3% in Australia to 18.4% in African population. The increasing burden of nephropathy in type 2 diabetes could be attributed to increasing prevalence of type 2 diabetes, aging population, and improved survival. The CURES study from south India reported that the prevalence of microalbuminuria was 23.8% and 27.7% among individuals with newly diagnosed and known diabetes, respectively ( Fig. 2.3 ) [ ].
The incidence rates of ESRD due to all causes ranged from 132 to 167 per 100,000 person-years in a systematic analysis of individuals with self-reported diabetes, but the incidence rates of ESRD owing to diabetic nephropathy ranged from 38.4 to 804 per 100,000 person-years [ ]. Another systematic review which included 71 studies from 30 countries reported that the annual incidence of ESRD ranged from 0.04% to 1.8%. Among type 1 diabetes, the annual incidence of microalbuminuria and albuminuria was reported to range from 1.3% to 3.8% and from 3.8% to 12.7% for type 2 diabetes and studies combining both types of diabetes [ ].
Diabetes, hypertension, and diabetic nephropathy are highly interlinked. Hypertension is more often a result of chronic kidney disease in type 1 diabetes, while hypertension often precedes chronic kidney disease in type 2 diabetes and contributes to the progression of nephropathy [ ]. Timely intervention can halt or reverse the progression of kidney damage. Development of persistent proteinuria is an ominous sign as GFR progressively declines after that. Although there is strong evidence that effective diabetes control is vital in preventing diabetic nephropathy, some individuals develop the disorder despite good control and others escape despite poor control, implying that hereditary factors play a role in nephropathy susceptibility.
3.1.3
Diabetic neuropathy
Among diabetes complications, a group of clinical disorders caused by damage to the peripheral/autonomic nervous systems are the most common and are inferred to as various forms of neuropathy [ ]. Diabetic neuropathy is a group of disorders classified by the affected organ, rather than a single entity. Neuropathy may be classified as peripheral or autonomic, proximal or distal, focal or diffuse, motor, or sensory. Among the various forms of diabetic neuropathy, diabetic autonomic neuropathies and distal symmetric polyneuropathy are the most common causes of morbidity and mortality (cardiovascular autonomic neuropathy). Diabetic neuropathy affects nearly 50% of individuals with diabetes and is common in both type 1 and type 2 diabetes, implying a common etiologic mechanism based on chronic hyperglycemia. The severity and duration of diabetes have a significant impact on the extent of diabetic neuropathy’s functional and anatomical abnormalities.
Neuropathy is a condition that affects the distal nerves of the limbs, particularly the feet, and damages the symmetrical sensory function, leading to abnormal feelings and gradual numbness, which can lead to ulcers. Foot ulcers and amputations are more common in low- and middle-income countries than in high-income countries [ ]. A review of global incidence of lower extremity amputations stated that individuals with diabetes are 10–20 times at higher risk to have lower limb amputation compared to those without diabetes and the incidence of all forms of lower extremity amputation ranged from 46.1 to 9600 per 10 5 , whereas major amputation ranged from 5.6 to 600 per 10 5 [ ]. It is estimated that neuropathy is presented in 10% of individuals with diabetes at the time of diagnosis, with over 50% of individuals developing neuropathy after a 25-year of diabetes duration [ ].
Several studies have been carried out in the clinic population, while very few in the community. The Rochester Diabetic Neuropathy Study [ ], one of the earliest studies on neuropathy, conducted in late 1980s, reported 66% and 59% prevalence of neuropathy in individuals with type 1 and type 2 diabetes, respectively. Table 2.1 summarizes the prevalence rates of diabetic neuropathy in type 2 diabetes from selected population-based surveys conducted in the lase 2 decades [ ]. The prevalence rates of neuropathy vary widely from 13.1% to 59.0% in different populations. In the CURES, conducted in Chennai, South India, the prevalence of peripheral neuropathy among newly diagnosed diabetes population was reported to be 19.5% and among those with known diabetes a higher rate of 27.8% was reported ( Fig. 2.3 ) [ ].
The epidemiology of diabetic neuropathy is uncertain, mainly due to the definitions used to identify neuropathy and different diagnostic criteria employed (clinical signs and symptoms, pin-prick perception, quantitative sensory/electrodiagnostic tests) to screen for the disorder.
Approaches to prevention of neuropathy include tight control of hyperglycemia, regular foot examination, and lifestyle modifications. Most treatments for diabetic neuropathy are unfortunately only symptomatic.
3.2
Macrovascular complications
Macrovascular complications are nonspecific to diabetes as it may also occur in people without diabetes. CVD, peripheral vascular disease, and cerebrovascular disease are thought to form a deadly triangle, resulting in significant morbidity and death.
3.2.1
Cardiovascular disease
Cardiovascular disease (CVD) consist of coronary heart disease, cardiomyopathy, and arrhythmias and is the primary cause of morbidity and mortality in individuals with diabetes [ ]. This is because type 2 diabetes is part of the metabolic cluster, which includes insulin resistance, hypertension, abdominal obesity, and prothrombotic state. CVD strikes those with diabetes around 2 decades earlier [ ], and women with diabetes have a higher CVD risk than men.
Between the 1950s and 1990s, the absolute risk of CVD reduced by 35% and 49% in persons without diabetes and with diabetes, respectively, according to the Framingham Heart Study’s multigenerational cohort, which looked at CVD and associated risk factors. In addition, the study found that those with diabetes have nearly 2-fold increased risk of developing CVD compared to people without diabetes [ ].
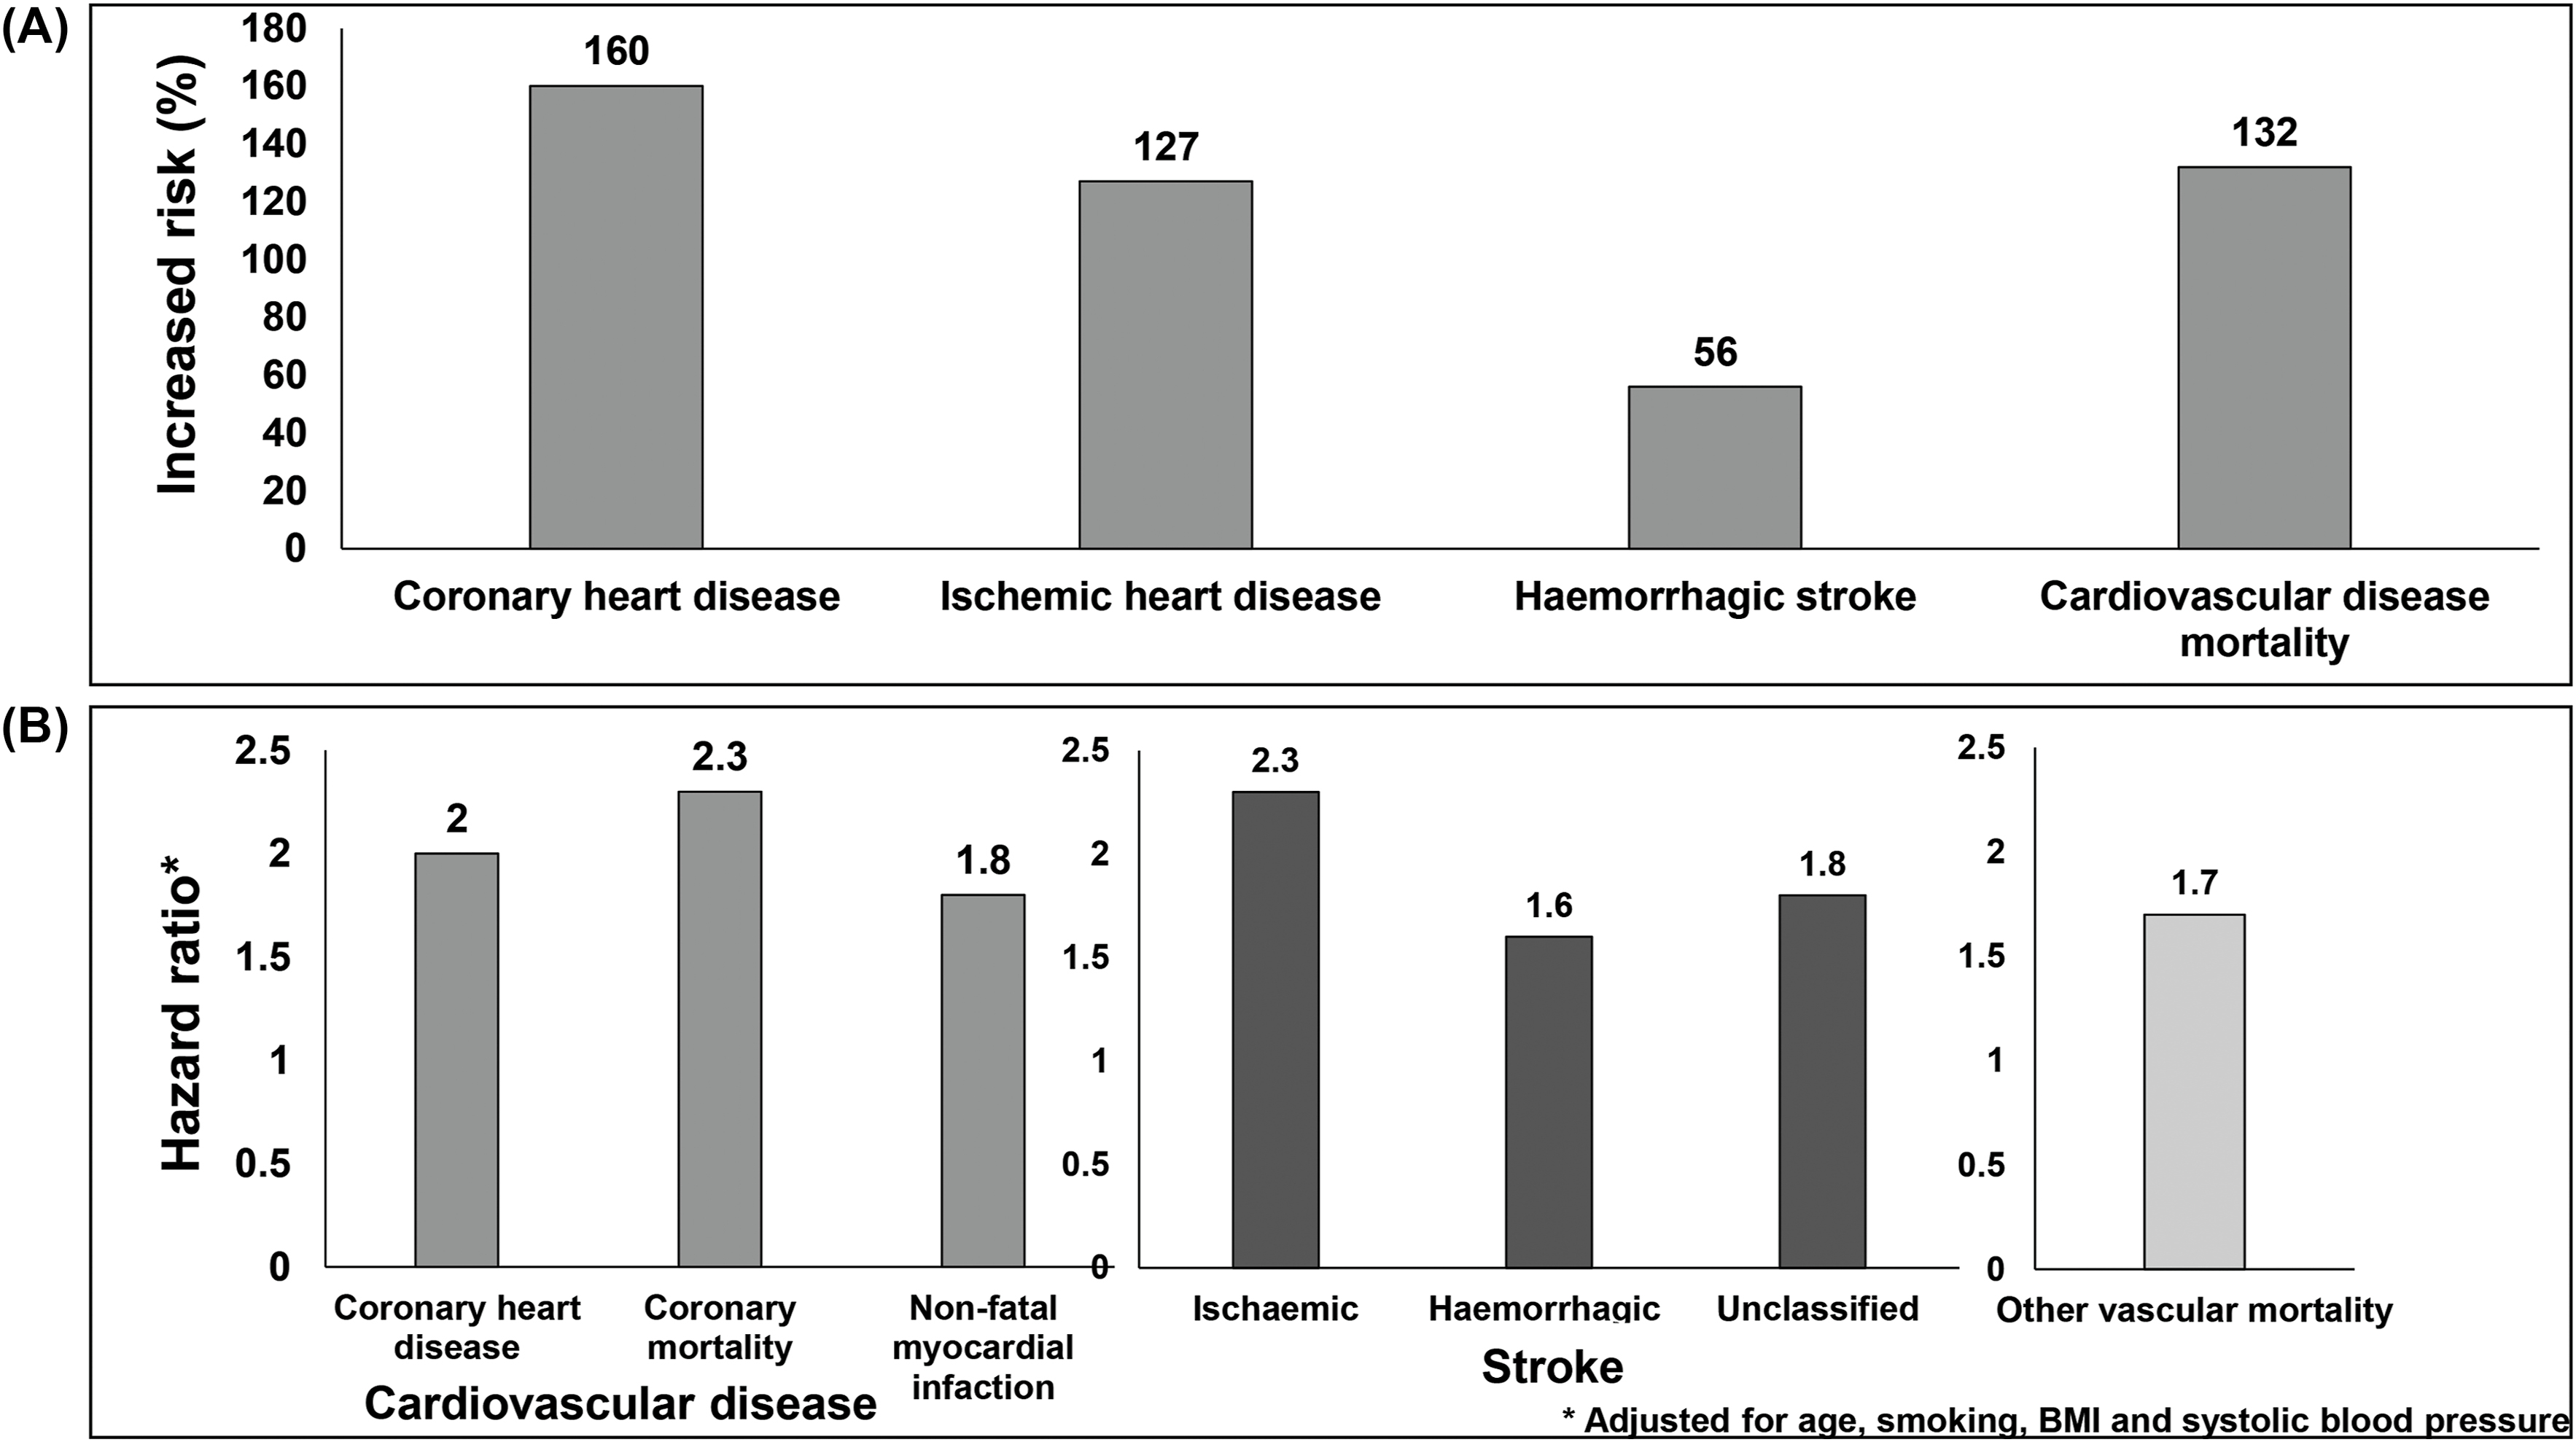
Meta-analysis of 102 prospective studies by Emerging Risk Factors Collaborators indicate that the relative risk of CVD is between 1.6 and 2.6; however, the relative risk was reported to be higher among younger people and women [ , ]. Fig. 2.4A presents the impact of diabetes on CVD. Individuals with diabetes had 160% increased risk for coronary heart disease, 127% increased risk for ischemic heart disease and 132% increased risk for CVD mortality [ , ]. In people with diabetes, the hazard ratio for coronary heart disease was reported to be 2·27; for coronary death 2.31; for nonfatal myocardial infarction 1.82 and for other vascular deaths, it was 1.73 ( Fig. 2.4B ) [ ].