Fig. 1.1
Age-standardised cancer incidence and mortality rates in sub-Saharan Africa by gender (Ferlay et al. 2013)
1.2.1 Males
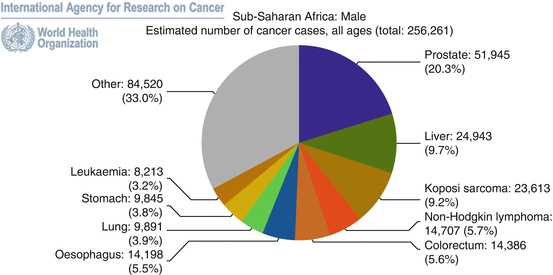
Prostate cancer accounted for the highest estimated number of cancer cases for all ages in males in 2012 with 20.3% of the overall cancer burden, followed by liver cancer (9.7%), Kaposi sarcoma (9.2%), Non-Hodgkin lymphoma (5.7%) and Colorectal cancer (5.6%) (Fig. 1.2). In prostate cancer, there is genetic predisposition and patients in SSA tend to present late. Liver cancer is associated with hepatitis B & C infection and alcohol consumption including local spirits. Kaposi sarcoma is linked to the Human Herpes Virus 8 (HHV8; also known as Kaposi Sarcoma Associated Herpes-Virus (KSHV)) infection and AIDS with on-going epidemics of the latter in SSA. Dietary and lifestyle changes with a trend towards those of the developed world has contributed towards the colorectal cancer proportions. Men tend to be younger at presentation with colorectal cancer in South Africa with median age of 59 years (Wentink et al. 2010) compared with 71 years in North America (Horner et al. 2009).
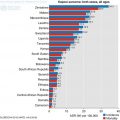
Age-standardised mortality rates from cancers in Sub-Saharan African men in 2012 was highest for prostate cancer (20.9%), followed by liver cancer (9.6%), Kaposi Sarcoma (6.5%), Oesophageal (6.4%), Colorectal (4.9%) and lung (4.3%) cancers (Table 1.1). The high mortality rates for these cancers are often due to late presentation, lack of diagnostic and treatment facilities and an immunocompromised state (especially with Kaposi sarcoma). In comparison to the rest of the world regions, mortality rates from prostate cancer, for example, is disproportionately higher (Fig. 1.3).
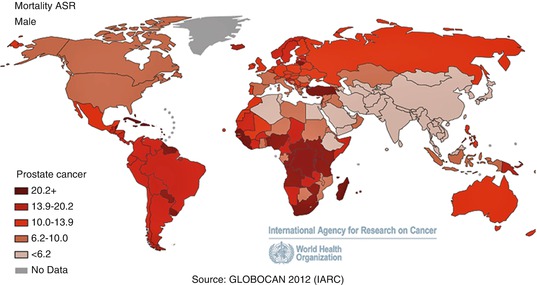
Table 1.1
Estimated incidence, mortality and 5-year prevalence of cancers in sub-Saharan men (Ferlay et al. 2013)
Cancer | Incidence | Mortality | 5-year prevalence | ||||||
|---|---|---|---|---|---|---|---|---|---|
Number | (%) | ASR (W) | Number | (%) | ASR (W) | Number | (%) | Prop. | |
Lip, oral cavity | 7997 | 3.1 | 3.5 | 5092 | 2.5 | 2.4 | 18,456 | 4.1 | 7.4 |
Nasopharynx | 3219 | 1.3 | 1.2 | 2313 | 1.2 | 0.9 | 8305 | 1.8 | 3.3 |
Other pharynx | 2748 | 1.1 | 1.2 | 2148 | 1.1 | 1.0 | 6492 | 1.4 | 2.6 |
Oesophagus | 14,198 | 5.5 | 6.8 | 12,982 | 6.5 | 6.4 | 13,734 | 3.0 | 5.6 |
Stomach | 9845 | 3.8 | 4.5 | 9014 | 4.5 | 4.2 | 13,156 | 2.9 | 5.3 |
Colorectum | 14,386 | 5.6 | 6.4 | 10,715 | 5.3 | 4.9 | 29,139 | 6.4 | 11.8 |
Liver | 24,943 | 9.7 | 10.2 | 23,903 | 11.9 | 9.6 | 17,140 | 3.8 | 6.9 |
Gallbladder | 679 | 0.3 | 0.3 | 634 | 0.3 | 0.3 | 878 | 0.2 | 0.3 |
Pancreas | 4126 | 1.6 | 2.0 | 3994 | 2.0 | 2.0 | 2971 | 0.7 | 1.2 |
Larynx | 4371 | 1.7 | 2.1 | 2763 | 1.4 | 1.4 | 9551 | 2.1 | 3.9 |
Lung | 9891 | 3.9 | 4.8 | 8861 | 4.4 | 4.3 | 7882 | 1.7 | 3.2 |
Melanoma of skin | 2594 | 1.0 | 1.2 | 1421 | 0.7 | 0.7 | 7748 | 1.7 | 3.1 |
Kaposi sarcoma | 23,613 | 9.2 | 7.2 | 16,218 | 8.1 | 6.5 | 40,862 | 9.0 | 16.5 |
Prostate | 51,945 | 20.3 | 27.9 | 37,802 | 18.8 | 20.9 | 135,859 | 30.0 | 54.9 |
Testis | 959 | 0.4 | 0.3 | 574 | 0.3 | 0.2 | 3009 | 0.7 | 1.2 |
Kidney | 3119 | 1.2 | 1.0 | 2658 | 1.3 | 0.9 | 4313 | 1.0 | 1.7 |
Bladder | 6460 | 2.5 | 3.0 | 3873 | 1.9 | 1.9 | 14,039 | 3.1 | 5.7 |
Brain, nervous system | 2709 | 1.1 | 0.9 | 2193 | 1.1 | 0.8 | 3587 | 0.8 | 1.5 |
Thyroid | 1726 | 0.7 | 0.7 | 973 | 0.5 | 0.5 | 5305 | 1.2 | 2.1 |
Hodgkin lymphoma | 2978 | 1.2 | 0.8 | 1870 | 0.9 | 0.7 | 6652 | 1.5 | 2.7 |
Non-Hodgkin lymphoma | 14,707 | 5.7 | 4.7 | 10,714 | 5.3 | 3.8 | 17,270 | 3.8 | 7.0 |
Multiple myeloma | 1920 | 0.7 | 0.9 | 1671 | 0.8 | 0.9 | 2923 | 0.6 | 1.2 |
Leukaemia | 8213 | 3.2 | 2.7 | 7400 | 3.7 | 2.6 | 7973 | 1.8 | 3.2 |
All cancers excl. non-melanoma skin cancer | 256,261 | 100.0 | 108.9 | 200,881 | 100.0 | 90.4 | 452,684 | 100.0 | 182.8 |

Fig. 1.3
Age-standardised mortality rates (per 100,000) for prostate cancer in sub-Saharan Africa compared to the world regions (Ferlay et al. 2013)
1.2.2 Females
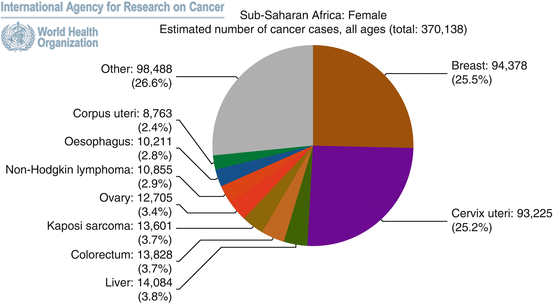
The most burden of cancer cases for all ages in women in SSA in 2012 was from breast (25.5%) and cervix uteri cancer (25.2%) (Fig. 1.4). The lack of optimal screening programmes for these cancers, papanicolaou smears or HPV DNA screening for cervical cancer and mammography for breast cancer drives late presentation which ultimately leads to poor quality of life and high mortality.
In 2012, the age-standardised mortality rate from cervix uteri cancer was highest in SSA at 22.5% (Table 1.2), compared to 2.6% in North America (Fig. 1.5) and mortality from breast cancer was 17.2% compared to 14.8% in North America.
Table 1.2
Estimated age-standardised incidence and mortality rates for women in sub-Saharan Africa (Ferlay et al. 2013)
Cancer | Incidence | Mortality | 5-year prevalence | ||||||
|---|---|---|---|---|---|---|---|---|---|
Number | (%) | ASR (W) | Number | (%) | ASR (W) | Number | (%) | Prop. | |
Lip, oral cavity | 5475 | 1.5 | 2.1 | 3562 | 1.4 | 1.4 | 12,855 | 1.5 | 5.1 |
Nasopharynx | 2095 | 0.6 | 0.7 | 1529 | 0.6 | 0.5 | 5251 | 0.6 | 2.1 |
Other pharynx | 1317 | 0.4 | 0.5 | 965 | 0.4 | 0.4 | 2824 | 0.3 | 1.1 |
Oesophagus | 10,211 | 2.8 | 4.2 | 9391 | 3.8 | 4.0 | 9804 | 1.1 | 3.9 |
Stomach | 8257 | 2.2 | 3.4 | 7749 | 3.1 | 3.2 | 11,199 | 1.3 | 4.4 |
Colorectum | 13,828 | 3.7 | 5.4 | 10,361 | 4.2 | 4.1 | 28,158 | 3.3 | 11.2 |
Liver | 14,084 | 3.8 | 5.4 | 13,450 | 5.4 | 5.1 | 9457 | 1.1 | 3.8 |
Gallbladder | 1401 | 0.4 | 0.6 | 1324 | 0.5 | 0.5 | 1739 | 0.2 | 0.7 |
Pancreas | 3941 | 1.1 | 1.6 | 3795 | 1.5 | 1.6 | 2823 | 0.3 | 1.1 |
Larynx | 731
Stay updated, free articles. Join our Telegram channel
Full access? Get Clinical Tree
 Get Clinical Tree app for offline access

| ||||||||
