and represents the change in displacement with depth (i.e., how tissue compresses). Strain is related both to the applied stress (σ, i.e., force per unit area) and the inherent tissue mechanical properties (E, the elastic, or Young’s modulus), and under simplifying assumptions is described by the equation:

(1)
The elastic modulus describes the stiffness of tissue; stiffer tissues have a higher elastic modulus than softer tissues. Since strain is inversely proportional to the elastic modulus, for a given stress, stiffer structures exhibit smaller strain, or displacement, and softer tissues exhibit larger strains (Fig. 1). Both MRI and ultrasound can be used to measure tissue motion; thus, in compressive strain imaging methods, tissue displacement in response to an applied stress is measured, and images of tissue displacement or strain are generated that reflect relative differences in tissue stiffness.
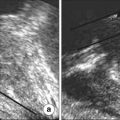
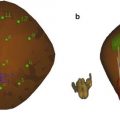
Fig. 1
Schematic representation of tissue with a soft circular inclusion (top, light gray) and stiff circular inclusion (bottom, dark gray) prior to compression (a), post-compression (b), the induced displacements (c), and the computed strain (d). The background has linearly varying displacement throughout depth due to the applied force at the top of the tissue and fixed bottom boundary; thus, the background has constant strain, as represented by the yellow line. The displacement in the region with the two inclusions is piecewise linear, with different slopes in the lesions and the background. The soft lesion displaces more than the background and the stiff inclusion displaces less than the background; thus, the strain provides information about the relative stiffnesses of the lesions compared to the background
In addition to compressing the tissue, it is possible to generate shear waves in the tissue. These shear waves propagate in a direction orthogonal to the applied stress and are similar in concept to the ripples that propagate away from a pebble dropped in water. The spatial and temporal behavior of a shear wave in tissue is governed by the wave equation:
where u is the displacement of the tissue, c s is the wave speed, and ∇2 is the Laplacian operator.
(2)
Equation (2) relates the spatial behavior of the wave (left side of the equation) to the temporal behavior of the wave (right side of the equation). Additionally, there is a constant of proportionality, c s, which is known as the shear wave speed. The shear wave speed can be related to the shear modulus through assumptions of linear elasticity and homogeneity, such that μ = ρc s2 where μ is the shear modulus and ρ is the density. Furthermore, under the assumption of incompressibility, which is considered reasonable in soft tissues such as the prostate, the shear modulus is directly proportional to the Young’s modulus, such that E = 3μ = 3ρc s2. Therefore, if the shear wave speed is measured using elastographic techniques, it is common to directly estimate the corresponding shear and Young’s moduli, which represent the inherent material elastic properties of the tissue. It is important to be aware of the specific stiffness parameter that is presented in quantitative elastographic images (i.e., c s, E, or μ).
Elastic Properties of the Prostate
In order for elastography to successfully differentiate PCa from surrounding tissue, prostate lesions must have material properties distinct from healthy tissue. A number of studies have shown that PCa has substantially different biomechanical properties compared to healthy prostate tissue [18]. This seems reasonable because tumor formation involves a complex series of events including uncontrolled cell growth, angiogenesis/vascularization, and substantial changes in the underlying tissue microenvironment that set it apart from healthy tissue [19, 20]. In addition, PCa has been shown to have increased cell density and collagen deposition (implying an immune response), increased microvessel density, and changes in stromal to glandular ratios relative to healthy peripheral zone tissues [16, 21].
Taken together, these biomechanical changes result in tumor tissues that tend to be stiffer than surrounding tissue, which has been demonstrated in a number of studies. Zhang et al. performed a study on ex vivo prostates and found that the Young’s moduli of normal posterior and cancerous prostatic tissue were 15.9 ± 5.9 and 40.4 ± 15.7 kPa, respectively [22]. Zhai et al. utilized quantitative shear wave-based elastography methods in ex vivo samples and reported that the Young’s moduli of normal peripheral zone and cancerous prostatic tissues were 12.3 ± 2.4 and 30 ± 3.0 kPa, respectively [11]. Although the stiffness differed between the studies, both found that there is approximately a 2.5× increase in the stiffness of the cancerous regions as compared to the prostatic peripheral zone tissue.
Elastographic Imaging Methods in Prostate
Strain Imaging
The vast majority of prostate elastography clinical studies have employed strain imaging (i.e., compression elastography) because this method has been commercially available for the past decade [1, 3, 5, 23–29]. Strain imaging requires the user to obtain a B-mode image of the prostate, then compress the organ and obtain a second B-mode image. The tissue displacement is estimated using correlation-based techniques and the strain between the two states is then computed [27, 30].
Strain imaging assumes that the operator applies a uniform stress across the prostate and out-of-plane motion is negligible. Stiffer regions can then be identified by their relatively low strain compared to the surrounding tissue as shown in Fig. 1. Elastography is typically performed as a free-hand technique with the operator gently compressing the prostate with the ultrasound transducer. A skilled technician is needed to obtain adequately uniform compression, which can be challenging. Some recent studies have used inflatable balloons that surround the endorectal transducer and can be filled or emptied by the operator, thereby generating a more uniform stress on the prostate [27, 31, 32].
Researchers have also investigated the potential use of strain imaging to obtain quantitative information about the tissue. To accomplish this, the inverse problem is solved using models of the tissue structure and displacement data. While this method holds promise, it has not been used clinically to date due to challenges with implementation [33, 34].
Transrectal ultrasound (TRUS) is widely used for prostate visualization during systematic prostate biopsies, but it is not typically used for targeting regions of suspicion since tumors are often not visualized by TRUS [1, 2, 25]. The primary use of strain imaging investigated in the clinical literature is for biopsy guidance. As will be reviewed below, many studies have employed conventional biopsy techniques, and then used strain imaging to identify and target additional regions [1, 3, 23, 24, 29, 31]. Some studies have acquired elastographic strain imaging data and retrospectively compared suspicious regions with those that were biopsied [5] or with whole-mount histology after the prostate was excised [28].
Cochlin et al. demonstrated a significant improvement using strain imaging as compared to TRUS for PCa biopsy guidance. The authors studied 100 patients and using elastography identified five cancers that would not have otherwise been biopsied. Additionally, of these five cancerous regions, three were in patients whose other biopsies showed no cancer; thus, cancer detection was only achieved through the use of elastography. For elastography, the reported sensitivity and specificity for PCa were 51 and 83 %, respectively [23].
In 2007 Nelson et al. studied targeting biopsies using TRUS, color Doppler, and elastography in addition to the traditional sextant biopsy. The authors concluded that color Doppler and elastography both improve cancer detection, but that the detection is not sufficient to replace the standard sextant biopsy. Additionally, the authors demonstrated that cancer detection in gray-scale ultrasound, color Doppler, and elastography images are all correlated with Gleason score [1].
Kamoi et al. studied 107 patients using both power Doppler ultrasound and elastography, indicating that elastographic strain imaging had 68 % sensitivity and 81 % specificity for PCa. The authors reported that elastography was more successful at detection of high Gleason score tumors, with 100 % of the tumors with a Gleason score 8 being detected. The authors indicated that their primary difficulty with elastography was the image quality variability between users due to the user-dependent nature of compression [3].
Although the previous studies used both Doppler ultrasound and strain imaging, other groups have evaluated strain imaging exclusively. A 311 patient study by Miyagawa et al. reported a 90 % diagnostic sensitivity for PCa using the combination of TRUS and elastography. The authors reported that elastography was most successful in detecting cancer in the anterior prostate. They also noted that the sensitivity of elastography decreased as prostate volume increased, which they attributed to the confounding effects of BPH [24].
The observation that the diagnostic utility of elastography differs in various regions of the prostate was expanded upon by Tsutsumi et al. The authors divided the prostate into three regions, anterior, middle, and posterior and analyzed the utility of elastography for PCa detection. While elastography improved cancer detection in all regions of the prostate, the largest benefit was seen with anterior tumors, with decreasing improvement for middle and posterior tumors [29].
Pallwein et al. studied 492 patients, who had elastograms of the prostate recorded prior to receiving a systematic 10 core biopsy. The urologist performing the biopsy was blinded to the results of the elastography study. The authors found a whole organ sensitivity of 86 % and specificity of 72 % in the retrospective analysis of suspicious regions in the elastograms. Cancer detection in the basal region was compromised due to a high false positive rate associated with chronic inflammation and atrophy. A representative series of elastograms is reproduced from their work in Fig. 2 [5].
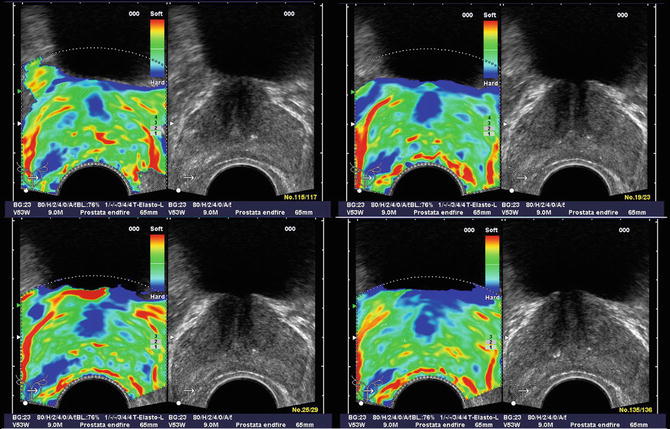
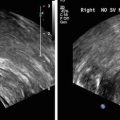
Fig. 2
Patient (picture series) with histologically confirmed prostate cancer in the right mid-gland of prostate. The elastographic examination showed a well-defined lesion with low strain (dark blue, patient right, peripheral zone near bottom of images). The peripheral zone on the patient left side showed normal stiffness. Figure reproduced with permission [5]
Kapoor et al. performed a 50 patient study specifically focused on determining the utility of elastography in targeting biopsies. The authors reported the sensitivity and specificity of 91.7 and 86.8 %, respectively, as compared to their reported sensitivity and specificity of TRUS at 16.7 and 89 %, respectively. They noted that the primary challenges in using elastography are the inability to differentiate between cancer and prostatitis, very large prostates, and lack of operator experience [31].
Salomon et al. studied prostate elastography in 109 patients undergoing radical prostatectomy, in which the preoperative elastography data was correlated with whole-mount histology data. The authors reported 75 % sensitivity and 77 % specificity for elastography. The authors found that elastography detection of PCa was positively correlated with Gleason score [28].
One of the common challenges reported for strain imaging of the prostate is achieving uniform compression of the organ. To address this challenge, Tsutsumi et al. inflated a water balloon surrounding the transducer to compress the tissue, which reduced the operator dependence of the image quality. Using this method, the authors detected 71 % of histology confirmed PCa lesions [32].
Overall, the multitude of studies performed using strain imaging has demonstrated great promise for guidance of targeted biopsies. The primary benefits have been reported for detecting PCa in the peripheral zone, where approximately 80 % of cancers are located [25]. Although the studies have demonstrated higher sensitivity than with TRUS alone, challenges have also been identified. The studies using free hand compression noted that an experienced operator was needed to obtain high-quality images. Additionally, many studies demonstrated a high false positive rate due to the confounding effects of BPH, which looks similar to cancer in strain images. Finally, the studies determined that targeted biopsies are not sufficient and that standard sextant or 10-core biopsies are necessary in addition to elastography targeted biopsies.
Related posts:

Stay updated, free articles. Join our Telegram channel

Full access? Get Clinical Tree


