Chapter 8
Dynamics of the HPA Axis: A Systems Modeling Approach
John R. Terry, Jamie J. Walker, Francesca Spiga and Stafford L. Lightman
College of Engineering, Mathematics and Physical Sciences*, University of Exeter, Exeter, UK
Henry Wellcome Laboratories for Integrative Neuroscience and Endocrinology*, University of Bristol, Whitson Street, Bristol, UK
Denotes equal contribution
8.1 Introduction
Physical or psychological stress activates autonomic and neuroendocrine pathways leading to downstream physiological processes that enable a rapid and effective response to the threat. This is known as the classic “fight or flight” response and puts the organism in an optimal situation to cope with any challenge to its internal or external environment. One of the most important systems controlling the stress response is the hypothalamic-pituitary-adrenal (HPA) axis, a vital neuroendocrine system that regulates the release of glucocorticoid hormones (cortisol in man, corticosterone in rodents – CORT) from the adrenal glands. Stress-induced changes in circulating CORT levels are a critical component of the body’s response to internal or environmental stress, and are important for maintaining homeostasis within the body via regulation of neural, metabolic, immunological, and cardiovascular activity.
At the level of the brain, CORT secretion is controlled by the activity of a small cluster of neurons whose cell bodies lie within the paraventricular nucleus (PVN) of the hypothalamus (Figure 8.1). The PVN is a highly responsive structure that can detect cognitive or emotional stressors from limbic areas of the central nervous system, such as the amygdala and hippocampus, as well as more physical stressors, such as inflammation or hypotension from brain stem structures (Ulrich-Lai and Herman, 2009). The PVN also receives a major input from the suprachiasmatic nucleus (SCN) of the hypothalamus, which receives light/dark information from the retinohypothalamic tract and thereby coordinates the circadian (i.e., daily) activity of the organism (Reppert and Weaver, 2002).
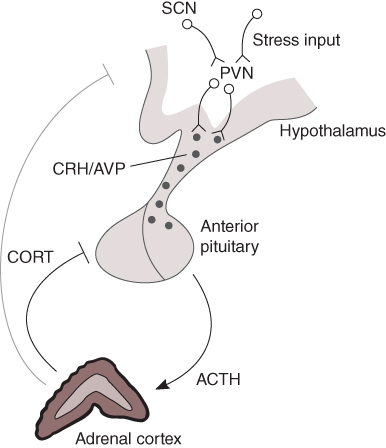
Figure 8.1 The hypothalamic–pituitary–adrenal (HPA) axis. The hypothalamic paraventricular nucleus (PVN) receives homeostatic/stress inputs from the brainstem and from regions of the limbic system such as the hippocampus and amygdala, as well as a circadian input from the suprachiasmatic nucleus (SCN). The PVN projects to the median eminence where it releases corticotrophin-releasing hormone (CRH) and arginine vasopressin (AVP) into the hypothalamic–pituitary portal circulation. CRH and AVP pass through this vascular route to access corticotroph cells in the anterior pituitary, which respond with the rapid release of adrenocorticotrophic hormone (ACTH) from pre-formed vesicles into the general circulation. In turn, ACTH reaches the adrenal cortex where it activates the synthesis and secretion of glucocorticoid hormones (CORT). CORT feeds back directly on the anterior pituitary to inhibit ACTH secretion, as well as acting at higher centres in the brain, including the hypothalamus and hippocampus.
A subpopulation of neurons within the PVN, the parvocellular neurosecretory cells, projects to the median eminence at the base of the hypothalamus from where they release the peptide hormones, corticotrophin-releasing hormone (CRH) and arginine vasopressin (AVP), into the hypophyseal portal system (Ixart et al., 1991). CRH and AVP flow along this vascular route to reach the anterior lobes of the pituitary gland. The anterior pituitary contains a number of different specialized cell types that release specific hormones important for the regulation of many aspects of physiology, including reproduction, growth, metabolism, and the physiological response to stress. Approximately 10 of the anterior pituitary is made up of corticotroph cells, which respond to CRH and AVP by releasing the peptide adrenocorticotrophic hormone (ACTH) into the systemic circulation. This is an extremely rapid process – corticotroph cells store newly synthesized ACTH at high concentration in readily releasable secretory vesicles at the cell membrane, which are rapidly released in response to hypothalamic stimulation. When ACTH reaches the adrenal glands, it activates its specific receptor at the membrane of cells within the zona fasciculata of the adrenal cortex, which, in turn, leads to the synthesis and secretion of CORT. Like all steroid hormones, CORT is fat-soluble and can therefore freely exit the adrenocortical cells by diffusion across the plasma membrane (a phospholipid bilayer). In contrast to peptide hormones (e.g., CRH, AVP, and ACTH), this means that CORT cannot be pre-synthesized and stored within the cell, but requires de novo synthesis in response to ACTH stimulation.
Once released from the adrenal glands, CORT travels through the blood to access target tissues, such as the liver (to increase fuel release into the blood), the heart and vascular tissues (to increase blood supply to vital organs), and the brain (to promote cognitive processes necessary to cope with a threatening situation). CORT also regulates the activity of the HPA axis, and thus its own production, by feeding back in a negative manner, most significantly on the pituitary gland, but also on the PVN and other brain structures that influence the activity of the PVN, such as the hippocampus, where specific receptors responsive to CORT – glucocorticoid receptors (GR) and mineralocorticoid receptors (MR) – are expressed.
Besides the robust activation in response to stress, the HPA axis is also characterized by basal rhythms of activity. In man, levels of CORT are high in the early morning (increasing levels of glucose in the blood to prepare the body for daily activity), and low in the evening during the sleep period. In rodents, which are nocturnal animals, this daily or circadian rhythm of hormone secretion is reversed – CORT is high during the night (the rodent’s active phase) and low in the morning when they are resting. Rather than following a circadian profile that varies smoothly over the course of the day, CORT actually displays a much more dynamic pattern of pulsatile hormone release that occurs with a characteristic ultradian frequency of approximately one pulse per hour (Figure 8.2). It is, in fact, the amplitude of the CORT pulses that varies in a circadian manner.
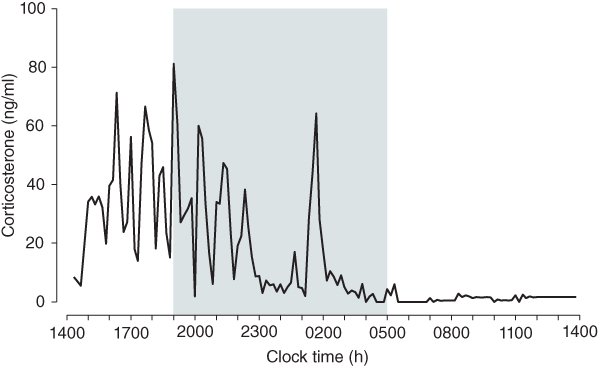
Figure 8.2 Circadian and ultradian CORT rhythms in the rat. CORT was measured in blood samples collected at 10 min intervals from a freely behaving male Sprague–Dawley rat. Shaded region indicates the dark phase. Data adapted from Walker et al. (2012).
In mammals, pulses of CORT induce pulses of gene transcription in target tissues (Conway-Campbell et al., 2010; Stavreva et al., 2009), suggesting that systems have evolved to use ultradian CORT rhythms to optimize the body’s response to its environmental influences and to maintain normal internal regulatory processes. The effect of these rhythms is profound at molecular, physiological, and behavioral levels. Indeed, in the rat, oscillating levels of CORT are necessary for normal neurochemical and behavioral responses to stress (Sarabdjitsingh et al., 2010). Moreover, CORT oscillations become disrupted under a number of different physiological and pathological conditions (Lightman and Conway-Campbell, 2010). It is therefore vital to elucidate the mechanisms underlying these rhythms, not only to understand normal physiological function, but also to understand why they change in disease and how these changes cause or protect us from pathological consequences.
The origin of the circadian rhythm of CORT has been clearly associated with the SCN (Moore and Eichler, 1972), but the mechanisms governing the ultradian pulsatile dynamics of the system remain poorly understood. It has recently been shown that, while the circadian CORT rhythm disappears following lesioning of the SCN, the ultradian pulsatile pattern of CORT is maintained, suggesting that it is generated independently of SCN regulation (Waite et al., 2012). Classically, it has been presumed that ultradian pulsatile CORT release is a consequence of neural signaling to the anterior pituitary encoding a dynamic pulsatile pattern of hypothalamic peptides (i.e., CRH and AVP) into the hypophyseal portal system. Although measuring levels of hypothalamic peptides in portal blood are extremely challenging, there have been a small number of studies in the freely behaving rat where, by using push–pull perfusion, it has been shown that CRH levels in the median eminence display irregular pulsatile dynamics with an approximate frequency of three pulses per hour (Ixart et al., 1991). The frequency of CRH pulsing does not appear to vary significantly over the 24-hour period, but the mean levels of CRH secreted are significantly different – evening concentrations are nearly twice as high as those in the morning (Ixart et al., 1993). The origin of this pulsatile activity in CRH is not known, but there is some in vitro data from the Macaque showing that hypothalamic explants release CRH in an episodic manner, suggesting that the anatomical basis for CRH pulse generation lies within the hypothalamus itself (Mershon et al., 1992).
It may seem natural to assume that these pulses of CRH secretion are the primary mechanism driving the downstream ultradian oscillations in ACTH and CORT. If this was the case, we would expect the frequency of ACTH and CORT pulses to follow that of CRH. However, the available data show a slower temporal scale of near-hourly ACTH and CORT oscillations compared to the 20-min pulsing of CRH (Walker et al., 2010b). In light of this mismatch in frequency, alternative mechanisms for these slower ultradian oscillations in ACTH and CORT clearly require further investigation, and the purpose of this chapter is to describe how integrative modeling and experimental studies have advanced our understanding ofthese mechanisms.
8.2 Mathematically modeling the HPA axis
Systems approaches to modeling hypothalamic–pituitary neuroendocrine pathways that incorporate negative feedback have been evolving since at least the early 1990s when Liu and Peng (1990) proposed a mathematical model of the hypothalamic–pituitary–thyroid (HPT) axis. Their initial model was based upon the principles of Michaelis–Menten kinetics (principles which govern most of the subsequently described approaches) and characterized the HPT axis at the steady state. This model was subsequently extended to incorporate the “auto regulation” of thyrotrophin-releasing hormone (TRH) (Li et al., 1995), and this fast feedback process was shown to be sufficient to account for the pulsatile activity of the system observed experimentally. The group then extended this approach to study the HPA axis, where they included equations describing CRH, ACTH, and CORT (Liu et al., 1999). The model included a negative feedback mechanism, mediated by levels of CORT on ACTH and CRH, which was shown to give rise to oscillatory behavior as a consequence of Hopf bifurcation.
An alternative model describing fluctuating levels of CRH, AVP, ACTH, and CORT, incorporating a logistic function to mimic the dose-responsive behavior of CORT feedback, has been proposed by Keenan et al. (2001). The authors hypothesize a hypothalamic pulse generator, whereby pulses of CRH and AVP (considered as a combined feedforward signal) drive the pulsatile secretion of ACTH and CORT following a short time delay. This model is significant as it considers the role of negative feedback mediated by CORT in regulating pulsatile hormone secretion in the HPA axis. However, the mechanism governing oscillatory behavior in this model is a hypothalamic pulse generator, rather than system-level CORT feedback.
More recent mathematical work has focused on building more biologically realistic models and using them to gain an insight into disease processes characterized by altered HPA dynamics. For example, Gupta et al. (2007) constructed a model of the HPA axis that takes into account the role of GR in mediating CORT negative feedback at the level of the pituitary. They found that this process results in the existence of two simultaneously stable concentrations of GR (low and high), which in turn result in two altered levels of CORT, and they discuss the possible relationship between these altered steady-state values and stress-related disease. This approach has in turn led to other studies that attempt to relate disruptions in HPA axis function to post-traumatic stress disorder (PTSD) (Ben-Zvi et al., 2009, Sriram et al., 2012). The first of these studies postulates that model-based control may be used to perturb the HPA axis from a state of abnormal CORT secretion back to a state corresponding to normal CORT levels. The more recent study by Sriram et al. (2012) discusses how positive feedback in the model developed by Gupta et al. (2007) leads to the previously described bistability. They proceed to describe the interplay between increases in negative feedback and transitions in a dynamic structure that they relate to clinical measurements of CORT in patients.
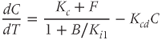
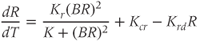
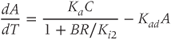
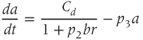
While both of the above studies incorporate increasing levels of biological plausibility in their models, they do not discuss the known ultradian pulsatility of both ACTH and CORT. In the models discussed above that do focus on ultradian activity in the HPA axis, the model output does not entirely concur with data – specifically, the output of these models shows CRH, ACTH, and CORT oscillations that are phase locked in all hormones and (in some cases) occur with a non physiological frequency. Thus, our objective for building a mathematical model is to identify candidate mechanisms that could underpin the emergence of ultradian activity in the system and that are consistent with the experimentally observed dynamics of CRH, ACTH, and CORT, as described above (Walker et al., 2010a). Our starting point is the model of Gupta et al. (2007), a qualitative model that provides a reasonable balance between biological plausibility and analytical tractability. This model has four variables, the dynamics of which are described by four ordinary differential equations (ODEs):


Based on reaction kinetics, these equations describe hormone signaling between the three anatomical components of the HPA axis. The variables  ,
,  and
and  represent concentration levels of CRH, ACTH, and CORT, respectively. The variable
  represents a receptor for CORT in the anterior pituitary. Each equation expresses the rate of change in the concentration of a variable
  as the difference between a synthesis/production term and a degradation/clearance term. Moreover, a constant independent basal production term is included for
  in the anterior pituitary.
  and
and  are time-varying parameters that represent circadian and stress inputs to stimulate CRH release from the hypothalamus. Parameters
  ,
,  ,
,  , and
, and  are the degradation parameters for
  ,
,  ,
,  , and
, and  , respectively. The model assumes that the degradation rate of each variable is not actively regulated by any other variable of the system, and that it is purely determined by its half-life, which in the case of ACTH and CORT can be estimated from experimental data. In this model developed by Gupta et al. (2007), the inhibition by circulating CORT acts at the level of both CRH production (first term of Equation (8.1)) and, via interactions with its receptor, ACTH production (first term of Equation (8.2)).
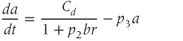
In light of experimental observations of a frequency mismatch between pulsatile CRH secretion ( 3 pulses per hour) and ACTH/CORT (
 1 pulse per hour), in deriving our model we make the key assumption that CORT negative feedback at the hypothalamus is not an important factor in regulating the basal dynamic activity of the system. That is, we assume that the primary regulator of the basal dynamics is CORT-mediated negative feedback at the level of the anterior pituitary, and we, therefore, treat hypothalamic CRH drive on the pituitary as a parameter of the system, rather than a variable. This assumption results in a system that is essentially an excitatory–inhibitory loop consisting of the pituitary and adrenal components, which undergoes external forcing from hypothalamic CRH (
 ):
):

We non dimensionalize this system of equations using a (non unique) coordinate transformation, which gives rise to the dimensionless form
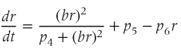
Here,  ,
,  , and
, and  are dimensionless representations of the original variables
  ,
,  , and
, and  , respectively, and the new parameters
  and
and  are dimensionless combinations of the original parameters that are defined as follows:


The dimensionless parameter  represents the level of “hypothalamic drive” on the anterior pituitary – we do not attempt to distinguish between a gain mediated by CRH or AVP, and instead, without loss of generality, lump both of these together.
A further significant change from the model described by Gupta et al. (2007) reflects the disparate nature of the mechanisms of synthesis and release of ACTH and CORT. In corticotroph cells of the anterior pituitary, ACTH is pre-synthesized and stored at high concentration in secretory vesicles in readily releasable pools docked to the cell membrane (Kelly, 1985). Hence, ACTH is rapidly (i.e., within seconds) released from these pre-formed vesicles into the general circulation in response to CRH activation. In contrast, in adrenocortical cells, CORT is only synthesized following stimulation by ACTH, after which it is passively released into the general circulation (Stocco and Clark, 1996). Crucially, this steroid synthesis stage results in a time delay of a few minutes in ACTH-induced CORT secretion from the adrenal cortex (Papaikonomou, 1977). Within our model, we take this slow process in the adrenal cortex into account by including a delay term in the equation for CORT, which leads to the following system of delay differential equations (DDEs):
The final equation expresses the rate of change of CORT as a function of ACTH concentration at some fixed time ( ) earlier (dimensionless units). While incorporating a delay to account for the production time of CORT makes theoretical analysis more challenging, it does have the advantage of minimizing the number of additional equations and (unknown) parameters in the model that would be necessary to account explicitly for the multiple steps involved in steroidogenesis.
As a deterministic (i.e., nonstochastic) system, the dynamics of Equations (8.17)–(8.19) are governed entirely by the model parameters (and the time delay). For reproducibility, the dimensionless parameter values used in our analysis are provided in Table 8.1. Of these, only  may be thought of as a time-varying parameter as it corresponds to CRH drive on the anterior pituitary. The remaining parameters are assumed to remain constant (at least over the ultradian timescale of interest) for any individual, although there could quite conceivably be a degree of inter-individual variation. Whilst it is not possible to estimate all of the model parameters from data, good approximations are possible for some, which enables a more systematic analysis of model dynamics. In particular, the half-lives of ACTH and CORT in the blood have been reported in experimental studies. In the rat, the half-life of ACTH (
 ) has been estimated to be approximately 1 min (Sydnor and Sayers, 1953), and similarly, the half-life of CORT in the rat (
 ) has been estimated to lie in the range 7.2–10 min (Windle et al., 1998a).
Table 8.1 Dimensionless parameter values for the model
| Parameter | Value | Description |
 | Free | CRH drive |
 | 15 | Relates to inhibition of ACTH by CORT |
 | 7.2 | Ratio of decay rates between ACTH and CORT |
 | 0.05 | Relates to regulation of  by CORT by CORT |
 | 0.11 | Basal production of  in anterior pituitary in anterior pituitary |
 | 2.9 | Ratio of decay rates between  and CORT and CORT |
 | Free | Delay in ACTH-induced CORT release |
Referring back to Equation (8.5), in the absence of hypothalamic drive (i.e., when  ), ACTH will decay exponentially at a rate determined by the parameter
  . This decay constant for ACTH is given by

Related posts:
 Modeling Endocrine Cell Network Topology
Stay updated, free articles. Join our Telegram channel

Full access? Get Clinical Tree


