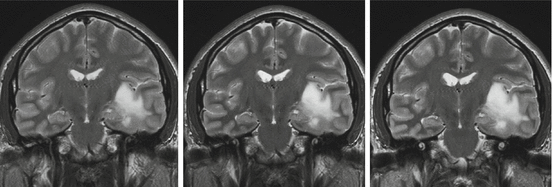
Fig. 16.1
Illustrative case of pre- versus post-operative growth rates. Note that one can estimate the oncological gain of surgery: the re-evolution curve is translated by about 6 years. Note also the evolution of radiological phenotype, from bulky preoperatively to diffuse postoperatively
Several reports have also illustrated that the shape of DLGG on MRI is imposed by the architecture of white matter fiber tracts. It is indeed well known that projection or association pathways constitute a major road of tumor cells invasion for high grade glioma [27, 28, 37]. For DLGG, a similarity between the tumor shape and the anatomical description of fiber tracts has been reported [38, 39]: in particular, insular/paralimbic tumors may extend along the uncinate fasicuclus, the arcuate fasciculus and/or the inferior fronto-occipital fasiculus (IFOF) as well as the sagittal stratum (corresponding to the merging of IFOF and optic tracts).
Moreover, a longitudinal radiological study demonstrated on a series of 16 patients the preferential extension along these tracts [39], as it has been also confirmed by computational simulations based on a biomathematical model of tumor growth [40]. Of note, if it is clear that white matter pathways can facilitate tumor cells invasion within a tract, one could also imagine that the interface between two orthogonal pathways acts as a barrier against cells invasion. This phenomena has been less investigated in the literature.
Quantitative Follow-Up
The old belief that DLGG may alternate indolent and growing periods is still alive, although not supported by any relevant studies. A probable explanation is that a minor increase of tumor diameter is difficult to identify just by “eyeball” qualitative comparison of two consecutive MRI (see Fig. 16.2). Tumor diameter can be measured by different techniques, either with linear measurements of one, two or three diameters, or it can be deduced from a full 3D volumetric segmentation. It has been clearly evidenced that estimating tumor size by segmenting (manually or semi-automatically) each axial slice on a computer reduces greatly the intra- and inter-reader variability [41]. Indeed, as stated in [42]: “DLGG are often irregular in shape and grow anisotropically, resulting in poor reproducibility of area or volume estimation based on linear measurements.” Moreover, a recent study reported that 3D volumetric segmentation are much less sensitive to head position in the MRI than 2D diameters [43]. The increasing availability of softwares allowing to perform segmentations on DICOM images (be they on dedicated stations in neuroradiology and radiotherapy department, in neuronavigations systems or even on PC—for e.g., Osirix, ImageJ,…) renders any other technique based on one, two or three diameters measurements oldfashioned [43]. Segmented volumes are then converted in diameters, by computing a volumetry-based diameter (d V ):


Fig. 16.2
Eyeball versus quantitative estimation of growth. From left to right, three successive MRIs of the same patient, each separated by 9 months. Whereas growth is difficult to assess visually on two successive exams, quantitative measurements by full 3D segmentation reveal a 4 mm/year growth rates
Finally, the growth curve of this equivalent diameter can be plotted over time and the growth rate of the radiological diameter dV, can be estimated for each patient from a simple linear regression, giving the Velocity of Diametric Expansion (VDE).
This methodology allowed to prove that DLGG are not radiologically stable. Mandonnet et al. [15] first showed quantitatively the spontaneous radiological growth of DLGG on successive MRIs in a subset of 27 histologically proven DLGG that were followed before oncological treatment. The average VDE was close to 4 mm/year, with a minimum at 2 mm/year. These initial results were confirmed by the same group on a larger series of 143 histologically proven DLGG, that ranged individual VDE from 1 to 36 mm/year [16], with a median VDE at 4.4 mm/year. In the series of Ricard et al. [17], the 39 patients with an available follow-up before chemotherapy also had a median VDE of 4.4 mm/year. Several independent groups have recently confirmed these results in series of patients harboring histologically proven supratentorial DLGG, as summarized in Table 16.1:
Brasil Caseiras et al. [18] found that all patients exhibited a volume increase over a 6-month period (minimum of 1.9 mL) in a series of 34 patients. However, this group did not convert their volumic growth rates in terms of VDE, precluding to make any comparison with other series,
Hlaihel et al. [19] reported a median VDE of 3.5 mm/year in a series of 21 patients,
Peyre et al. [20] measured a minimal VDE of 2.2 mm/year in a subseries of 13 patients with an available follow-up before chemotherapy, with an average VDE at 5.5 mm/year,
Pallud et al. [32] found that all of the eight studied DLGG with pre-treatment imaging follow-up experienced an increase of their diameter, the minimal VDE being at 1.1 mm/year, with a median value at 3.3 mm/year. The same group reported, on another series of 19 patients, a median VDE of 4.5 mm/year, with a minimal value of 0.6 mm/year [23],
Goze et al. also reported a median VDE of 3.5 mm/year in a series of 64 patients [22], and more recently a median VDE of 3.75 mm/year in a series of 131 patients [24]. In these series, it seems that at least one patient presented a null VDE, but this could be due to the very short follow-up (median of 0.8 years, with a minimum of 0.25 years).
Table 16.1
Distribution of the velocity of diametric expansion in series of patients harboring a LGG, as reported by different groups
Authors | Cases (n) | Median VDE (mm/year) | Range (mm/year) | Median follow-up (years) |
|---|---|---|---|---|
Mandonnet et al. 2003 [15] | 27 | 4.1 | 2–8 | 4.75 |
Pallud et al. 2006 [16] | 143 | 4.4 | 1–36 | 1.8 |
Ricard et al. 2007 [17] | 39 | 4.76 | – | 3.6 |
Brasil-Caseiras et al. 2009 [18] | 34 | Volumic increase | 0.5 | |
Hlaihel et al. 2010 [19] | 21 | 3.65 | – | 1.9 |
Peyre et al. 2010 [20] | 13 | 5.5 | 2.2–21.4 | – |
Pallud et al. 2010 [21] | 8 | 3.3 | 1.1–3.7 | – |
Goze et al. 2012 [22] | 64 | 3.5 | 0–24.3 | 0.8 |
Pallud et al. 2012 [23] | 19 | 4.5 | 0.6–16.9 | 0.7 |
Goze et al. 2014 [24] | 131 | 3.75 | 0–31.0 | 0.8 |
Finally, as already stated, two studies have evidenced a continuous growth of diameter in series of incidentally discovered DLGG:
Thus, these quantitative studies never reported a case of an indolent untreated DLGG with a stable tumor volume and a null VDE or a case of an untreated DLGG alternating indolent and growing periods. In summary, DLGG present a systematic, spontaneous and continuous radiological growth (although sometimes as slow as 1 mm/year), before any transformation into a higher grade of malignancy.
16.1.3.3 The Transition Towards Higher-Grade
The transition towards a glioma of higher grade is a somehow unforseeable event, albeit unavoidable, in the natural history of a DLGG. It has been well proven that the greater the initial tumor volume (or its residue after surgery), the higher the risk of imminent anaplastic transformation. Whereas the reference definition of anaplastic transformation is based on the histological criteria of a grade III or IV glioma, it is now widely admitted that it can be also diagnosed by the appearance in the longitudinal follow-up of a new contrast-enhanced nodule on T1-gado MRI.
Several studies have shown that VDE greater than 8 mm/year on initial follow-up is highly suggestive of an imminent malignant transformation [16, 18, 24, 44]. However, for DLGG with an initial growth rate at 4 mm/year, it has never been shown whether malignant progression is preceded by an increase of the growth rate or not. This point will be further discussed in the chapter on biomathematical modeling. Advances in modern imaging methods,2 including perfusion MRI and spectroscopic MRI, when performed at initial diagnosis, can yield valuable data regarding the anaplastic risk of an individual tumor [45], as detailed in the previous chapters (see Chap. 14). The aim of this paragraph is to put these results in a dynamic perspective and to emphasize what additional information can be gained from a longitudinal application of these techniques.
Perfusion MRI
Several studies have shown the interest of the value of rCBV max at the initial perfusion-weighted MRI in predicting malignant transformation or even overall survival. All studies evidenced a threshold value in the range 1.7–2.2 [46–49]. However, on an individual basis, the prognostic value is limited by the fact that oligodendroglioma exhibits a greater rCBV max than astrocytoma [50–52]. One longitudinal study proved that an annual rate of rCBV max increase greater than 2/year is predictive for the appearance of contrast-enhancement within the next 6–12 months [46]. Thus, a high value and/or a rapid increase of rCBV max precede by 6–12 months the onset of contrast-enhancement.
Metabolic MRI
The advent of spectroscopic MRI enabled to measure non-invasively the concentrations of some molecules of metabolic interest, offering to track metabolic changes sustaining the transition towards malignancy. For example, it has been clearly shown that the choline levels correlates with increased cellular density and proliferation rate [53, 54]. To our knowledge, there are very few studies in the literature analyzing longitudinal datasets of spectroscopic MRIs for DLGG patients. Whereas for treated patients spectroscopic data seem to amplify the volumetric evolution [19, 55], studies in untreated patients provided diverging results regarding the possibility to predict anaplastic transformation (see [45] for a review). This can be explained by methodological limitations, like the variability of the spatial location of the ROI in the monovoxel technique [56]—a limitation that should be overcomed by the multivoxels technique [54]. An alternative explanation will be proposed in the chapter on biomathematical modeling.
With the discovery of high frequency of IDH mutations in oligodendroglioma, there has been a regain of interest for the study of glycolysis and oxydative phosphorylation in tumorogenesis. The lactate resonance is supposed to be a surrogate marker of a glycolytic switch, decoupling the glycolysis from oxydative phosphorylation in the tricarboxylic cycle [57]. Not surprisingly, no lactate resonance is observed for DLGG with a proliferation index inferior to 4%, whereas a lactate peak is detected when proliferation index is comprised between 4% and 8% [58]. Interestingly, the lactate resonance is no more evidenced for tumors with a proliferative index greater than 8%. As explained by a mathematical model [59–61], this could be linked to the combined effect of MCT overexpression (excreting lactate out of the cells) and increased cerebral blood flow, washing out the lactate through the capillaries. An alternative explanation would come from the theory of metabolic symbionts [57]: the lactate produced by glycolysis in hypoxic cells would be “recycled” by normoxic cells, through the transformation in pyruvate (then entering the tricarbonic acid cycle for oxidative phosphorylation). Hence, one should keep in mind a dynamic view of the tumoral metabolism when analyzing the lactate peak on spectroscopic MRI.
16.1.4 The Cognitive Follow-Up
A striking feature of DLGG patients is that they do not have any focal neurological deficit. This means that brain networks plasticity can cope with lesions growing up to 4 mm/year, without any major consequence on motor or language function. However, studies with extensive assessment of cognitive status have evidenced that healthy controls scored better than DLGG patients [62]. This holds true even in patients with incidental DLGG [63]. Hence, it can be suspected that the decline in cognitive status of DLGG patients is a continuous process during the silent and low-grade period, as for the MRI evolution. However, very few studies have focused on the longitudinal cognitive follow-up of “wait and see” cohorts. Indeed, only one longitudinal study has been published, showing a worsening in non verbal delay recall scores after a one year “wait and see” follow-up [64]. Of course, at malignant transformation, the brain plasticity capabilities are overwhelmed by the fast growing tumor (VDE greater than 8 mm/year). At that time, focal neurological deficits, together with an increased seizures frequency, are commonly observed. All together, one can assume that the tumoral dynamics (as measured by the VDE) should be correlated with the dynamics of cognitive deterioration: the higher the tumor growth rate, the faster the cognitive deterioration. This hypothesis would deserve more clinical studies.
16.2 Factors Influencing DLGG Growth Rates
First of all, the different DLGG histological subtypes (oligodendroglioma, astrocytoma, mixed glioma) do not exhibit significant differences regarding the radiological tumor growth rates, as previously demonstrated in several studies [16–18, 65].
Three studies have investigated the link between DLGG genetic subtypes. In the first one [17], it was shown that DLGG with 1p-19q codeletion grew significantly slower than DLGG without (median VDE at 3.4 mm/year), and that DLGG with immunohistochemical overexpression of p53 grew significantly faster than DLGG without (median VDE at 4.2 mm/year). The second study [22] confirmed that growth rates of DLGG are lower when 1p-19q codeletion is present, whereas IDH status does not influence growth rates, a result which has been confirmed recently by a third study on a larger cohort [24]. This suggests that the favorable outcome of 1p-19q codeleted patients might be in part related to a tumor inherently more indolent, and that on the contrary, the good prognostic value of IDH mutation could result from a better efficacy of treatments or a lesser risk of malignant progression.
Only one study investigated quantitatively the effects of pregnancy on the radiological growth rates of DLGG [66, 67]. The results showed that DLGG accelerated significantly their radiological growth rates during pregnancy, above levels detected either before pregnancy or after delivery in 75% of cases. These changes in tumor growth were associated with an increase in seizure frequency in 40% of cases and radiological and clinical changes during pregnancy motivated further oncological treatment after delivery in 25% of cases. These results also underline that young women with DLGG should be informed of the oncogenic role of pregnancy (see Chap. 30).
16.3 The Prognostic Value of Pretreatment VDE
The first study focusing on the prognostic significance of spontaneous MRI growth rates on overall survival was conducted on a retrospective series of 143 DLGG with measurements of the evolution of the diameter over time [16]. Overall survival was significantly higher in the low growth rates subgroup (median survival of 15 years for a VDE lower than 8 mm/year) than in the high growth rates subgroup (median survival of 5.6 years for a VDE at 8 mm/year or more).
The prognostic significance of spontaneous MRI growth rates on predicting progression into a higher grade of malignancy was addressed in two recent prospective studies. Brasil Caseiras et al. [18] proved in a series of 34 patients that “tumor growth within 6 months was better than baseline volumes, relative cerebral blood volume, or apparent diffusion coefficient in predicting time to malignant transformation in untreated DLGGs and was independent of other parameters”. They found a threshold of 6.21 mL of growth within 6 months, with a mean time of progression of 3.91 years versus 1.82 years. However, the prognostic significance of the evolution of the tumor volume (and not diameter) over time may be a combination of two independent other prognostic factors, the initial tumor volume and the tumor growth rate [68]. Or stated differently, the same amount of volumic increase may correspond to a large tumor with a low growth rate (of diameter) or a small tumor with a high growth rate (of diameter) [68]. Thus, VDE, obtained by the evolution over time of the diameter (deduced from the total segmented volume V) appears as a more reliable parameter than the evolution of the tumor volume to assess selectively the prognostic significance of radiological tumor growth rates.
Hlaihel et al. confirmed these results and demonstrated that an elevated VDE higher than 3 mm/year was correlated with a greater risk of progression into a higher grade of malignancy, with an average VDE at 7.87 mm/year in transformers group versus an average VDE at 2.14 mm/year in non transformers group [19]. The VDE threshold at about 8 mm/year is thus as a strong predictor of both malignant progression-free and overall survivals.
16.4 Assessing Treatment Efficacy by Volumetry-Based Diameter Measurements: When Patients Can Serve as Their Own Controls
As DLGG are slow growing progressive tumors, with considerable variability in patient characteristics and therapeutic modalities, the accurate evaluation of the different oncological treatments efficacy constitutes a clinical challenge. Along with clinical response—particularly on seizure frequency—we will show that the quantitative assessment of the individual VDE by diameter evolution over time on consecutive MRI is a useful adjunct in the follow-up armamentarium.
16.4.1 Surgery
Using the VDE methodology, it has been shown in a retrospective study of 54 DLGG patients that radiological tumor growth rates remain unchanged after surgical resection [65] (see Fig. 16.1 for a typical case). This result reinforces the idea that the survival benefit of surgery is mediated by a cytoreductive effect, as already stated by several studies [69–73].
However, 2 patients of the 54 under study exhibited a decrease of their tumor growth rates greater than 3 mm/year whereas in 2 other patients, surgery failed to stop an ongoing anaplastic transformation, resulting in an increase of 3 mm/year on the tumor post-operative growth rates [65]. Thus, the precise quantitative assessment of VDE obtained pre and post-operatively by repeated measurements of the diameter would help analyzing the effects of surgical resection on an individual basis and should allow guiding the decision making of a postoperative oncological treatment.
Of note, these results highlight the inadequacy of progression free survival as an endpoint in DLGG clinical trial. Indeed, this notion is ill defined after surgery, as there is no progression free period in patients exhibiting a residual tumor after an incomplete resection.
16.4.2 Chemotherapy
Similarly, the tumor response to chemotherapy can be demonstrated quantitatively by tracking the diameter evolution. Ricard et al. [17] first quantified the tumor response after temozolomide chemotherapy in 107 DLGG. In addition, they evidenced different patterns of response, depending on the 1p-19q codeletion status:
almost all patients exhibited an initial decrease of the diameter after temozolomide onset,
the median VDE after temozolomide onset was −9.2 mm/year,
tumor relapse occurred more frequently and earlier in tumors without 1p-19q codeletion.
A similar study was performed to quantify the tumor response after PCV chemotherapy in 21 DLGG. Peyre et al. [20] demonstrated that:
tumor diameter decreased initially after PCV onset in all patients,
the median diameter decrease after PCV onset was 10.2 mm/year, a value very close to the value reported by Ricard et al. [17] with Temozolomide,
an ongoing diameter decrease in 20 of the 21 patients after PCV discontinuation that was prolonged more than 2 years in 60% of the DLGG under study.
These results demonstrate the same radiological quantitative response following TMZ and PCV chemotherapies. They challenge the idea that a prolonged duration of chemotherapy is necessary for treating DLGGs and raise the possibility of a chemotherapy monitoring based on the quantitative changes of the tumor diameter over time. As a consequence, VDE changes could be used as a quantitative reproducible parameter for the assessment of the response to chemotherapy for DLGG, that is extremely difficult to judge using the Macdonald criteria [74] or the more recent RANO criteria—not based on objective volumetric calculation [42].
16.4.3 Radiotherapy
In a recent study, VDE have been determined after radiation treatment. Pallud et al. studied a consecutive retrospective series of 32 adult supratentorial DLGG treated with first-line radiotherapy with an available imaging follow-up [23]. They demonstrated that:
diameter decreases initially after radiotherapy onset in all patients during a mean 49 months,
Stay updated, free articles. Join our Telegram channel

Full access? Get Clinical Tree


