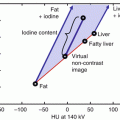
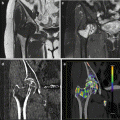
Fig. 2.1
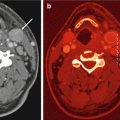
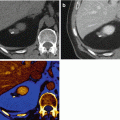
80 kVp (a), Sn140 kVp (b) and weighted average (WA) 120 kVp (c) portal venous phase images of the upper abdomen, demonstrating a low attenuation cystic mass in the uncinate process of the pancreas. Surgical pathology proved intraductal papillary mucinous neoplasm (IPMN). Note that liver parenchyma and liver cortex appear much brighter and sharper on low-energy images. Weighted average images achieved a better balance between contrast and image “softness”
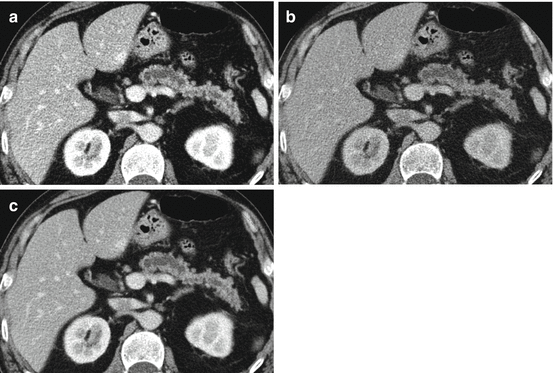
Fig. 2.2
Same case of Fig. 2.1. The dilated main pancreatic duct surrounded by atrophic pancreatic parenchyma is better displayed on the weighted average (WA) 120 kVp (c) compared with the 80 kVp (a) and Sn140 Vp (b) data sets
Linear blending is simply combining the high- and low-energy imaging set with a given linear ratio (e.g. λ = 0.3 means 30 % image information was derived from the low-energy data set whereas the rest 70 % was from the high-energy set). It could be done within minutes on the console [10]. The blending ratio could be set up according to the preference of radiologists in practice but usually is not changed on a case-by-case basis [24].
Another more sophisticated method is to blend the two image sets in a nonlinear fashion. A comparison of several different nonlinear image blending algorithms has shown that moidal blending provides the optimal image characteristics [9]. This approach adopts low-energy data for those areas that show more iodine enhancement, and utilize high-energy data for those image regions that show less or no iodine enhancement. Nonlinear blending is based on a more complicated algorithm and is available only on dedicate postprocessing workstations.
2.2.2 Material Decomposition
Different algorithms were adopted by different vendors for material decomposition with dual-energy CT. With dual-source dual-energy CT (Siemens), a three-material decomposition (default set: iodine, soft tissue, and fat) algorithm was applied, processing data in the image space. The numerical stability of three-material decomposition is partly based on dual-energy ratio of the material composition [11]. For materials with similar dual-energy ratios, this algorithm becomes much less stable [14]. However, it has been proved to work well only when one of the assumed three materials has a very different dual-energy ratio compared to others, such as iodine. To decrease the photon energy overlap at two tube potentials could also increase the stability of material decomposition capability. The second generation dual-source dual-energy CT (Siemens Definition Flash) has accomplished this by adding an extra tin filter to the high energy tube [26].
Single-source fast-kilovoltage switching DECT (GE) adopted a two-material decomposition algorithm in the projection domain. It assumes that the scanned object is composed of two base materials (water and iodine as the default pair). Images acquired at high- and low-energy is postprocessed to generate iodine-based and water-based images, similar to virtual noncontrast (VNC) images and iodine map in its dual-source DECT counterpart (Fig. 2.3). Theoretically, projection-domain decomposition has its unique advantage in that beam-hardening effects could be avoided. However, motion artifact, which may destroy the data consistency between the low- and high-energy data, could degrade image quality with this algorithm.
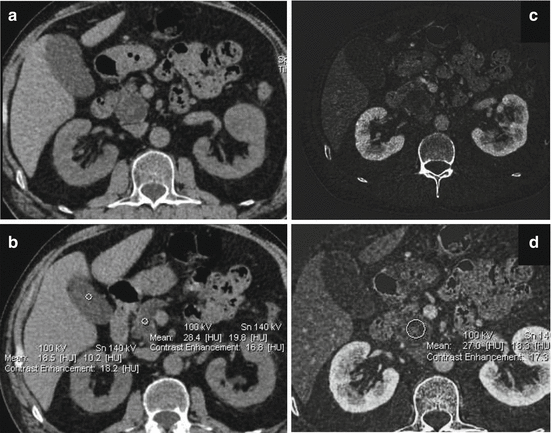

Fig. 2.3
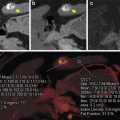
Liver VNC postprocessing software displays virtual noncontrast (VNC) and iodine map side by side. VNC may replace real noncontrast acquisition (a), and attenuation values can be directly measured (b). Iodine map can be used to directly visualize iodine content in the lesion (c), and measure it with a ROI (d). In the iodine map, the details of the lesion can be appreciated more clearly. The low attenuation content within the lesion is iodine free, but the enhancing septa clearly contain iodine on the map (e), well depicting a complex cystic mass with multiple thin septa
2.2.3 Virtual Monochromatic Images
With dual-energy acquisition, the material composition of each voxel of the scanned object could be calculated. With two (or three) known material bases each in a specific fraction, a linear-attenuation coefficient map of each voxel could be generated, at any energy within the diagnostic energy range. Therefore, a dual-energy data set could be postprocessed into a range of virtual monochromatic (VMC) images, with an automatically generated spectral attenuation curve, allowing for selection of the “optimum contrast” or “lowest noise” set for clinical diagnosis.
The most commonly used DECT postprocessing software in oncologic image, which are currently commercially available are summarized in Table. 2.1.
Table 2.1
Commercially available DECT software used in clinical oncologic radiology
Image types | Dual-source dual-energy CT | Single-source dual-energy CT |
|---|---|---|
Image blending | ||
Linear blending | (console automatic reconstruction) Weighted average (WA) images | – |
Nonlinear blending | Syngo Optimum contrast | – |
Material decomposition | ||
Pair of virtual noncontrast (VNC) image and iodine map | Syngo Liver VNC (default or modified), with or without 3D volumetric application | Iodine-based and water-based images |
VNC, iodine overlay together with bone removal | Syngo dual-energy brain hemorrhage | – |
Virtual monochromatic images | ||
40–140 keV energy-selective image series | Syngo DE-CT monoenergetic | Virtual monochromatic (VMC) images |
2.3 Objective Evaluation of Postprocessed Images
2.3.1 Image Noise, SNR, and CNR
One of the major concerns with DECT images is the image noise and lesion-to-background contrast, compared to images acquired with single-energy CT (SECT) at comparable radiation dose.
Image noise, which could be subjectively perceived by radiologists as the image “graininess,” could also be objectively measured and compared in parallel in images acquired with different scanning procedures. Generally it is defined as the standard deviation of attenuation in the retroperitoneal fat or subcutaneous fat in the abdominal wall, measured with a standardized region of interest (ROI) of 1 cm2 area [6, 8, 23]. Sometimes it is also measured in the muscle [20] or air adjacent to the scanned object [30].
Signal-to-noise ratio (SNR) could also be evaluated in each organ of interest. With a standardized ROI, SNR is calculated by dividing the mean attenuation number by the corresponding standard deviation [1, 32].
Contrast-to-noise ratio (CNR) is a quantitative parameter with even greater clinical significance. Images with higher CNR are always desired since lesions are more readily detectable when they appear in higher contrast with the background normal tissue. CNR in the same object scanned with DECT and SECT has been investigated in several phantom studies [15] as well as in many clinical oncologic researches [16, 20, 28, 30, 31]. First, ROIs are selected in an area representing the lesion, as well as an area representing the “background,” be it liver parenchyma, pancreatic parenchyma, or renal parenchyma adjacent to but independent from the lesion. Then CNR is calculated as follows:
 ROIlesion is the attenuation value of the lesion, ROI background is the attenuation value of the background and σ is the standard deviation.

Such quantitative image evaluations have been widely carried out in various organs and disease conditions. Zhang et al. compared SNR and CNR of liver lesions on TNC and VNC acquired in both arterial phase and portal venous phase, in 102 patients with suspected liver disease. They reported that SNR was significantly higher on VNC, and the highest CNR was achieved with VNCa [32]. Kim et al. compared CNR in fused image data using linear blending method and nonlinear blending method with different weighted factors in a renal phantom and found nonlinear blended image sets the most preferred one [15]. Similar image analysis strategy was adopted with evaluation of hypovascular liver metastasis [28], renal masses [8], laryngeal and hypopharyngeal cancer [19] and lung cancer [17].
Stay updated, free articles. Join our Telegram channel

Full access? Get Clinical Tree


