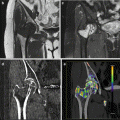
Fig. 8.1
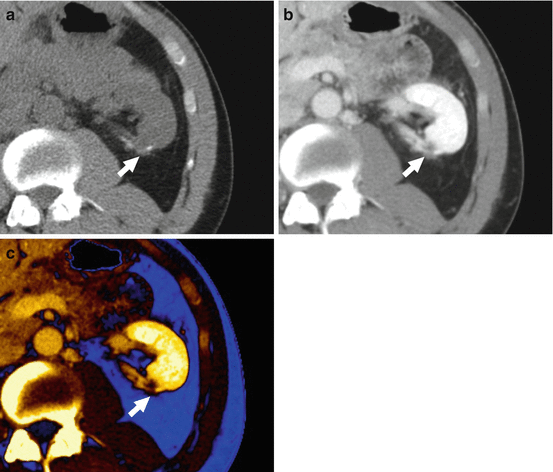
(a) Conventional noncontrast, postcontrast, (b) conventional, and (c) 80 keV virtual monochromatic nephrographic images in a 45-year-old man with low attenuation intra-parenchymal lesion of the left kidney. In the unavailability of a (a) conventional noncontrast scan, the lesion is called indeterminate on the basis of (b) conventional postcontrast nephrographic imaging. The (c) 80 keV virtual monochromatic nephrographic image allows for minimizing pseudoenhancement, hence warranting a definite diagnosis of simple cyst
By exploiting a real-time interactive display of monochromatic images at a dual energy workstation, the radiologist can interrogate the change in attenuation of a lesion over a range of discrete energies, a process that is not feasible with conventional MDCT [35, 36]. In particular, with the use of dedicated software applications, keV spectral attenuation curves can be generated by plotting the attenuation values (in HU) of a material at different monochromatic energies, ranging from 40–140 keV. With this technique, specific tissue characterization is achievable based on known mean attenuation characteristics of different materials, especially those with higher atomic numbers [35, 36]. Enhancing solid renal lesions can be potentially differentiated from nonenhancing cysts on a single-phase nephrographic image based on spectral attenuation curves. Of note, solid tumors uptaking iodine show a steep increase in attenuation with progressive lower energies (upward curve), whereas nonenhancing cysts do not modify their attenuation across the explored monochromatic scale (flat curve) (Figs. 8.2 and 8.3).
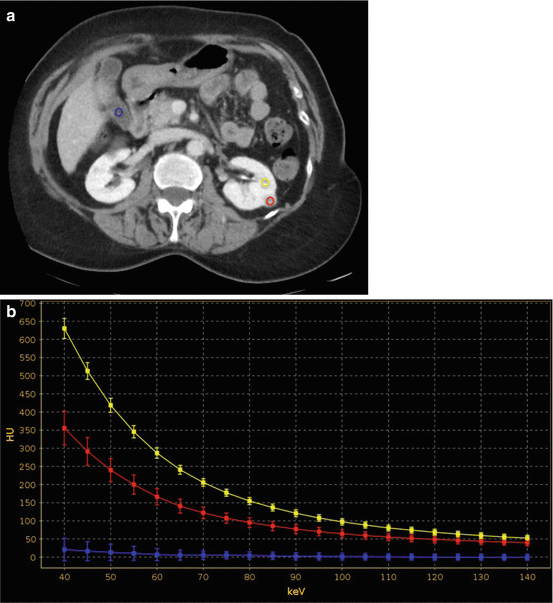
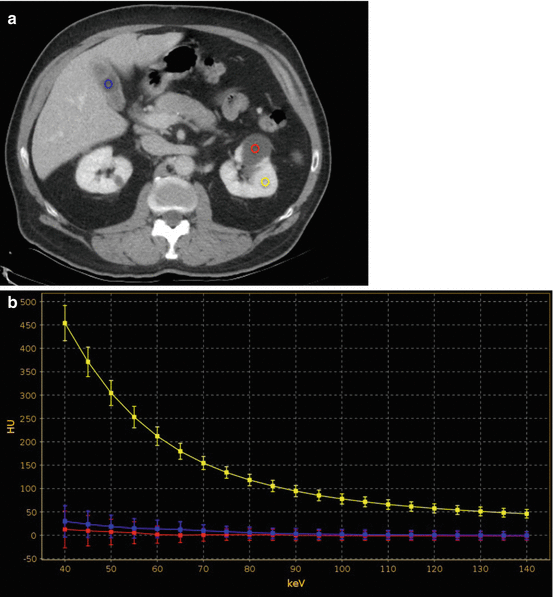

Fig. 8.2
(a) Contrast-enhanced 70 keV virtual monochromatic nephrographic phase transverse image with (b) corresponding spectral attenuation curve calculation in a 64-year-old man with high-attenuation lesion of the left kidney. There is possible concern of lesion enhancement; however, in the absence of unenhanced imaging, a certain diagnosis cannot be made as the lesion may represent either an enhancing lesion or a high-attenuation cyst. (b) ROIs are placed on the renal lesion (red ROI), normal renal parenchyma (yellow ROI) and within the gallbladder (azure ROI). By plotting the attenuation values of a material at different monochromatic energies, ranging from 40 to 140 keV, the corresponding spectral attenuation curve is generated for the three ROIs at various keV values. The renal lesion shows a relatively steep, upwardly sloping curve (red curve) at lower keV, which resembles that of enhancing normal renal parenchyma (yellow curve) while substantially differing from that of the nonenhancing gallbladder fluid (azure curve), The analysis of these spectral curves allows one for concluding that the renal lesion represents an enhancing solid tumor

Fig. 8.3
(a) Contrast-enhanced 70 keV virtual monochromatic nephrographic phase transverse image with (b) spectral attenuation curve calculation in a 57-year-old man with low-attenuation lesion of the left kidney. (b) ROIs are placed on the renal lesion (red ROI), normal renal parenchyma (yellow ROI) and within the gallbladder (azure ROI). By plotting the attenuation values of a material at different monochromatic energies, ranging from 40 to 140 keV, the corresponding spectral attenuation curve is generated for the three ROIs at various keV values. The renal lesion shows a flat curve (red curve) at lower keV, which resembles that of the nonenhancing gallbladder fluid (azure curve), while substantially differing from that of enhancing normal renal parenchyma (yellow curve). The analysis of these spectral curves allows one for concluding that the renal lesion represents a nonenhancing cyst
8.3.2 Material-Specific Applications
8.3.2.1 Technical Considerations
Material-specific images can be obtained from dual energy data, either after the reconstruction of high- and low-energy images (“image-domain decomposition”) or before images are reconstructed from high- and low-energy sinograms (“data-domain” or “projection-space decomposition”) [23, 35–43]. Image-domain decomposition is used for material analysis of images obtained with the dual-source MDCT system, whereas data-domain decomposition is used for material analysis of dual energy MDCT images obtained with fast kV switching MDCT platform [23, 35–43].
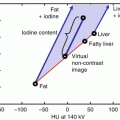
Information from dual energy datasets allow for the analysis of material composition in a voxel-by-voxel fashion based on either a “three-material-decomposition” principle for image domain decomposition or a “two-material-decomposition” principle for data-domain decomposition [23, 35–43]. With a three-material-decomposition analysis, the absorption characteristics of three idealized materials, such as fat, soft tissue, and iodine, are used at two energy levels to create a spectral iodine extraction image series; the iodine contribution to the image can be subtracted, thus generating a virtual unenhanced images or, alternatively, can be overlaid in different percentages on gray-scale information, thus creating a color-coded iodine map [23, 35–43]. By comparison, when a two-material decomposition algorithm is utilized, the absorption characteristics of two basis materials (i.e., iodine and calcium, or iodine and water) having substantially different effective atomic number and mass-attenuation coefficients are used to obtain two sets of images (“material-density images”) [23, 35–43]. Specifically, if iodine and water are the selected base materials, iodine- and water-density images are obtained (Figs. 8.4 and 8.5).
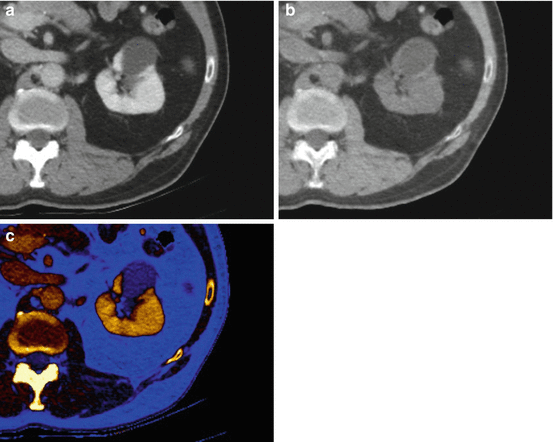
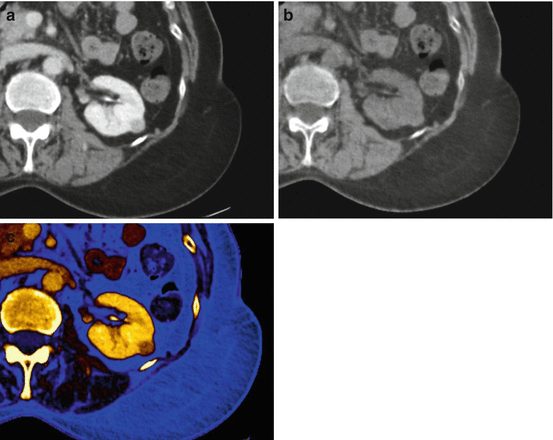

Fig. 8.4
Dual energy material decomposition analysis, including (a) conventional nephrographic, (b) virtual unenhanced, and (c) color-coded iodine map, in a 57-year-old man with a nonenhancing cystic lesion of the left kidney. Note that enhancement, by means of color signal devoid, is confidently ruled out in the lesion on the (c) color-coded iodine map

Fig. 8.5
Dual energy material decomposition analysis, including (a) conventional nephrographic, (b) virtual unenhanced, and (c) color-coded iodine map, in a 64-year-old man with renal cell carcinoma of the left kidney. Note that enhancement, by means of color signal, is confidently identified in the lesion on the (c) color-coded iodine map
8.3.2.2 Clinical Applications
Along with baseline attenuation measurements, the evaluation of lesion morphologic and structural features represents a critical step in the characterization of a renal mass [1–9, 19]. Of note, when a renal lesion shows enhancement in the concurrent presence of intralesional calcifications, and possibly macroscopic fat, it should be considered suspicious for malignancy [1–9, 19]. Virtual unenhanced images have demonstrated to be quantitatively and qualitatively comparable to conventional unenhanced images [14, 16–19, 21–23, 25, 28, 31, 32]. An accumulating body of evidence in literature has shown that virtual unenhanced images represent a clinically feasible surrogate of conventional noncontrast images for various anatomic regions throughout the abdomen and, specifically, allow for reliable assessment of pre-contrast renal lesion attenuation [14, 16–19, 21–23, 25, 28, 31, 32]. Furthermore, virtual unenhanced images are able to depict a broad range of different structural features that may be found in a renal lesion, including areas of low attenuation (e.g., fat, cystic components, or necrosis), intermediate attenuation (e.g., solid component or debris), high attenuation (e.g., hemorrhagic or protein-rich content), as well as calcifications [16, 19, 21–23, 25, 28, 31, 32]. Thereby, virtual unenhanced imaging allows for omitting the acquisition of conventional noncontrast images, translating into achieving in daily clinical practice a 30 % mean dose saving for triphasic and up to 50 % for biphasic renal MDCT protocols. This may be particularly beneficial to decrease the cumulative radiation dose in patients requiring long-term MDCT follow-up (i.e., young patients with complex cystic renal lesions) [14–17, 19, 22, 23, 25].
A daily question oftentimes the radiologist is faced in clinical practice is the differential diagnosis between benign high-attenuation cysts (Bosniak category II) and solid enhancing lesions (most importantly renal cell carcinoma) on contrast-enhanced images, if the measured attenuation of a renal lesion is higher than the attenuation of simple fluid (>+20 HU). High-attenuation cysts (due to hemorrhagic or protein-rich content) are homogeneous, well-defined lesions without evidence of enhancement [1–9, 19–49]. The latter is the diagnostic clue for differentiating a high-attenuation cyst from an enhancing solid renal neoplasm, especially when an enhancing renal mass is small, well-defined, and homogeneous in attenuation. Under these circumstances, if a noncontrast acquisition is not available, the patient must undergo either: (a) an ultrasound (which is often not definitive, especially if the attenuation of the lesion is greater than +40 HU because it contains blood or proteinaceous debris), (b) an additional delayed CT acquisition to assess for “de-enhancement” or, more commonly, (c) a repeated study with either MDCT or MRI which includes both unenhanced and contrast-enhanced acquisitions [49]. Iodine-specific dual-energy images (color-coded iodine overlay or iodine-density images) allows for a color-coded display of the iodine distribution within the explored volume [17–23, 25–28, 30, 36–39, 47, 50]. The direct visualization of iodine signal within the mass permit to distinguish a nonenhancing cyst from a solid enhancing lesion on a single-phase color-coded iodine image. Of note, as renal cysts are avascular, color-coded iodine-specific images show a cyst as devoid of iodine signal (Fig. 8.4). By comparison, enhancing solid renal masses demonstrate iodine signal within the lesion (Fig. 8.5) [17–23, 25–28, 30, 36–39, 47].
Color-coded iodine overlay images can also provide further benefits over conventional MDCT imaging for the evaluation of enhancement in subcentimeter renal masses. This subset is usually prone to substantial variability in region-of-interest (ROI) placement, especially on renal tumors that are isodense to the renal parenchyma on noncontrast images [1–9, 15, 26, 39, 42, 43]. As the presence of enhancement within a renal lesion can be determined without the need for MDCT number measurements on both unenhanced and contrast-enhanced images, one can refrain from unenhanced images acquisition and postprocessing (Fig. 8.6) [19, 22, 26, 28]. It has been demonstrated that renal lesions can be accurately characterized in a single-phase dual energy protocol, with image interpretation time and radiation exposure that are significantly decreased [14, 19, 22, 25, 26, 28].
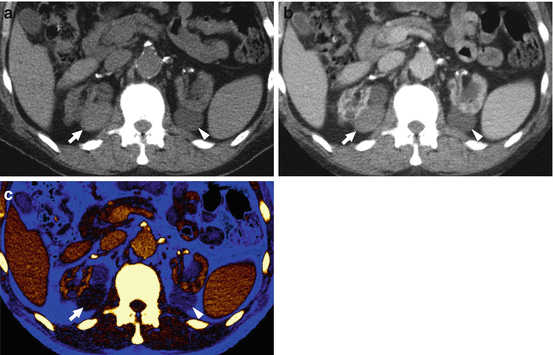

Fig. 8.6
(a) Conventional noncontrast, postcontrast, (b) conventional nephrographic, and (c) color-coded iodine map images are shown in a 65-year-old man with multiple, bilateral renal lesions. There is possible concern of lesions enhancement, especially for two lesions arising from the medial aspect of the right (arrow) and the left (arrowhead) kidney. The use of (c) color-coded iodine map allows for confidently identifying iodine content (1.4 mg/mL) within the lesion (RCC) located in the right kidney (arrow), while ruling out any enhancement in the lesion of the left kidney (arrowhead)
More recently, dual energy MDCT also enables a direct quantification of iodine concentration (in mg/mL) in a lesion with a single ROI on color-coded iodine images [14, 26, 34]. This represents an alternative approach to conventional attenuation measurements for the determination of lesion enhancement, relying on the assumption that iodine does not naturally occur in measurable concentrations in the healthy renal tissue; the only way it can be present is through exogenous administration [14, 26, 34]. A burgeoning evidence in literature has been suggesting that iodine quantification may be superior to conventional attenuation measurements, especially in discriminating minimally enhancing tumors, such as papillary subtypes of renal cancer, from high-attenuation cysts [14, 26, 34]. Of note, a lesion iodine concentration greater than 0.5 mg/mL has been suggested as highly indicative of renal lesion iodine uptake (Fig. 8.6) [14, 26].
While large ROIs are typically adopted for ascertaining the presence of enhancement in renal lesions showing homogeneous texture, multiple small ROI measurements, which have to be obtained from all portions of the lesion and similarly placed on both the unenhanced and contrast-enhanced images, are required for complex cystic or necrotic lesions [2–6]. This approach is often tedious, depends on reader’s experience, and is affected by the inclusion of small areas of necrosis or cystic changes. While conventional enhancement measurements are affected by the inclusion of necrosis or cystic areas because it is the averaged value of all areas within the ROI, the iodine concentration is the summed value of enhancing areas alone and thus this value is not affected by the inclusion of necrosis or cystic areas within the ROI [26]. Therefore, independent of the solid or cystic tumor texture, it is possible to accurately assess the iodine uptake by drawing a single large ROI on color-coded iodine image [14, 26]. This allows elimination of all confounding factors in enhancement evaluation and to significantly reduce reading time.
Another clinical scenario where color-coded iodine overlay images may be of clinical use is the imaging surveillance after percutaneous thermal ablation of a renal mass. In such a clinical context, conventional MDCT imaging is used periodically to assess the effectiveness of the treatment and to determine the presence of complications, such as tumor recurrence [51–54]. Of note, the presence of tissue enhancement and nodular growth are the two imaging features commonly used to identify remaining viable tissue after ablation of a renal tumor [51–54]. Nevertheless, changes due to the prior ablation treatment, such as perinephric hematoma and stranding, can complicate the identification of tumor recurrence at MDCT [51–54]. By virtue of the selective representation of iodine-containing voxels, dual energy MDCT iodine density and color-coded iodine overlay images may represent a problem-solving tool in this clinical context (Fig. 8.7).

