Fig. 6.1
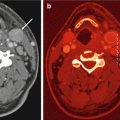
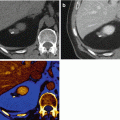
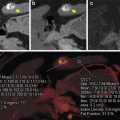
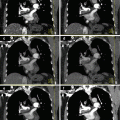
A 66-year-old woman with pancreatic ductal adenocarcinoma. (a) DECT pancreatic parenchymal phase GSI server standard pancreatic carcinoma postprocessing “collage” with 70 keV (left column), 52 keV (middle column), iodine MD (right column), axial (top), and coronal (bottom) images demonstrate a large hypovascular mass in the anterior pancreatic head, encasing the gastroduodenal artery and abutting the unopacified SMV. The entrance of the obstructed pancreatic and bile ducts into the mass is best depicted on the coronal images. The margins appear sharper on the low energy and iodine images even though these are source 0.625 mm images. The images can be made to any desired thickness, and other image variables such as viewing keV, FOV, material decomposition basis pair, imaging plane, window, and level can be instantaneously adjusted. (b) GSI server collage demonstrating alteration in appearance of simulated monoenergetic images as the energy increases from 40 (top left to 140 (bottom right) keV. The window and level have been kept constant at 400/40 in order to show that the increased contrast/brightness is solely due to the change in viewing energy. Note that as the energy decreases, the amount of image noise increases. Our previous research has found that optimum pancreatic adenocarcinoma simulated monoenergetic viewing is in the low 50 keV range. (c) Same patient approximately 13 weeks later during neoadjuvant therapy with FOLFIRINOX. A metallic stent has been placed into the bile duct, and the tumor appears slightly smaller but continues to encase/abut the SMV. This patient was eventually resected with R0 margins
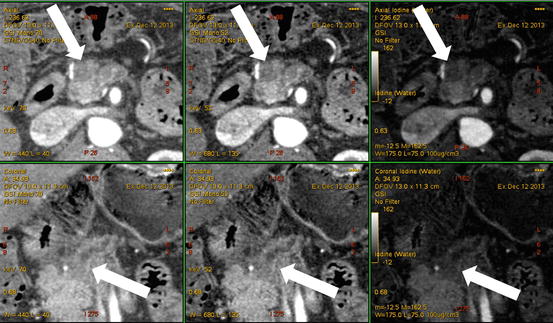
Fig. 6.2
A 61-year-old man with tiny pancreatic ductal adenocarcinoma. We have designed our DECT pancreatic parenchymal phase GSI server standard pancreatic carcinoma postprocessing “collage” to contain 70 keV (left column), 52 keV (middle column), iodine MD (right column), axial (top), and coronal (bottom) images. The 1.2 cm pancreatic adenocarcinoma in the anterior head region (arrows) is better visualized on the low energy 52 keV (middle column) images compared to the 70 keV (left column) images. The best definition of the margins is on the iodine image however. Our research has consistently shown the highest contrast to noise ratios on iodine MD images
6.2 Pancreas Adenocarcinoma
Pancreatic adenocarcinoma is a devastating disease and is projected by 2030 to be the second leading cause of cancer mortality [2–6]. Because survival can be improved with surgical intervention, particularly for small or lower stage tumors (Fig. 6.3), early detection and characterization is very important. Multiphasic multidetector CT (MDCT) plays a major role in this evaluation [4, 5], but there are still recognized shortcomings. Despite state of the art MDCT imaging, the sensitivity for detection of pancreatic ductal adenocarcinoma for lesions less than 2 cm is decreased [7]. In addition, four to 27 % [8–10] of pancreatic cancers are isoattenuating (Fig. 6.4) to the adjacent pancreatic parenchyma, especially when small [9, 10]. These lesions may be discovered only by detection of secondary signs on imaging, such as segmental dilation of the pancreatic duct [10, 11].
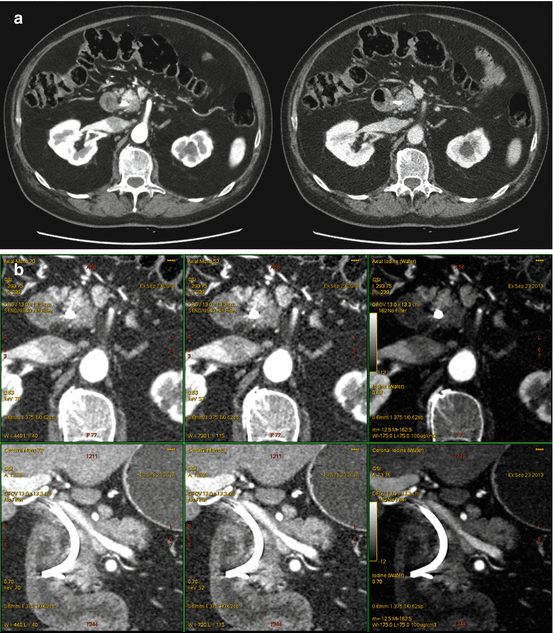
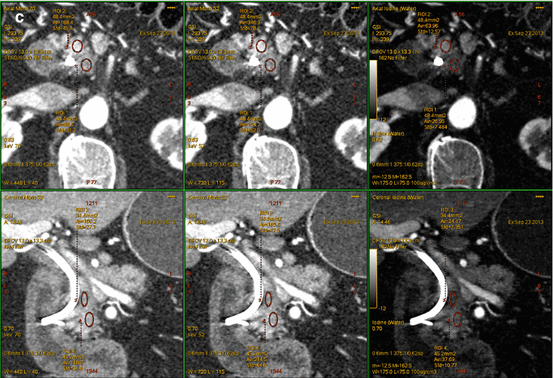
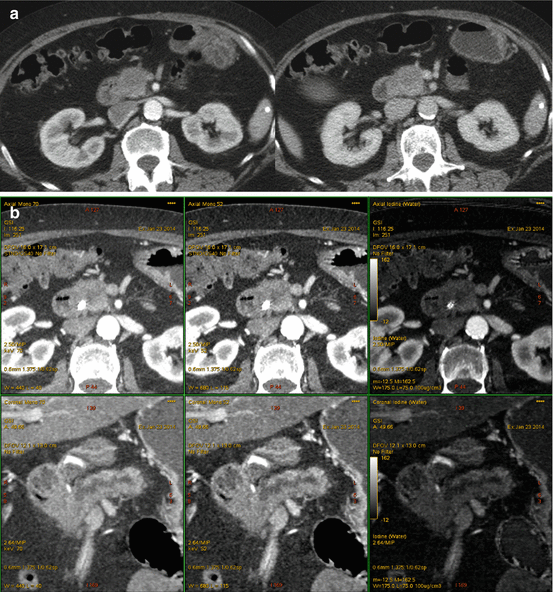


Fig. 6.3
A 60-year-old man with noncontour-altering isoattenuating pancreatic mass. (a) The lesion is not seen on single energy CT portal venous phase (right), but is visualized in the posterior pancreatic head region on dual energy pancreatic parenchymal phase (left). The lesion was also not well depicted on endoscopic ultrasound, and EUS FNA was negative for neoplasm on two occasions within 1 month after the DECT scan. (b) Pancreatic parenchymal phase GSI server “collage” with 70 keV (left column), 52 keV (middle column), iodine MD (right column), axial (top), and coronal (bottom) images reveal the tiny lesion in the mid aspect of the medial pancreatic head, adjacent to the stent. The margins are better depicted on the low energy and iodine images. This is borne out by the quantitative measurements on the 0.625 mm source images, which show higher absolute lesion contrast at low energies on (c). At resection, this lesion was a moderately differentiated pancreatic ductal adenocarcinoma, T3N0

Fig. 6.4
A 64-year-old woman with isoattenuating pancreatic adenocarcinoma. (a) Multiphasic pancreatic single energy CT (pancreatic phase left, portal venous phase right) obtained at the referring hospital demonstrates a very poorly defined mass in the anterior pancreatic head. (b) Multiphasic pancreatic dual energy CT was performed. Pancreatic adenocarcinoma GSI server collage demonstrates the margin of the small mass in the anterior head region adjacent to the high density bile duct stent. Note the diminished artifact associated with the stent on the iodine MD images. The dilation of the main pancreatic duct to the level of the mass is best seen on the coronal images; this view is particularly helpful when the lesions are iso- or near-iosattenuating
Pancreatic adenocarcinoma is characteristically hypoattenuating relative to the adjacent parenchyma and is best depicted during the pancreatic parenchymal phase MDCT [12]. Complete assessment for vascular invasion and distant metastatic disease requires venous phase images [4, 13]; thus, state of the art single energy or standard pancreatic MDCT involves at least two acquisition image sets. Preliminary investigations utilizing dual energy CT [1, 14] and single energy low kVp imaging [15, 16] have demonstrated improved conspicuity of hypovascular pancreatic adenocarcinomas at lower viewing or acquisition energy levels. In our practice at present, DECT is acquired through the upper abdomen during the pancreatic parenchymal phase of a multiphasic exam, and single energy DECT is acquired through the abdomen and pelvis in portal venous phase. In efforts to reduce radiation exposure, Brook et al. [17] recently described a split bolus spectral DECT protocol that takes advantage of low (60 keV) energy DECT simulated monenergetic image viewing during hepatic venous phase while providing parenchymal attenuation values similar to a standard MDCT pancreatic parenchymal phase in patients with a variety of pancreatic lesions. Other investigators have reported improved detection and staging of focal pancreatic lesions using other types of images available only with DECT, such as iodine material density [18] images, or during novel modes of DECT image acquisition such as CT perfusion [19] and portal venography [20]. Although DECT acquisitions have been applied during a single venous phase [1], during the pancreatic parenchymal phase of a multiphasic abdominal protocol [14, 18], during a single split bolus single acquisition [17], and during alternative timing schemes, the principles resulting in production of advantageous image data apply no matter the timing. These will be described based on the category of dual energy image and the various types of pancreas neoplasms in more detail below.
6.3 Low Energy Applications
Macari et al. [1] first showed that conspicuity of pancreatic adenocarcinoma was greater using 80 kVp compared to blended 120 kVp images on dual source DECT obtained in portal venous phase. In this study, the weighting for the blended images was 0.3 for 80 kVp and 0.7 for 140 kVp. Chu et al. [21] identified that blended images with a weighting factor of 0.5 were preferred for evaluation of pancreatic diseases. Patel et al. [14] first showed the potential of rapid kV switching DECT acquired during pancreatic parenchymal phase to evaluate pancreatic adenocarcinoma lesion conspicuity in a cohort of 65 patients, and found a statistically significant increase of lesion contrast, a near doubling of the Hounsfield unit (HU) difference between tumoral and nontumoral tissue, on CNR-optimized keV images compared to the 70 keV image, the image energy typically used for routine PACS viewing (Fig. 6.5). The CNR-optimized keV calculation feature on the independent workstation and client server of the rapid kV switching DECT system workstation generates this value for each individual subject based on ROIs within tumoral and nontumoral tissue, and the mean optimized keV for the population in that early study was 52 keV. Note that with the rapid kV switching type of dual energy acquisition, there is no blended image and no generation of separate 80 and 140 kVp image sets for diagnosis. In a second study by the same group, a similar gain in conspicuity using low viewing energy was found for small pancreatic adenocarcinomas, an important and clinically relevant improvement, as smaller lesions might not alter the contour of the gland [18]. The use of lower simulated monoenergetic viewing energy (52 keV) in this study provided the best objective image quality measures (CNR, lesion contrast) for multiple readers. Also in that study, four of five lesions that were suspected clinically based on secondary findings of main pancreatic duct dilation were identified using low energy and iodine MD images combined with 70 keV [18] (Fig. 6.6). Others have also shown an improvement in pancreatic ductal adenocarcinoma detection by combining low keV imaging with a split bolus IV contrast administration technique [17] or by combining dsDECT 80 kVp images with a CT perfusion technique [19].
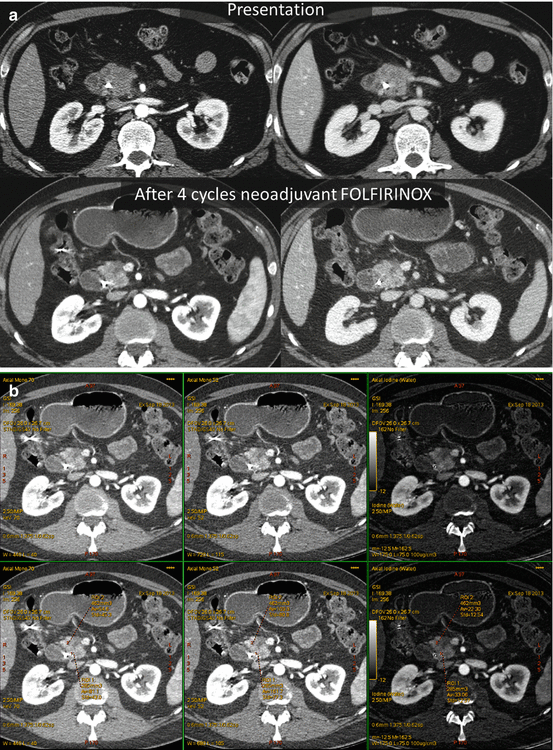
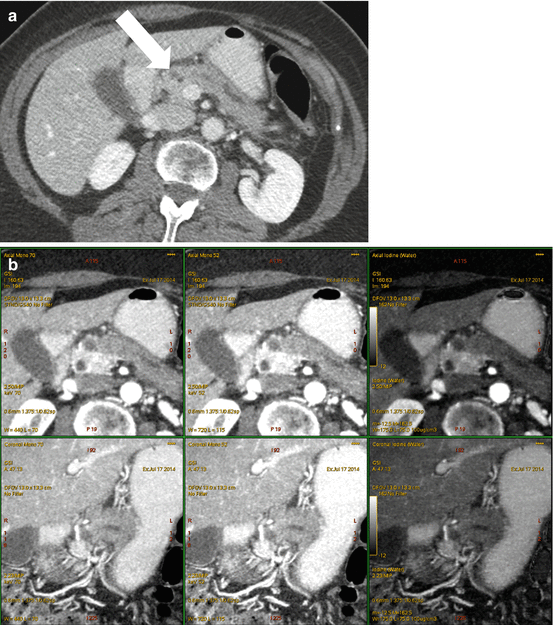
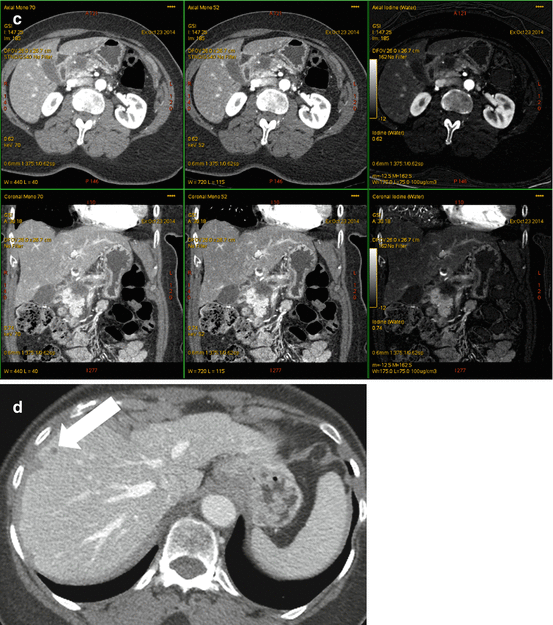
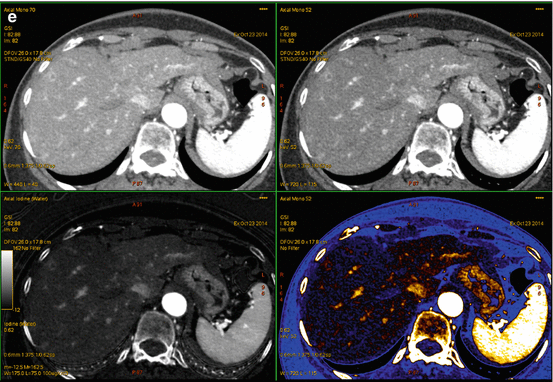

Fig. 6.5
A 40-year-old man with small pancreatic ductal adenocarcinoma resected after four cycles of neoadjuvant therapy, portal vein graft required. (a) Pancreatic parenchymal phase (left) and portal venous phase (right) PACS images at presentation (top, single energy CT) and after neoadjuvant therapy with FOLFIRINOX (bottom, dual energy CT). A small heterogeneous hypovascular mass abuts the right margin of the superior mesenteric vein at the inferior pancreatic head level. Note that the lesion is not well distinguished on portal venous phase but is apparent on the pancreatic phase on the DECT. A biliary stent is in place. (b) Same patient DECT pancreatic parenchymal phase GSI server “collage” with 70 keV (left column), 52 keV (middle column) and iodine MD (right column) 2.5 mm images. The borders of the small mass are better seen on the 52 keV and iodine MD images, and the extent of involvement of the right lateral wall of the superior mesenteric vein (SMV) is more clearly seen. Volumetric regions of interest were drawn in the tumor and nontumoral tissue (bottom row) demonstrating the greater absolute lesion contrast on the 52 keV image compared to the 70 keV image. The 70 keV image is the simulated monoenergetic image energy that in our clinical practice most closely resembles images obtained at 120 kVp for single energy CT


Fig. 6.6


A 72 year old woman with presenting with secondary signs of pancreatic cancer (a) Portal venous phase single energy CT image obtained at the referring hospital demonstrates dilation of the pancreatic duct in the tail/body region. There is slight heterogeneity in the anterior neck (arrow). The duct was not dilated downstream (towards the papilla) from this point. (b) Multiphasic pancreatic DECT was obtained for further evaluation. GSI server standard pancreatic carcinoma postprocessing “collage” with 70 keV (left column), 52 keV (middle column), and iodine MD (right column) 2.5 mm reformatted images demonstrate the tiny round subcentimeter pancreatic adenocarcinoma at the site of duct cut off, better seen on the coronal image (bottom row). There is marked differential enhancement of the gland upstream in the body and tail region from downstream in the head region. The patient underwent EUS fine needle aspiration biopsies which were negative, demonstrating only chronic inflammation. (c) Same patient 12 weeks later. GSI server collage demonstrates that the hypovascular mass in the pancreatic neck has now grown to greater than 2 cm. The relationship of the mass to the main pancreatic duct is better seen on the coronal images. (d) On the same multiphasic CT exam, the single energy CT portal venous phase images revealed a well-circumscribed hypodensity in the interlobar region of the liver (arrow) that was new and therefore highly suspicious for distant metastatic disease. (e) GSI server collage through the level of the suspicious liver lesion reveals rim-like enhancement, indicating metastatic disease. This image presentation uses a gray scale color “perfusion” filter to enhance visualization of hyperenhancing lesions such as hepatocellular carcinomas or metastatic gastrointestinal stromal tumors
Stay updated, free articles. Join our Telegram channel

Full access? Get Clinical Tree


