Fig. 9.1
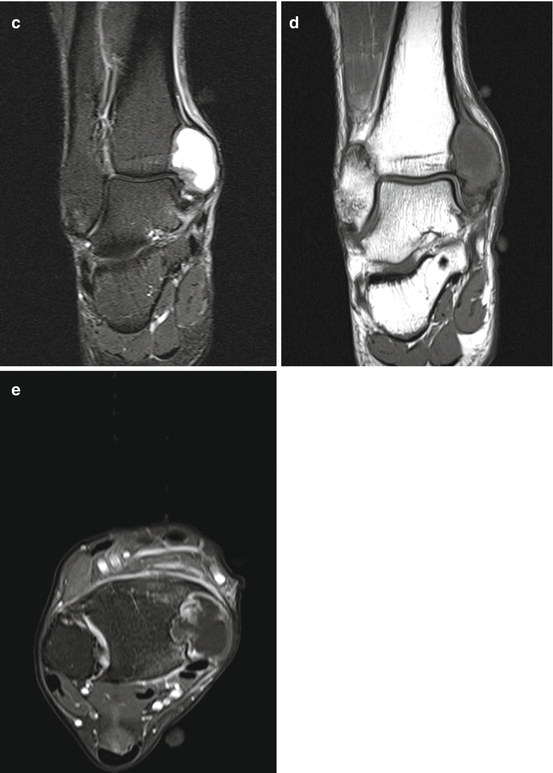
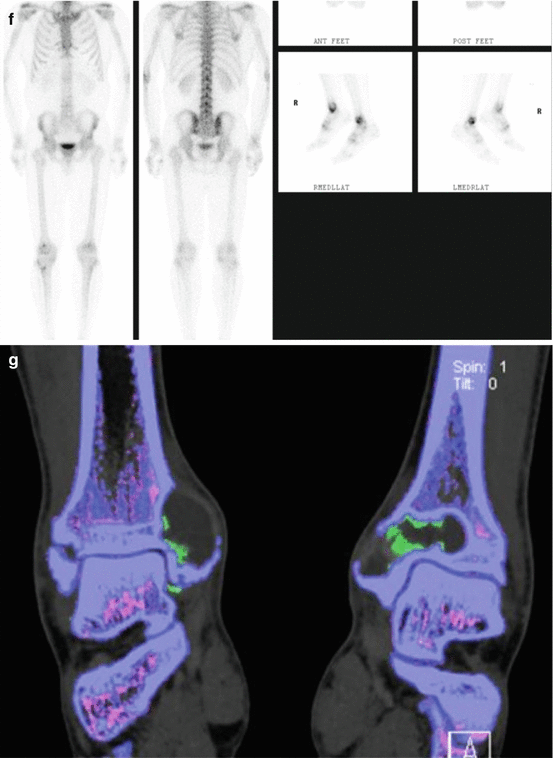
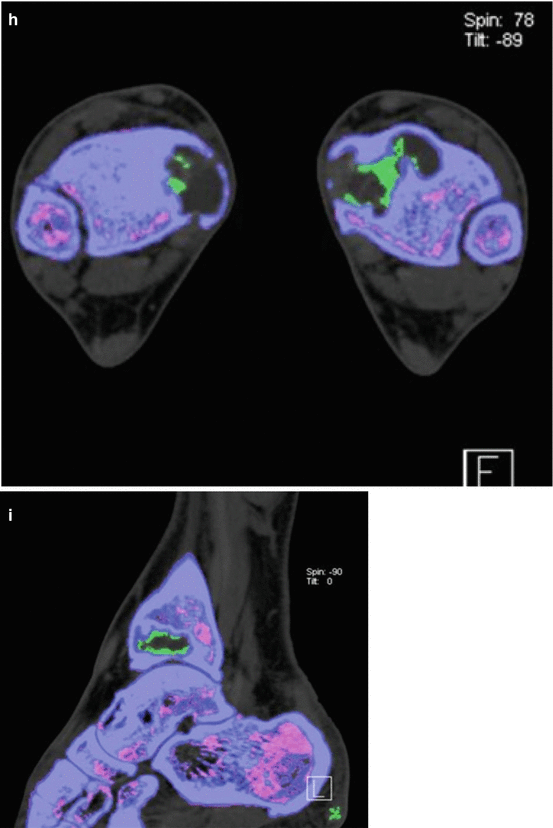
A 56-year old man presented with bilateral medial malleolus acute pain without history of trauma. Erythrocyte sedimentation rate (ESR) was negative. There was no history of gout, malignancy, or infection. Plain radiographs demonstrated intraosseous mass and the patient was subsequently referred to the orthopedic oncology surgeon for work-up and biopsy. Frontal radiographic images (a) of bilateral ankles in a patient; (b) sagittal, axial, and coronal CT images of the right ankle demonstrate well-marginated lucent lesions in the medial aspect of the distal tibial metaphysis and distal tibial plafond with sclerotic margins. The patient was referred to a sarcoma surgeon for work-up and biopsy. (c) coronal STIR, (d) coronal T1, and (e) axial fat saturated T1 post intravenous gadolinium MR images of the right ankle revealed the mass is hyperintense on STIR and isointense on T1 with predominantly peripheral and mild internal enhancement. (f) Bone scan shows increased radiotracer uptake in both these ankle lesions. Coronal (g), axial (h), and sagittal (i) reformatted images from DECT analysis demonstrate monosodium urate deposits within these masses, consistent with intraosseous gout. Uric acid level that was measured after the DECT scan was elevated. No biopsy was performed and the patient was treated conservatively
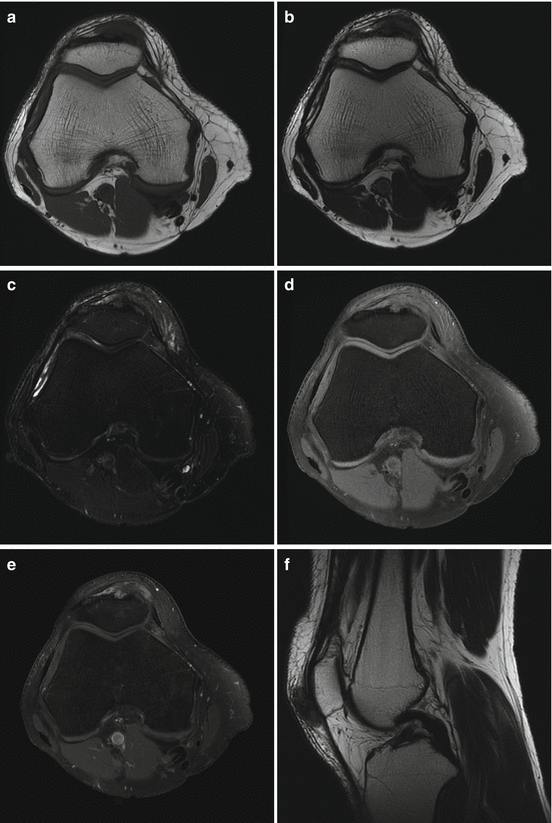
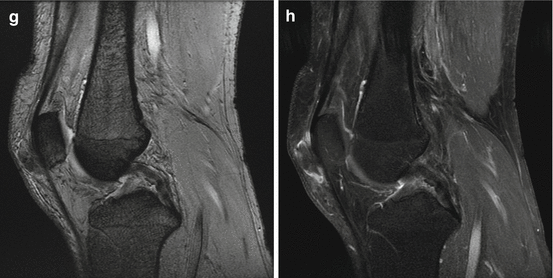
Fig. 9.2
A 54-year old man presented with a growing lump in the anterior aspect of the right knee without history of injury. Axial T1 (a), axial T2 (b), axial fat-saturated T2 (c), axial fat-saturated T1 before (d) and after (e) administration of intravenous gadolinium, sagittal T2 (f), sagittal fat-saturated T1 (g), sagittal MPGR (h) MRI sequences demonstrated a 2.7 cm (transverse) ×1.3 cm (anteroposterior) ×2.5 cm (craniocaudal) subcutaneous mass that erodes into the anterior cortex of the patella. The mass demonstrates hypointense signal on T1, intermediate signal on T2, and heterogeneous enhancement without significant blooming on gradient-echo sequence. The MRI features of the mass are nonspecific, with broad differential diagnoses that include gouty tophus and a soft tissue sarcoma. We recommended dual energy CT
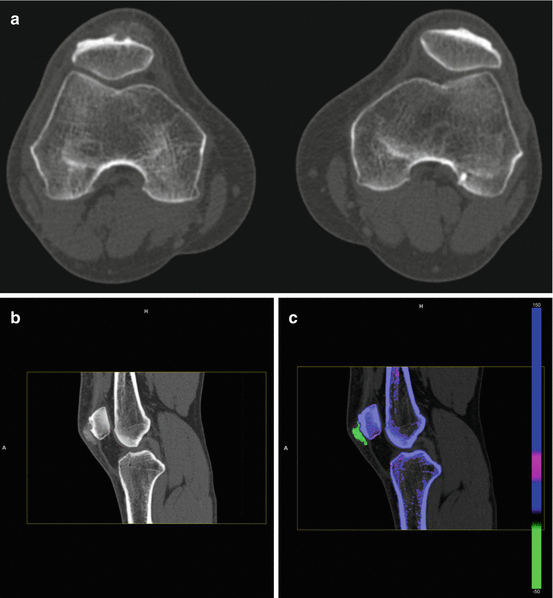
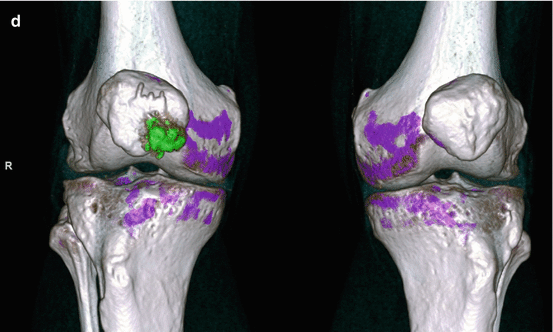
Fig. 9.3
Axial CT images of bilateral knees (a) and sagittal CT images of the right knee (b) show a mineralized right prepatellar mass with associated erosion of the anterior cortex of the patella Sagittal (c) sagittal reformatted image with DECT characterization confirms the mineralization as monosodium urate deposits (color coded as green), which is composed of C, H, N, and O are present within the prepatellar mass. Calcium, a heavy, high atomic number element with high attenuation of the low kV beam is color coded as blue. Trabecular bone is color coded as pink, (d) 3-dimensional volume-rendered coronal reformatted DECT of the right knee (R) shows the prepatellar tophaceous gout and the nonaffected left knee
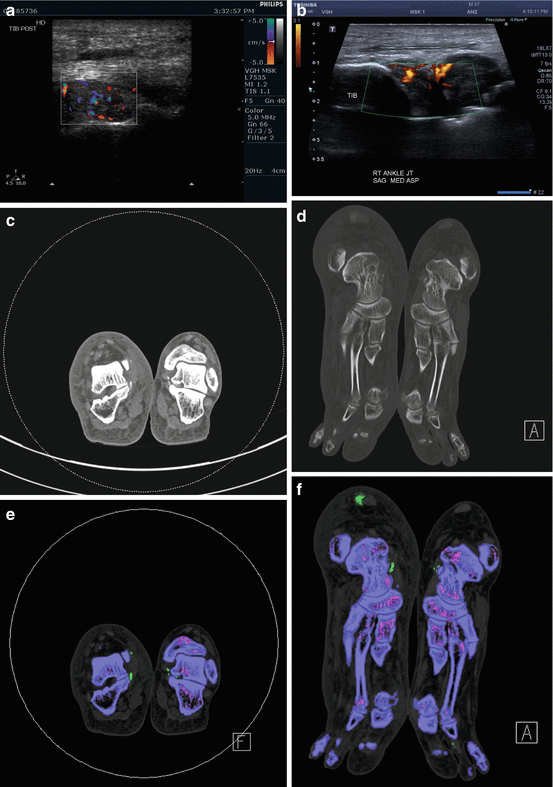
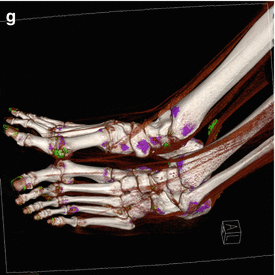
Fig. 9.4
A 57-year old man with history of ulcerative colitis, hypertension, and gout presented with a mass that arises from the medial aspect of the right foot. (a, b) Ultrasound demonstrated a hyperemic 1.7 cm mass inferior to the medial malleolus that is contiguous with the medial aspect of the subtalar joint and deep to the tibialis posterior tendon. (c) Coronal and (d) axial CT images showed mineralization in this mass, associated with mild erosion involving the juxta-articular aspect of the medial subtalar joint. Note is made of mineralization in a similar area on the contralateral left foot and mineralization in a right Achilles peritendinous mass. After DECT analysis, coronal (e), axial (f), and 3-D volume-rendered (g) images confirmed mineralization as monosodium urate deposits. 3-D volume-rendered DECT images of both feet demonstrate the presence of monosodium urate within the peritendinous mass contiguous with the right tibialis posterior tendon, and deposits elsewhere in both feet including a peritendinous mass associated with the right Achilles tendon
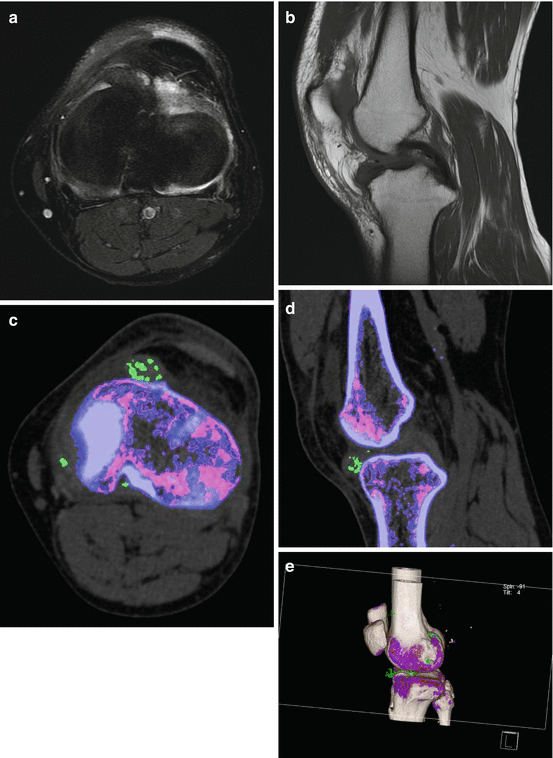
Fig. 9.5
A 55-year old man presented with left anterior knee pain. (a) Axial fat saturated PD FSE and (b) sagittal T1 FSE MRI images demonstrate an intra-articular mass contiguous with the anterior horn of the medial meniscus that is low signal on T1, T2, and fat saturated PD sequences, with a working diagnosis of pigmented villonodular synovitis. DECT axial (c), sagittal (d), and (e) 3-D volume-rendered images demonstrate monosodium urate within the intraarticular mass
9.2.2 Pigmented Villonodular Synovitis (PVNS)
Benign synovial proliferative lesions are commonly encountered in musculoskeletal clinical practice. PVNS is an umbrella term that encompasses benign proliferative lesions involving the synovium of the joint, bursa, and tendon sheath. PVNS can present as a diffuse intraarticular, localized intraarticular, or localized extraarticular mass [2, 30, 32].
Synovial biopsy and histopathology provide the definitive diagnosis of PVNS [2, 30, 32]. Synovial proliferation with scattered multinucleate giant cells, macrophages, fibroblasts, xanthoma cells, and variable amounts of hemosiderin are present. Hemosiderin is helpful, but not a prerequisite for histological diagnosis [2]. Furthermore, the extent of hemosiderin deposition is variable. Hemosiderin is usually a much more prominent feature of diffuse intraarticular PVNS [2]. Consequently, we will focus on the diffuse intraarticular form of PVNS for the remainder of this section.
The histopathology of the diffuse intraarticular form of PVNS can appear similar to an aggressive sarcoma such as synovial sarcoma, rhabdomyosarcoma, and epitheloid sarcoma. These features include an extremely large cell size, invagination of the cytoplasm into the nucleus (which resembles large nucleoli), and an increased number of mitoses [2, 36, 38]. There is a large disparity in prognosis and treatment between PVNS and sarcoma. PVNS can be treated with synovectomy, however, sarcomas require removal of the tumor with clear margins, occasionally necessitating limb amputation [2, 36, 38]. Correlation of the histological features of the tissue biopsy with the imaging findings of a diffuse synovial process plays an important role in guiding the pathologist to the correct diagnosis.
MRI is the best imaging modality to detect this condition, due to the presence of hemosiderin in these lesions [1, 2]. On T2-weighted images, low signal intensity predominates due to preferential shortening of the T2 relaxation time caused by hemosiderin. Gradient-echo sequence significantly accentuates this effect, resulting in enlargement of the low signal intensity areas known as “blooming” [2, 3]. The blooming effect is considered to be nearly pathognomonic of PVNS, although synovial hemangioma and hemophiliac arthropathy can give similar findings due to intraarticular hemorrhage and synovial hemosiderin deposition [3, 4, 6, 7].
CT demonstrates synovial thickening and extrinsic erosion of bone on both sides of the joint in diffuse intraarticular PVNS. CT scans without contrast may show increased attenuation coefficient relative to that of muscle, due to hemosiderin content in the soft tissues [2, 8]. However, increased density is nonspecific and may reflect increased attenuation of other metals such as silicon, amyloid, copper, hemorrhage, calcium, or MSU crystals.
DECT has been utilized in the assessment of iron deposition within the liver; however, to our knowledge, there has been no published study on the use of DECT for detecting hemosiderin in soft tissue or bone lesions [8, 9, 11, 12].
9.2.2.1 “Hemosiderin/Iron” Application
The Liver VNC application enables the visualization of iodine contrast medium concentration in the liver without an additional noncontrast scan, even in the presence of irregular fatty infiltration of the liver or necrotic areas. The basis for this approach is a three-material decomposition algorithm with the three components being iodine contrast medium, fat, and soft tissue [11, 14].
For the purpose of detecting iron in a biopsy-proven diffuse intraarticular PVNS involving the hip, we modified the parameters in the Liver VNC application, by substituting iron/hemosiderin for iodine. Figure 9.6 demonstrates the altered key parameters. “Rel. CM,” the parameter that contains the ratio of relative change in attenuation at 80 kV/100 kV and 140 kV for the material in question, in this case being iron/hemosiderin, is changed from 2.24 (which was for iodine) to 1.56 at 100 and 140 kV. “Fat,” the parameter that contains typical HU-values of body fat, is altered to -100 for both 80 kV AND 140 kV. “Tissue,” the parameter that contains typical HU-values of soft tissue, is changed to 50 HU for both 80 kV and 140 kV. Iodine BHC, which activates beam-hardening correction for iodine contrast enhancement and allows clearer visualization of calcified plaques and stents, is switched off because the material in question is hemosiderin/iron and no longer iodine.
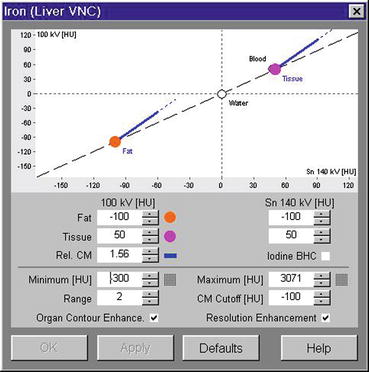
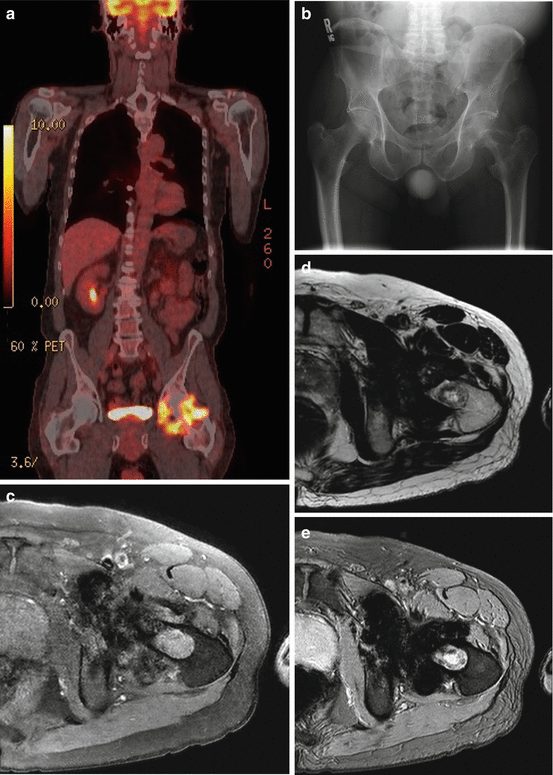
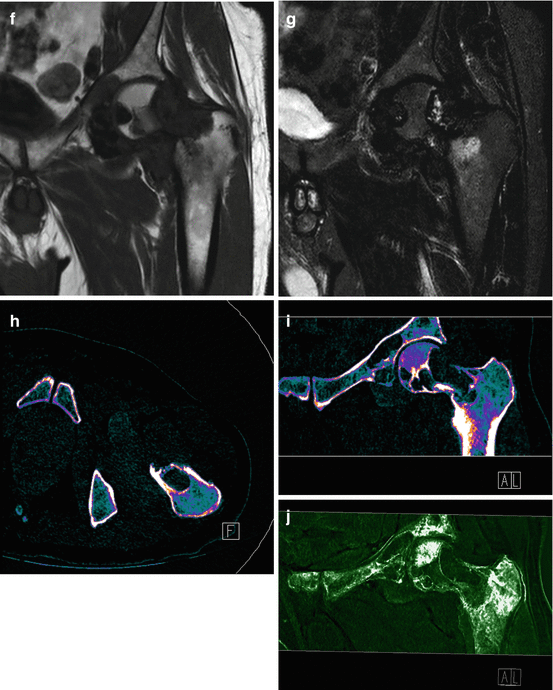

Fig. 9.6
Based on a modified Liver VNC application where hemosiderin or iron has replaced iodine, the Syngo Siemens Dual Energy software tool demonstrates three-material decomposition of fat, soft tissue, and iodine/hemosiderin


Fig. 9.7
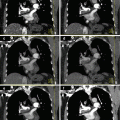
A 66-year old man with squamous cell carcinoma involving the left base of tongue had a (a) staging PET scan that revealed diffuse and avid uptake in the left hip. Clinical examination revealed an irritable left hip. (b) Plain pelvic radiograph shows well-defined erosions in the left femoral head and neck. (c) Axial fat suppressed T1, (d) axial T2, (e) axial gradient echo, (f) coronal T1, and (g) coronal STIR images of the left hip demonstrate femoral erosions, synovial thickening with low signal intensity on T1 and T2 weighted images with “blooming” on gradient-echo images. DECT axial (h) and coronal (i) images demonstrate hemosiderin deposit (color-coded as green) in the medial aspect of the left hip joint space that correlates with the “blooming” hypointensities seen on MRI. Assigning different color coding for the hemosiderin deposits (j) can make the lesion more conspicuous
9.2.3 Assessment of Vascular Masses
9.2.3.1 Body Bone Removal Application
The large attenuation differentiation between iodine (vascular component) and adjacent bone at low-energy levels allows us, with one sequential acquisition, to better delineate bone from adjacent vessels with one click utilizing the Syngo Via DECT vascular application. This is a faster and more accurate method than single energy techniques that require the need for a noncontrast scan and bone/vessel motion registration software [45]. This improves visualization of vascular tumors and provides better delineation of the vascular supply of the lesion using dual energy techniques. This also reduces onerous demand placed on technicians in postprocessing and reformatting the images to send to the PACS archival system (Fig. 9.8c).
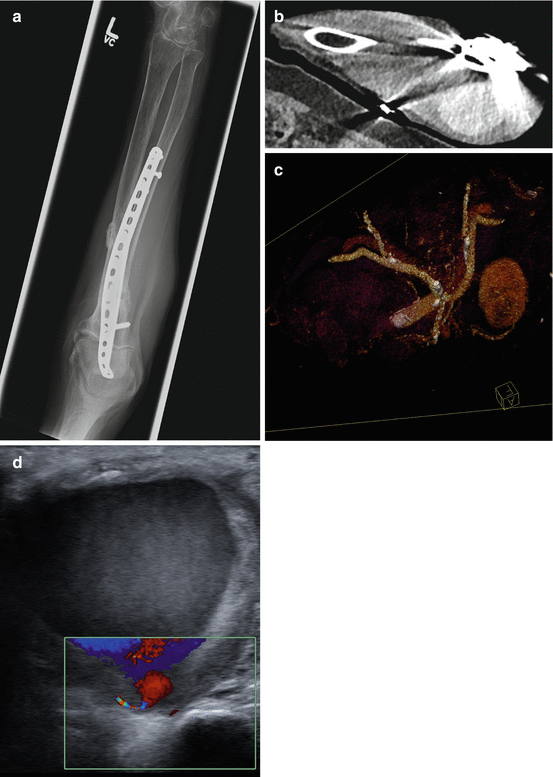

Fig. 9.8
A 80-year female presented with an enlarging mass in the left forearm after open reduction and internal fixation (ORIF) of proximal to mid ulnar fracture (a) and sensory deficit consistent with ulnar nerve distribution involving the fifth digit. (b) Axial oblique DECT post intravenous contrast showed an enhancing ovoid mass that lies medial to the ulnar plate and screws. Monoenergetic function was used to reduce streak artifacts, allowing easy visualization of the mass. (c) 3-D surface-rendered DECT images after application of bone body removal application demonstrate the vascular anatomy of the mass. The mass is continuous with the proximal ulnar artery, possibly an interosseous branch of the ulnar artery. (d) Ultrasound demonstrated a complex cystic mass with highly mobile internal echoes adjacent to the proximal right ulnar artery. Color doppler showed swirling pattern of flow consistent with a pseudoaneurysm, most likely iatrogenic and related to prior ORIF of the midulnar fracture
9.2.3.2 “Iodine Overlay” Liver VNC Application
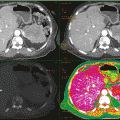
Assessment of the relative vascularity of masses can be accurately assessed through tissue enhancement and iodine concentration on iodine maps. The distribution of iodine correlates with local perfused blood volume and vascular density, thereby assessing for angiogenesis and possible degree of malignancy in soft tissue masses. This allows for assessment of the mass as being benign or malignant or a surrogate biomarker for assessing treatment response [8, 14, 18, 19]. Iodine may increase the depiction and characterization of hypoattenuating lesions through an increase in the contrast between the lesion and the normal adjacent parenchyma on the basis of differences in tissue iodine content [11, 14, 18].
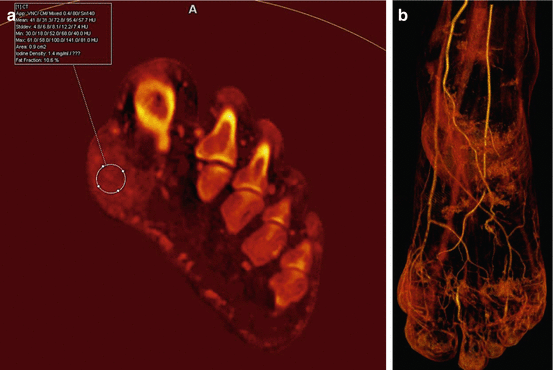
The relatively high atomic weight number and relatively high K-edge (33.2 keV) of iodine result in large changes in attenuation when two different x-ray energies are used to image the lesion in comparison to water, fat, and soft tissue [11, 14]. At the low kV spectrum, the photoelectric effect dominates as previously described. The attenuation of iodine increases exponentially as we approach closer to the k edge of iodine at the low kV energies of 70 and 80 kV. Given this principle, through dedicated post processing algorithms we not only can measure and segment iodine content but can also completely subtract iodine from adjacent soft tissue [6, 9, 25, 46]. Subtracting out iodine allows the creation of virtual noncontrast (VNC) images, thereby eliminating the need for a noncontrast acquisition. This reduces radiation exposure for the patient, while at the same time allowing for assessment of masses with a single scan [23, 24]. This is achieved via three-material decomposition in image space using modeled absorption characteristics of three materials. The concentration of iodine within the imaged vascular structures and masses can be quantified in milligrams of iodine per milliliter of tissue (Fig. 9.9a) or superimposed as an overlay color “iodine map” that only depicts regions of iodine uptake (Fig. 9.9b) [11, 25]. The ability to quantify and map iodine distribution and create VNC images using DECT for musculoskeletal tumors may add depth and insight over routine conventional characterization of soft tissue and bony masses (Fig. 9.10).

