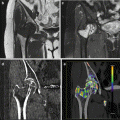
Fig. 3.1
Virtual monochromatic energies. (a) CT image reconstructed at 40 kev. (b) CT image reconstructed at 60 keV (c) CT image reconstructed at 80 keV. (d) Average weighted image used for routine clinical diagnosis. The lesion delineation (arrows) and image quality are optimized at 60 keV
3.3 Linear Image Blending
The low- and high-energy datasets of DE acquisition differ in their image properties. The low-energy image dataset is characterized by higher attenuation of iodinated contrast material as result of greater photoelectric effect and decreased Compton scattering at lower tube voltage. On the other, image noise will also increase. The high-energy image dataset is characterized by low image noise but at the expense of a lower attenuation of contrast material [5].
Mixed or blended image datasets could be readily reconstructed from the low- and high-energy acquisitions. The weighting factor or the blending ratio determines the contribution of low- and high-energy acquisition into the blended image dataset (Fig. 3.2). In practice, a single linear blended image dataset is routinely reconstructed for clinical use. At tube voltages 80 and 140 kVp, the 0.3 blending ratio (30 % from 80 kVp data and 70 % from 140 kVp data) is used to reproduce the image quality of a conventional single-energy 120-kVp acquisition [6]. Blended images are potentially superior to conventional single-energy images because the total radiation dose of the DECT acquisition is utilized, thus reducing quantum noise.
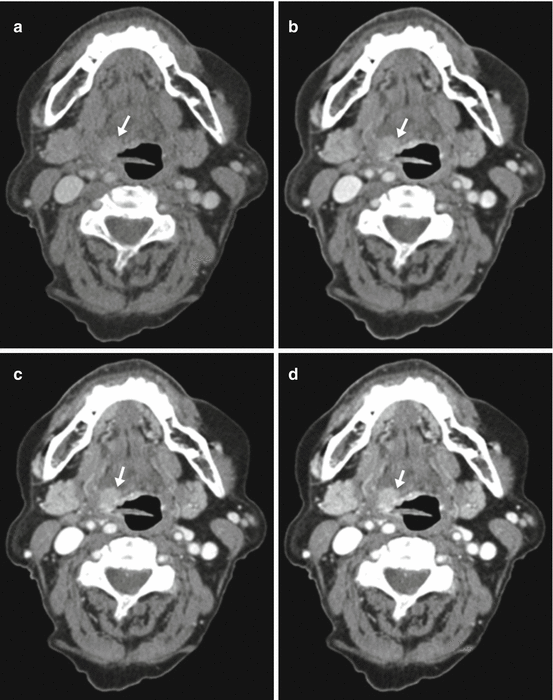
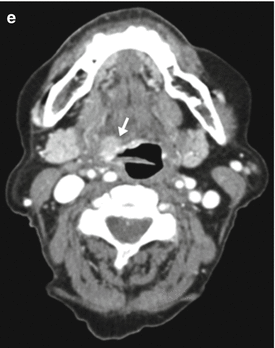


Fig. 3.2
Linear image blending. (a) 140-kVp image. (b) 0.3 weighted-average image (30 % from 80 kVp and 70 % from 140 kVp). (c) 0.6 weighted-average image (60 % from 80 kVp). (d) 0.8 weighted-average image (80 % from 80 kVp). (e) 80-kVp image. The lesion (arrow) and vascular contrast enhancement increase gradually as the tube energy is lowered from (a) through (b). Image noise also increases
Manual manipulation of the blending ratio may be attempted to generate different datasets with variable high contrast contribution from lower energy dataset and low noise level from higher energy dataset, until the best image quality and contrast for an individual scan is reached. This method is, unfortunately, time consuming and can only be done on dedicated workstation. A more practical approach is that a single image dataset with predetermined blending ratio is to be reconstructed and sent to the PACS at the time of CT acquisition. A preliminary study on SCC of the upper aerodigestive tract has reported improved image quality, contrast-to-noise ratios, and subjective lesion delineation using a blending ratio of 0.6 (60 % from 80 kVp and 40 % from Sn140 kVp) compared to the conventional 0.3 blending ratio [7].
3.4 Nonlinear Image Blending
Linear blending of low- and high-energy data uses the same mixing ratio across all the pixels of the image. Alternatively, another approach, nonlinear blending, was developed to increase contrast and minimize noise in the image. Nonlinear blending calculates a different mixing ratio for each image pixel according to a specific formula, depending on the attenuation value of the pixel as a variable. Several nonlinear blending functions have been developed, including binary blending, slope blending, Gaussian, modified sigmoid, and piecewise functions [8]. With nonlinear blending, pixels with attenuation are weighted preferentially towards low-energy data to maximize iodine contrast, while pixels with low attenuation are weighted towards the high-energy data to minimize image noise.
Nonlinear blending results in improved contrast-to-noise values and improved image quality compared to linear blending methods [9] (Fig. 3.3). A study on the use of nonlinear blending in imaging of oral carcinoma reported high contrast and low noise and hence high lesion signal-to-noise ratio and potential improvement in delineation of oral carcinoma [10]. Optimization of nonblending methods in DECT imaging of different body regions is an interesting subject of research [11, 12].
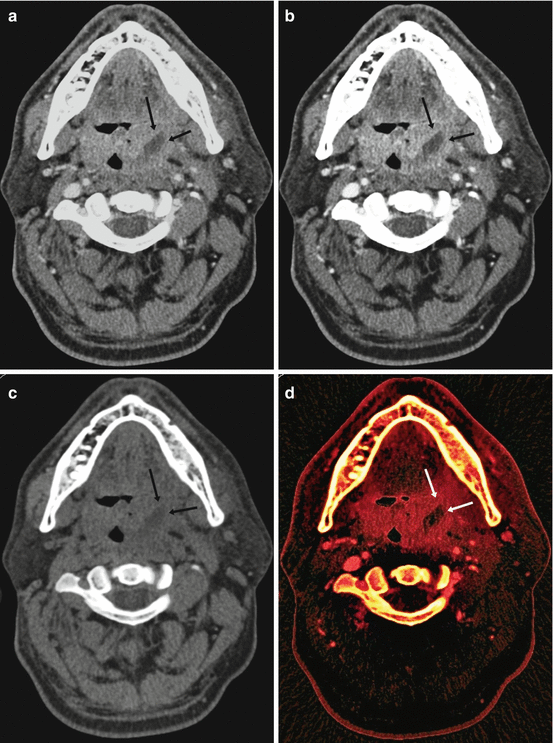

Fig. 3.3
Nonlinear image blending. Virtual unenhanced image. Iodine map. (a) Axial CT image showing an enhancing left tonsillar lesion with central necrosis (arrows). (b) Nonlinear blended image showing high contrast enhancement in the lesion (arrows) with low image noise and improved image quality. (c) Virtual unenhanced image. (d) Iodine map with iodine color code superimposed on the virtual unenhanced image
3.5 Iodine Distribution Map
DE scanning allows material decomposition so that iodine could be differentiated from soft tissue in a contrast-enhanced scan. The approach to iodine characterization differs slightly between single-source and dual-source DECT. Single-source DECT utilizes a two-material decomposition algorithm in the projection (raw data) domain. The attenuation values of the two selected base materials (e.g., water and iodine) at low and high energies are used to generate iodine images and virtual unenhanced images. With dual-source DECT, a three-material decomposition algorithm is utilized in the image domain (after image reconstruction), and is based on the differences in attenuation properties of three materials (e.g., iodine, soft tissue, and fat) at low and high energies. Iodine images and virtual unenhanced images could be then generated [13].
Iodine images may be displayed as gray-scale images or as color-coded overlay maps (Fig. 3.3). In head and neck oncologic imaging, the color-coded map is thought to increase visual lesion detection. Because color is superimposed on original CT images, excellent anatomic details are preserved. Enhanced tumor tissue (color-coded because of iodine content) could be differentiated from other nonenhanced or noniodine containing tissue, even if the CT attenuation values were similar. One of the advantages of iodine overlay maps is the improved depiction of cartilage invasion by hypopharyngeal and laryngeal SCC. In a study by Kuno et al., the addition of color-coded iodine maps to the CT examination of SCC improved the accuracy of diagnosis of cartilage invasion. Iodine maps resulted in improved visual differentiation between the enhanced color-coded tumor and the unenhanced noncalcified thyroid cartilage, thus resulting in higher specificity and diagnostic confidence [14].
Virtual unenhanced images enable differentiation of enhanced lesions from calcification or other high attenuation lesions, without the necessity of scanning the patient before contrast administration.
3.6 Iodine Quantification
The degree of contrast uptake is calculated on conventional CT imaging by double scanning before and after contrast material administration and then subtracting unenhanced from enhanced attenuation values. With DECT, virtual unenhanced images may be used instead of true unenhanced images, thus eliminating the need for scanning before contrast administration so that the patient’s radiation exposure is nearly halved. Another advantage of DE technique is that calculations are performed with single ROI insertion so that misregistration errors in ROI insertion between unenhanced and enhanced scans are avoided.
Stay updated, free articles. Join our Telegram channel

Full access? Get Clinical Tree


